Reports

- Global Locations -

Headquarters

Future Market Insights, Inc.

Christiana Corporate, 200
Continental Drive, Suite 401,
Newark, Delaware - 19713,
United States

T: +1-845-579-5705

Americas

Future Market Insights, Inc.

616 Corporate Way, Suite 2-9018,
Valley Cottage, NY 10989, United States

T: +1-347-918-3531

MEA

Future Market Insights

1602-6 Jumeirah Bay X2 Tower, Plot No: JLT-PH2-X2A,
Jumeirah Lakes Towers, Dubai,
United Arab Emirates

Europe

Future Market Insights

3rd Floor, 207 Regent Street,
W1B 3HH London
United Kingdom

T: + 44 (0) 20 8123 9659
D: +44 (0) 20 3287 4268

Asia Pacific

Future Market Insights

IndiaLand Global Tech Park, Unit UG-1, Behind Grand HighStreet, Phase 1, Hinjawadi, MH, Pune – 411057, India

Patient Transport Services Market Outlook (2022-2032)

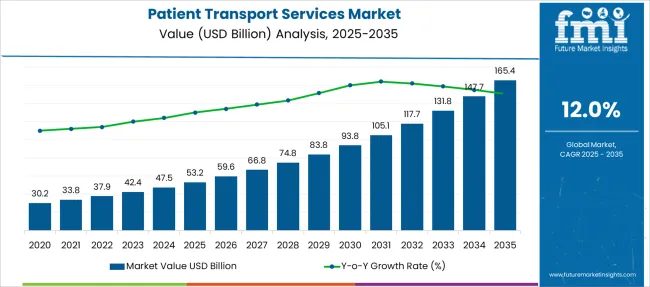
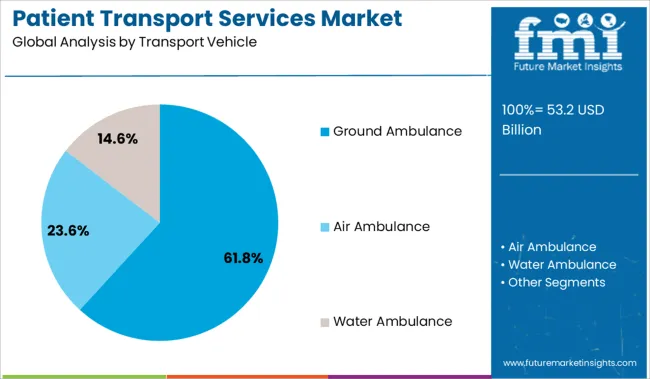
[250 Pages Report] Newly released Patient Transport Services Market analysis report by Future Market Insights shows that global sales of Patient Transport Services Market in 2021 was held at US$ 34.1 Billion. With 12%,the projected market growth during 2022 to 2032 is expected to be significantly higher than the historical growth. Ground Ambulance is expected to be the highest revenue generating Transport Vehicle, projected to grow at a CAGR of over 13.1% during 2022 to 2032.

Attributes Details
Patient Transport Services Market CAGR (2022 to 2032) 12%
Patient Transport Services Market Size (2022) US$ 37.9 Billion
Patient Transport Services Market Size (2032) US$ 117.1 Billion

Don't pay for what you don't need

Customize your report by selecting specific countries or regions and save 30%!

Revenue of Patient Transport Services Market from 2017 to 2021 Compared to Demand Outlook for 2022 to 2032

As per the Patient Transport Services Market research by Future Market Insights - a market research and competitive intelligence provider, historically, from 2017 to 2021, market value of the Patient Transport Services Market increased at around 11% CAGR. The market has been escalating due to growing number of injuries, deaths or health emergencies.

Road traffic accidents are the ninth greatest cause of death in the globe. According to ASIRT, over 37,000 people die in road accidents in the United States each year, with an additional 2.4 Mn injured or handicapped. From 2014 to 2015, according to the Ministry of Road Transport and Highways Transport Research Wing of the Government of India, road accidents climbed by 2.5%, while road accident deaths increased by 4.6%. It further stated that around 400 people die on Indian roadways every day. Tamil Nadu (69,059), Maharashtra (63,805), and Madhya Pradesh were the states with the most road accidents in 2015. (54,947).

Cardiovascular diseases (CVDs) necessitate rapid medical attention and emergency medical services, such as cardiac arrest, congestive heart failure, stroke, and coronary artery disease. CVDs are the largest cause of death worldwide, according to WHO, accounting for 31% of all fatalities in 2015. Stroke was responsible for 6.7 Mn of these deaths, whereas coronary heart disease was responsible for 7.4 Mn. According to the Centers for Disease Control and Prevention (CDC), around 735,000 incidents of heart attack are recorded in the United States each year. According to the British Heart Foundation, heart attacks result in around 200,000 hospital visits each year, or one every three minutes.

Furthermore stroke is estimated to cause roughly 40,000 fatalities in the United Kingdom each year. Cardiovascular Disease is one of the top causes of death worldwide, and it often requires urgent medical intervention, resulting in an increasing number of instances of emergency medical service contracts. This increases the chances for the industry's growth.

  • Patient Transport Services Market was valued at US$ 34.1 Bn in 2021. According to Future Market Insights, Patient Transport Services Market revenue would increase 3X between 2022 and 2032, reaching roughly US$ 117.1 Bn in 2032.
  • In terms of Transport Vehicle Type, the Ground Ambulance accounts for the highest projected CAGR of over 13.1%.
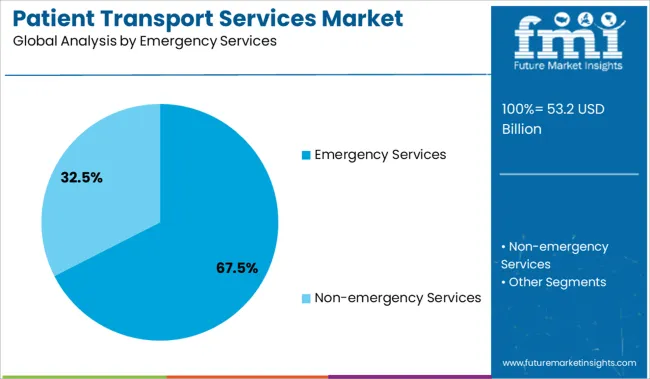
  • In terms of the Emergency Services of Patient Transport Services Market, Emergency Services accounts for the highest CAGR of 11.3% during the historic period (2017-21).
  • US is the dominant region in Patient Transport Services Market with an absolute dollar growth opportunity of over US$ 36.3 Bn.

What Factors are Propelling Patient Transport Services Demand?

The presence of a large population pool over the age of 60, who have reduced immune level and is more susceptible to neurological disorders, heart difficulties, cancer, and spinal injuries, is also projected to be a high impact rendering driver for Patient Transport Services market expansion over the projection period. According to the World Health Organization, the number of individuals aged 65 and more is expected to rise from an estimated 524 million in 2010 to nearly 1.5 billion in 2050. Arthritis, heart attacks, osteoporosis, obesity, and strokes are very common among older population. Patients with severe illnesses may require both emergency and non-emergency services. As a result, the market is expected to rise as the geriatric population grows.

Medical tourism is also on the rise as a result of improved healthcare facilities and reimbursement rules. According to the Directorate-General of Commercial Intelligence and Statistics of India's report "Export Health Services: 2015-2016," India had approximately 58,300 medical tourists with visas for medical travel in 2015-2016. In addition, according to a data published by Ctrip, a renowned Chinese travel operator, medical tourism in China grew by 500% in 2016, with 500,000 outbound medical travels.

Sabyasachi Ghosh
Sabyasachi Ghosh

Principal Consultant

Talk to Analyst

Find your sweet spots for generating winning opportunities in this market.

How the Surge in Medical Tourism Propelled Demand for Patient Transport Services Market?

Patient Transport Services are expected to expand due to a better reimbursement system and a boost in medical tourism through forecast time frames. Medical tourism is frequently regarded by people in wealthy countries if the expense of treatment in their own country is significantly greater.

According to the "Patients Beyond Border" guidebook, average healthcare savings in the most-travelled destinations are Brazil (20-30%),  Costa Rica (45-65%), India (65-90%), Malaysia (65-80%), Mexico (40-65%), Singapore (25-40%), South Korea (30-45%), Taiwan (40-55%), Thailand (50-75%), Turkey (50-65%), using the United States as a benchmark. India, Costa Rica, Turkey, Israel, Singapore, Malaysia, Taiwan, Mexico, South Korea, Thailand, and the United States are among the key medical tourism destinations.

Region-wise Analysis

Which Region is projected to Offer the Largest Opportunity for Patient Transport Services Market?

North America dominated the Patient Transport Services market in 2021, accounting for over 45% of the total revenue. Several major market participants, the need for high quality medical care, the region's well-functioning healthcare infrastructure, and agreeable reimbursement policies and regulatory reforms in the health sector all play significant roles in the growth of the sector. The US healthcare system's emphasis on quality of care and value-based services has resulted in market expansion. Furthermore, the growth of community paramedicine in North America has contributed to the region's large market size.

Community paramedicine permits Emergency Medical Services (EMS) staffs to act outside of their conventional emergency response and transport roles by providing a variety of services such as preventive and primary care. The expansion of market in North America has been fueled by the introduction of fresh concepts and increased consumer demand for better services in this area.

The market in Asia Pacific is expected to grow the fastest over the course of the next decade. Improved medical care infrastructure and an increase in road accidents are among the major factors that are expected to drive the market in the region forward. Traffic-related accidents in Asia Pacific often require emergency medical services, which crops up demand for the emergency medical equipment industry in the region. To avoid squandering of healthcare funding, government initiatives to develop infrastructure are expanding throughout the world.
Get the data you need at a Fraction of the cost

Personalize your report by choosing insights you need
and save 40%!

Country-wise Analysis

Which Country Lies at the Center Stage for Patient Transport Services Market Revenue?

The United States is expected to account for 2/5th of the global revenue by the end of 2032. Technologies that automate vertical take-off and landing (VTOL) aircraft and unmanned aerial systems (UAS) are making the industry more broadly streamlined by permitting new aircraft designs, services, and business models to be made. Air mobility in metropolitan areas (Metropolitan air mobility, UAM) provides people with on-demand travel arrangements that help facilitate urban living.

Category-wise Insights

Which Patient Transport Services Segment is projected to Witness Fastest Growth among Transport Vehicle Type?

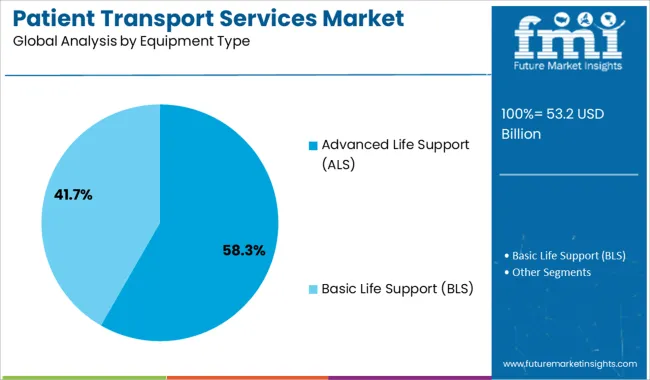
The Ground Ambulance segment is forecasted to grow at the highest CAGR of over 13.1% during 2022-2032. Vans or pickup trucks, cars/SUVs, motorcycles, bicycles, all-terrain vehicles, golf carts, and buses are examples of ground ambulances. Ambulances are classified as Type I, Type II, Type III, and Type IV in the United States. Type I vehicles include rescue vehicles and Advanced Life Support vehicles with large truck chassis (ALS). Vans or pickup vehicles classified as Type II are used to transport patients for Basic Life Support (BLS). Type III ambulances are van-based vehicles that perform similarly to Type I ambulances. Type IV trucks are used for impromptu patient transfers. Different areas have set criteria for ambulance design in terms of outside markings, equipment level, and crash resistance.

Why Demand for Air Ambulance is on Surge?

Air Patient Transport Services are anticipated to grow the fastest over the next three decades. Air ambulances will carry wounded passengers from the scene to medical facilities in airplanes, helicopters, or fixed-wing aircraft. These services are performed almost exclusively as a life-saving method of assisting and evacuating seriously injured or hurt patients. With patient transfers from healthcare facilities being uncommon, patient evacuation generally is the focus of these missions. Air ambulances are quicker than ground and water ambulances, and they can reach remote areas where surface and water ambulances cannot reach. The main drawback of air Patient Transport Services is their high cost.

People are constantly searching for better and safer air medical services to be present in an efficient manner to various locations, which creates opportunities for market growth. Increasing congestion and more congested road systems are causing a rise in the demand for air transportation services. Because these services can transport passengers to various locations more efficiently and safely, this has paved the way for new improvements in existing services, creating future demand for air Patient Transport Services.

Which Services Type of Patient Transport Services is expected to Score Highest Growth in the Coming Years?

The Emergency Services segment is forecasted to grow at the highest CAGR of over 11.3% during 2022-2032. In 2021, the emergency services category led industry revenue, with a 61.5% share. Historical trends Pollyanna predicts that the segment will experience considerable growth over the coming decade. Factors that affect circulatory conditions, such as cardiac arrest, stroke, heart failure, and increased prevalence of COVID-19, are behind the forecasted increase.

Patients with severe injuries or illnesses, as well as those who require immediate medical attention, are served by emergency Patient Transport Services. BLS, ALS, paramedics, and Emergency Medical Technicians are all part of the emergency Patient Transport Services (EMT). Every country has an emergency number for summoning Patient Transport Services to an accident scene, such as 911 in the United States, 999 in the United Kingdom, and 108 in India. Patient Transport Services provide medical and healthcare treatment to patients on the spot and transport them to medical facilities.
What is the impact of Covid-19 on Patient Transport Services Market?

To survive in the industry after the COVID-19 accident, market players have established a variety of commercial tactics, including strategic agreements, technology advancements, and collaborations. Mahindra, for instance, introduced a new battery-powered ambulance with a folding trolley, first aid equipment, air conditioning, an ad display, and an inner lighting display in June 2020.

As more people are opting for air ambulance treatment, as well as the rising utilization by private patients, this industry is most anticipated to steadily increase in the years ahead. Air ambulance companies supply health care and transportation to medical centers for their customers.

Competitive Analysis

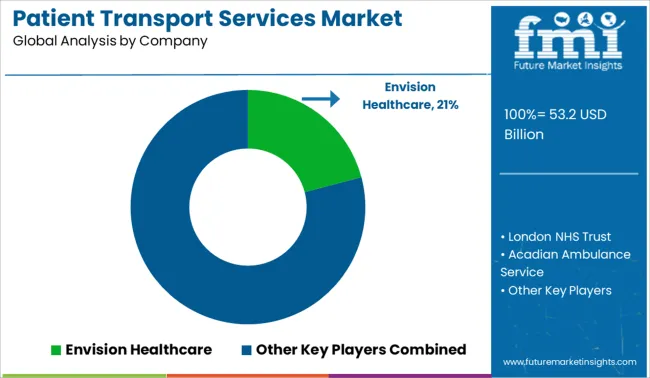
To strengthen their position in the market, key firms use strategies such as mergers and acquisitions, collaborations, and the development of new products. Among the leading players in the global Patient Transport Services market are Envision Healthcare, London Ambulance Service NHS Trust, Acadian Ambulance Service, BVG India Limited, America Patient Transport Services, Inc.

  • In September 2017, for example, BVG India Limited and the government of Andhra Pradesh cooperated to provide emergency medical services in the state. In Andhra Pradesh, the business offered 467 ambulances, including 389 basic life support and 76 advanced life support ambulances. This joint venture is projected to increase the company's revenue.

Similarly, recent developments related to providers of Patient Transport Services have been tracked by the team at Future Market Insights, which are available in the full report.

Patient Transport Services Market Report Scope

Attributes Details
Forecast Period 2022 to 2032
Historical Data Available for 2017 to 2021
Market Analysis US$ Billion for Value
Key Regions Covered North America, Latin America, Europe, APAC, Middle East & Africa
Key Countries Covered United States, UK, China, South Korea, Japan
Key Market Segments Covered Transport Vehicle Type, Emergency Services Type, Equipment Type
Key Companies Profiled
Pricing Available upon Request

Market Segments Covered in Patient Transport Services Market Analysis

By Transport Vehicle:

  • Ground Ambulance
  • Air Ambulance
  • Water Ambulance

By Emergency Services Type:

  • Emergency Services
  • Non-emergency Services

By Equipment Type:

  • Advanced Life Support (ALS) Patient Transport Services
  • Basic Life Support (BLS) Patient Transport Services

By Region:

  • North America
  • Latin America
  • Europe
  • APAC
  • Middle East and Africa(MEA)

Frequently Asked Questions

How much is the current worth of the Patient Transport Services Market?

The global Patient Transport Services Market is worth more than US$ 34.1 Bn at present.

What is the sales forecast for Patient Transport Services Market?

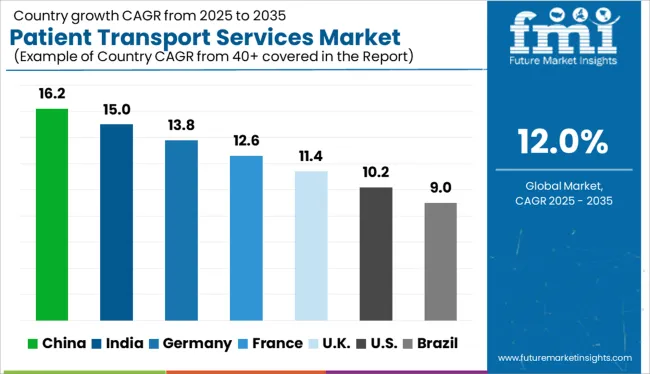
Value of Patient Transport Services are projected to increase at a CAGR of around 12% during 2022 – 2032.

What was the last 5 year’s market CAGR?

Value of Patient Transport Services Market increased at a CAGR of around 11% during 2017 – 2021.

What is a key trend shaping the growth of the market for Patient Transport Services Market?

The market is growing due to an increase in the number of traffic accidents and the incidence of cardiovascular disorders among consumers.

At what percentage is sales of Patient Transport Services Market going to register growth in US?

The market for Patient Transport Services Market in US is projected to expand at a CAGR of around 13% during 2022 – 2032.

Table of Content

1. Executive Summary

    1.1. Global Market Outlook

    1.2. Demand-side Trends

    1.3. Supply-side Trends

    1.4. Technology Roadmap Analysis

    1.5. Analysis and Recommendations

2. Market Overview

    2.1. Market Coverage / Taxonomy

    2.2. Market Definition / Scope / Limitations

3. Market Background

    3.1. Market Dynamics

        3.1.1. Drivers

        3.1.2. Restraints

        3.1.3. Opportunity

        3.1.4. Trends

    3.2. Scenario Forecast

        3.2.1. Demand in Optimistic Scenario

        3.2.2. Demand in Likely Scenario

        3.2.3. Demand in Conservative Scenario

    3.3. Opportunity Map Analysis

    3.4. Investment Feasibility Matrix

    3.5. PESTLE and Porter’s Analysis

    3.6. Regulatory Landscape

        3.6.1. By Key Regions

        3.6.2. By Key Countries

4. Global Patient Transport Services Market Analysis 2017-2021 and Forecast, 2022-2032

    4.1. Historical Market Size Value (US$ Mn) Analysis, 2017-2021

    4.2. Current and Future Market Size Value (US$ Mn) Projections, 2022-2032

        4.2.1. Y-o-Y Growth Trend Analysis

        4.2.2. Absolute $ Opportunity Analysis

5. Global Patient Transport Services Market Analysis 2017-2021 and Forecast 2022-2032, By Transport Vehicle

    5.1. Introduction / Key Findings

    5.2. Historical Market Size Value (US$ Mn) Analysis By Transport Vehicle, 2017-2021

    5.3. Current and Future Market Size Value (US$ Mn) Analysis and Forecast By Transport Vehicle, 2022-2032

        5.3.1. Ground Ambulance

        5.3.2. Air Ambulance

        5.3.3. Water Ambulance

    5.4. Y-o-Y Growth Trend Analysis By Transport Vehicle, 2017-2021

    5.5. Absolute $ Opportunity Analysis By Transport Vehicle, 2022-2032

6. Global Patient Transport Services Market Analysis 2017-2021 and Forecast 2022-2032, By Emergency Services

    6.1. Introduction / Key Findings

    6.2. Historical Market Size Value (US$ Mn) Analysis By Emergency Services, 2017-2021

    6.3. Current and Future Market Size Value (US$ Mn) Analysis and Forecast By Emergency Services, 2022-2032

        6.3.1. Emergency Services

        6.3.2. Non-emergency Services

    6.4. Y-o-Y Growth Trend Analysis By Emergency Services, 2017-2021

    6.5. Absolute $ Opportunity Analysis By Emergency Services, 2022-2032

7. Global Patient Transport Services Market Analysis 2017-2021 and Forecast 2022-2032, By Equipment Type

    7.1. Introduction / Key Findings

    7.2. Historical Market Size Value (US$ Mn) Analysis By Equipment Type, 2017-2021

    7.3. Current and Future Market Size Value (US$ Mn) Analysis and Forecast By Equipment Type, 2022-2032

        7.3.1. Advanced Life Support (ALS) Patient Transport Services

        7.3.2. Basic Life Support (BLS) Patient Transport Services

    7.4. Y-o-Y Growth Trend Analysis By Equipment Type, 2017-2021

    7.5. Absolute $ Opportunity Analysis By Equipment Type, 2022-2032

8. Global Patient Transport Services Market Analysis 2017-2021 and Forecast 2022-2032, By Region

    8.1. Introduction

    8.2. Historical Market Size Value (US$ Mn) Analysis By Region, 2017-2021

    8.3. Current Market Size Value (US$ Mn) Analysis and Forecast By Region, 2022-2032

        8.3.1. North America

        8.3.2. Latin America

        8.3.3. Europe

        8.3.4. Asia Pacific

        8.3.5. MEA

    8.4. Market Attractiveness Analysis By Region

9. North America Patient Transport Services Market Analysis 2017-2021 and Forecast 2022-2032, By Country

    9.1. Historical Market Size Value (US$ Mn) Trend Analysis By Market Taxonomy, 2017-2021

    9.2. Market Size Value (US$ Mn) Forecast By Market Taxonomy, 2022-2032

        9.2.1. By Country

            9.2.1.1. U.S.

            9.2.1.2. Canada

        9.2.2. By Transport Vehicle

        9.2.3. By Emergency Services

        9.2.4. By Equipment Type

    9.3. Market Attractiveness Analysis

        9.3.1. By Country

        9.3.2. By Transport Vehicle

        9.3.3. By Emergency Services

        9.3.4. By Equipment Type

    9.4. Key Takeaways

10. Latin America Patient Transport Services Market Analysis 2017-2021 and Forecast 2022-2032, By Country

    10.1. Historical Market Size Value (US$ Mn) Trend Analysis By Market Taxonomy, 2017-2021

    10.2. Market Size Value (US$ Mn) Forecast By Market Taxonomy, 2022-2032

        10.2.1. By Country

            10.2.1.1. Brazil

            10.2.1.2. Mexico

            10.2.1.3. Rest of Latin America

        10.2.2. By Transport Vehicle

        10.2.3. By Emergency Services

        10.2.4. By Equipment Type

    10.3. Market Attractiveness Analysis

        10.3.1. By Country

        10.3.2. By Transport Vehicle

        10.3.3. By Emergency Services

        10.3.4. By Equipment Type

    10.4. Key Takeaways

11. Europe Patient Transport Services Market Analysis 2017-2021 and Forecast 2022-2032, By Country

    11.1. Historical Market Size Value (US$ Mn) Trend Analysis By Market Taxonomy, 2017-2021

    11.2. Market Size Value (US$ Mn) Forecast By Market Taxonomy, 2022-2032

        11.2.1. By Country

            11.2.1.1. Germany

            11.2.1.2. Italy

            11.2.1.3. France

            11.2.1.4. U.K.

            11.2.1.5. Spain

            11.2.1.6. Russia

            11.2.1.7. BENELUX

            11.2.1.8. Rest of Europe

        11.2.2. By Transport Vehicle

        11.2.3. By Emergency Services

        11.2.4. By Equipment Type

    11.3. Market Attractiveness Analysis

        11.3.1. By Country

        11.3.2. By Transport Vehicle

        11.3.3. By Emergency Services

        11.3.4. By Equipment Type

    11.4. Key Takeaways

12. Asia Pacific Patient Transport Services Market Analysis 2017-2021 and Forecast 2022-2032, By Country

    12.1. Historical Market Size Value (US$ Mn) Trend Analysis By Market Taxonomy, 2017-2021

    12.2. Market Size Value (US$ Mn) Forecast By Market Taxonomy, 2022-2032

        12.2.1. By Country

            12.2.1.1. China

            12.2.1.2. Japan

            12.2.1.3. South Korea

            12.2.1.4. India

            12.2.1.5. Rest of Asia Pacific

        12.2.2. By Transport Vehicle

        12.2.3. By Emergency Services

        12.2.4. By Equipment Type

    12.3. Market Attractiveness Analysis

        12.3.1. By Country

        12.3.2. By Transport Vehicle

        12.3.3. By Emergency Services

        12.3.4. By Equipment Type

    12.4. Key Takeaways

13. MEA Patient Transport Services Market Analysis 2017-2021 and Forecast 2022-2032, By Country

    13.1. Historical Market Size Value (US$ Mn) Trend Analysis By Market Taxonomy, 2017-2021

    13.2. Market Size Value (US$ Mn) Forecast By Market Taxonomy, 2022-2032

        13.2.1. By Country

            13.2.1.1. GCC

            13.2.1.2. Rest of MEA

        13.2.2. By Transport Vehicle

        13.2.3. By Emergency Services

        13.2.4. By Equipment Type

    13.3. Market Attractiveness Analysis

        13.3.1. By Country

        13.3.2. By Transport Vehicle

        13.3.3. By Emergency Services

        13.3.4. By Equipment Type

    13.4. Key Takeaways

14. Key Countries Patient Transport Services Market Analysis

    14.1. U.S.

        14.1.1. Pricing Analysis

        14.1.2. Market Share Analysis, 2021

            14.1.2.1. By Transport Vehicle

            14.1.2.2. By Emergency Services

            14.1.2.3. By Equipment Type

    14.2. Canada

        14.2.1. Pricing Analysis

        14.2.2. Market Share Analysis, 2021

            14.2.2.1. By Transport Vehicle

            14.2.2.2. By Emergency Services

            14.2.2.3. By Equipment Type

    14.3. Brazil

        14.3.1. Pricing Analysis

        14.3.2. Market Share Analysis, 2021

            14.3.2.1. By Transport Vehicle

            14.3.2.2. By Emergency Services

            14.3.2.3. By Equipment Type

    14.4. Mexico

        14.4.1. Pricing Analysis

        14.4.2. Market Share Analysis, 2021

            14.4.2.1. By Transport Vehicle

            14.4.2.2. By Emergency Services

            14.4.2.3. By Equipment Type

    14.5. Argentina

        14.5.1. Pricing Analysis

        14.5.2. Market Share Analysis, 2021

            14.5.2.1. By Transport Vehicle

            14.5.2.2. By Emergency Services

            14.5.2.3. By Equipment Type

    14.6. Germany

        14.6.1. Pricing Analysis

        14.6.2. Market Share Analysis, 2021

            14.6.2.1. By Transport Vehicle

            14.6.2.2. By Emergency Services

            14.6.2.3. By Equipment Type

    14.7. Italy

        14.7.1. Pricing Analysis

        14.7.2. Market Share Analysis, 2021

            14.7.2.1. By Transport Vehicle

            14.7.2.2. By Emergency Services

            14.7.2.3. By Equipment Type

    14.8. France

        14.8.1. Pricing Analysis

        14.8.2. Market Share Analysis, 2021

            14.8.2.1. By Transport Vehicle

            14.8.2.2. By Emergency Services

            14.8.2.3. By Equipment Type

    14.9. U.K.

        14.9.1. Pricing Analysis

        14.9.2. Market Share Analysis, 2021

            14.9.2.1. By Transport Vehicle

            14.9.2.2. By Emergency Services

            14.9.2.3. By Equipment Type

    14.10. Spain

        14.10.1. Pricing Analysis

        14.10.2. Market Share Analysis, 2021

            14.10.2.1. By Transport Vehicle

            14.10.2.2. By Emergency Services

            14.10.2.3. By Equipment Type

    14.11. Russia

        14.11.1. Pricing Analysis

        14.11.2. Market Share Analysis, 2021

            14.11.2.1. By Transport Vehicle

            14.11.2.2. By Emergency Services

            14.11.2.3. By Equipment Type

    14.12. BENELUX

        14.12.1. Pricing Analysis

        14.12.2. Market Share Analysis, 2021

            14.12.2.1. By Transport Vehicle

            14.12.2.2. By Emergency Services

            14.12.2.3. By Equipment Type

    14.13. China

        14.13.1. Pricing Analysis

        14.13.2. Market Share Analysis, 2021

            14.13.2.1. By Transport Vehicle

            14.13.2.2. By Emergency Services

            14.13.2.3. By Equipment Type

    14.14. Japan

        14.14.1. Pricing Analysis

        14.14.2. Market Share Analysis, 2021

            14.14.2.1. By Transport Vehicle

            14.14.2.2. By Emergency Services

            14.14.2.3. By Equipment Type

    14.15. South Korea

        14.15.1. Pricing Analysis

        14.15.2. Market Share Analysis, 2021

            14.15.2.1. By Transport Vehicle

            14.15.2.2. By Emergency Services

            14.15.2.3. By Equipment Type

    14.16. India

        14.16.1. Pricing Analysis

        14.16.2. Market Share Analysis, 2021

            14.16.2.1. By Transport Vehicle

            14.16.2.2. By Emergency Services

            14.16.2.3. By Equipment Type

    14.17. GCC Countries

        14.17.1. Pricing Analysis

        14.17.2. Market Share Analysis, 2021

            14.17.2.1. By Transport Vehicle

            14.17.2.2. By Emergency Services

            14.17.2.3. By Equipment Type

15. Market Structure Analysis

    15.1. Competition Dashboard

    15.2. Competition Benchmarking

    15.3. Market Share Analysis of Top Players

        15.3.1. By Regional

        15.3.2. By Transport Vehicle

        15.3.3. By Emergency Services

        15.3.4. By Equipment Type

16. Competition Analysis

    16.1. Competition Deep Dive

        16.1.1. Envision Healthcare

            16.1.1.1. Overview

            16.1.1.2. Product Portfolio

            16.1.1.3. Profitability by Market Segment

            16.1.1.4. Sales Footprint

            16.1.1.5. Strategy Overview

                16.1.1.5.1. Marketing Strategy

        16.1.2. London Patient Transport Services NHS Trust

            16.1.2.1. Overview

            16.1.2.2. Product Portfolio

            16.1.2.3. Profitability by Market Segment

            16.1.2.4. Sales Footprint

            16.1.2.5. Strategy Overview

                16.1.2.5.1. Marketing Strategy

        16.1.3. Acadian Ambulance Service

            16.1.3.1. Overview

            16.1.3.2. Product Portfolio

            16.1.3.3. Profitability by Market Segment

            16.1.3.4. Sales Footprint

            16.1.3.5. Strategy Overview

                16.1.3.5.1. Marketing Strategy

        16.1.4. BVG India Limited

            16.1.4.1. Overview

            16.1.4.2. Product Portfolio

            16.1.4.3. Profitability by Market Segment

            16.1.4.4. Sales Footprint

            16.1.4.5. Strategy Overview

                16.1.4.5.1. Marketing Strategy

        16.1.5. America Patient Transport Services, Inc.

            16.1.5.1. Overview

            16.1.5.2. Product Portfolio

            16.1.5.3. Profitability by Market Segment

            16.1.5.4. Sales Footprint

            16.1.5.5. Strategy Overview

                16.1.5.5.1. Marketing Strategy

        16.1.6. Falck Denamark A/S

            16.1.6.1. Overview

            16.1.6.2. Product Portfolio

            16.1.6.3. Profitability by Market Segment

            16.1.6.4. Sales Footprint

            16.1.6.5. Strategy Overview

                16.1.6.5.1. Marketing Strategy

        16.1.7. Air Medical Group Holdings, Inc.

            16.1.7.1. Overview

            16.1.7.2. Product Portfolio

            16.1.7.3. Profitability by Market Segment

            16.1.7.4. Sales Footprint

            16.1.7.5. Strategy Overview

                16.1.7.5.1. Marketing Strategy

        16.1.8. Air Methods Corporation

            16.1.8.1. Overview

            16.1.8.2. Product Portfolio

            16.1.8.3. Profitability by Market Segment

            16.1.8.4. Sales Footprint

            16.1.8.5. Strategy Overview

                16.1.8.5.1. Marketing Strategy

        16.1.9. Ziqitza Healthcare Limited

            16.1.9.1. Overview

            16.1.9.2. Product Portfolio

            16.1.9.3. Profitability by Market Segment

            16.1.9.4. Sales Footprint

            16.1.9.5. Strategy Overview

                16.1.9.5.1. Marketing Strategy

        16.1.10. Medivic Aviation

            16.1.10.1. Overview

            16.1.10.2. Product Portfolio

            16.1.10.3. Profitability by Market Segment

            16.1.10.4. Sales Footprint

            16.1.10.5. Strategy Overview

                16.1.10.5.1. Marketing Strategy

17. Assumptions & Acronyms Used

18. Research Methodology

Don't pay for what you don't need

Customize your report by selecting specific countries or regions and save 30%!

List of Tables

Table 1: Global Patient Transport Services Market Value (US$ Mn) Forecast by Region, 2017-2032

Table 2: Global Patient Transport Services Market Value (US$ Mn) Forecast by Transport Vehicle, 2017-2032

Table 3: Global Patient Transport Services Market Value (US$ Mn) Forecast by Emergency Services, 2017-2032

Table 4: Global Patient Transport Services Market Value (US$ Mn) Forecast by Equipment Type, 2017-2032

Table 5: North America Patient Transport Services Market Value (US$ Mn) Forecast by Country, 2017-2032

Table 6: North America Patient Transport Services Market Value (US$ Mn) Forecast by Transport Vehicle, 2017-2032

Table 7: North America Patient Transport Services Market Value (US$ Mn) Forecast by Emergency Services, 2017-2032

Table 8: North America Patient Transport Services Market Value (US$ Mn) Forecast by Equipment Type, 2017-2032

Table 9: Latin America Patient Transport Services Market Value (US$ Mn) Forecast by Country, 2017-2032

Table 10: Latin America Patient Transport Services Market Value (US$ Mn) Forecast by Transport Vehicle, 2017-2032

Table 11: Latin America Patient Transport Services Market Value (US$ Mn) Forecast by Emergency Services, 2017-2032

Table 12: Latin America Patient Transport Services Market Value (US$ Mn) Forecast by Equipment Type, 2017-2032

Table 13: Europe Patient Transport Services Market Value (US$ Mn) Forecast by Country, 2017-2032

Table 14: Europe Patient Transport Services Market Value (US$ Mn) Forecast by Transport Vehicle, 2017-2032

Table 15: Europe Patient Transport Services Market Value (US$ Mn) Forecast by Emergency Services, 2017-2032

Table 16: Europe Patient Transport Services Market Value (US$ Mn) Forecast by Equipment Type, 2017-2032

Table 17: Asia Pacific Patient Transport Services Market Value (US$ Mn) Forecast by Country, 2017-2032

Table 18: Asia Pacific Patient Transport Services Market Value (US$ Mn) Forecast by Transport Vehicle, 2017-2032

Table 19: Asia Pacific Patient Transport Services Market Value (US$ Mn) Forecast by Emergency Services, 2017-2032

Table 20: Asia Pacific Patient Transport Services Market Value (US$ Mn) Forecast by Equipment Type, 2017-2032

Table 21: MEA Patient Transport Services Market Value (US$ Mn) Forecast by Country, 2017-2032

Table 22: MEA Patient Transport Services Market Value (US$ Mn) Forecast by Transport Vehicle, 2017-2032

Table 23: MEA Patient Transport Services Market Value (US$ Mn) Forecast by Emergency Services, 2017-2032

Table 24: MEA Patient Transport Services Market Value (US$ Mn) Forecast by Equipment Type, 2017-2032
Sabyasachi Ghosh
Sabyasachi Ghosh

Principal Consultant

Talk to Analyst

Find your sweet spots for generating winning opportunities in this market.

List of Charts

Figure 1: Global Patient Transport Services Market Value (US$ Mn) by Transport Vehicle, 2022-2032

Figure 2: Global Patient Transport Services Market Value (US$ Mn) by Emergency Services, 2022-2032

Figure 3: Global Patient Transport Services Market Value (US$ Mn) by Equipment Type, 2022-2032

Figure 4: Global Patient Transport Services Market Value (US$ Mn) by Region, 2022-2032

Figure 5: Global Patient Transport Services Market Value (US$ Mn) Analysis by Region, 2017-2032

Figure 6: Global Patient Transport Services Market Value Share (%) and BPS Analysis by Region, 2022-2032

Figure 7: Global Patient Transport Services Market Y-o-Y Growth (%) Projections by Region, 2022-2032

Figure 8: Global Patient Transport Services Market Value (US$ Mn) Analysis by Transport Vehicle, 2017-2032

Figure 9: Global Patient Transport Services Market Value Share (%) and BPS Analysis by Transport Vehicle, 2022-2032

Figure 10: Global Patient Transport Services Market Y-o-Y Growth (%) Projections by Transport Vehicle, 2022-2032

Figure 11: Global Patient Transport Services Market Value (US$ Mn) Analysis by Emergency Services, 2017-2032

Figure 12: Global Patient Transport Services Market Value Share (%) and BPS Analysis by Emergency Services, 2022-2032

Figure 13: Global Patient Transport Services Market Y-o-Y Growth (%) Projections by Emergency Services, 2022-2032

Figure 14: Global Patient Transport Services Market Value (US$ Mn) Analysis by Equipment Type, 2017-2032

Figure 15: Global Patient Transport Services Market Value Share (%) and BPS Analysis by Equipment Type, 2022-2032

Figure 16: Global Patient Transport Services Market Y-o-Y Growth (%) Projections by Equipment Type, 2022-2032

Figure 17: Global Patient Transport Services Market Attractiveness by Transport Vehicle, 2022-2032

Figure 18: Global Patient Transport Services Market Attractiveness by Emergency Services, 2022-2032

Figure 19: Global Patient Transport Services Market Attractiveness by Equipment Type, 2022-2032

Figure 20: Global Patient Transport Services Market Attractiveness by Region, 2022-2032

Figure 21: North America Patient Transport Services Market Value (US$ Mn) by Transport Vehicle, 2022-2032

Figure 22: North America Patient Transport Services Market Value (US$ Mn) by Emergency Services, 2022-2032

Figure 23: North America Patient Transport Services Market Value (US$ Mn) by Equipment Type, 2022-2032

Figure 24: North America Patient Transport Services Market Value (US$ Mn) by Country, 2022-2032

Figure 25: North America Patient Transport Services Market Value (US$ Mn) Analysis by Country, 2017-2032

Figure 26: North America Patient Transport Services Market Value Share (%) and BPS Analysis by Country, 2022-2032

Figure 27: North America Patient Transport Services Market Y-o-Y Growth (%) Projections by Country, 2022-2032

Figure 28: North America Patient Transport Services Market Value (US$ Mn) Analysis by Transport Vehicle, 2017-2032

Figure 29: North America Patient Transport Services Market Value Share (%) and BPS Analysis by Transport Vehicle, 2022-2032

Figure 30: North America Patient Transport Services Market Y-o-Y Growth (%) Projections by Transport Vehicle, 2022-2032

Figure 31: North America Patient Transport Services Market Value (US$ Mn) Analysis by Emergency Services, 2017-2032

Figure 32: North America Patient Transport Services Market Value Share (%) and BPS Analysis by Emergency Services, 2022-2032

Figure 33: North America Patient Transport Services Market Y-o-Y Growth (%) Projections by Emergency Services, 2022-2032

Figure 34: North America Patient Transport Services Market Value (US$ Mn) Analysis by Equipment Type, 2017-2032

Figure 35: North America Patient Transport Services Market Value Share (%) and BPS Analysis by Equipment Type, 2022-2032

Figure 36: North America Patient Transport Services Market Y-o-Y Growth (%) Projections by Equipment Type, 2022-2032

Figure 37: North America Patient Transport Services Market Attractiveness by Transport Vehicle, 2022-2032

Figure 38: North America Patient Transport Services Market Attractiveness by Emergency Services, 2022-2032

Figure 39: North America Patient Transport Services Market Attractiveness by Equipment Type, 2022-2032

Figure 40: North America Patient Transport Services Market Attractiveness by Country, 2022-2032

Figure 41: Latin America Patient Transport Services Market Value (US$ Mn) by Transport Vehicle, 2022-2032

Figure 42: Latin America Patient Transport Services Market Value (US$ Mn) by Emergency Services, 2022-2032

Figure 43: Latin America Patient Transport Services Market Value (US$ Mn) by Equipment Type, 2022-2032

Figure 44: Latin America Patient Transport Services Market Value (US$ Mn) by Country, 2022-2032

Figure 45: Latin America Patient Transport Services Market Value (US$ Mn) Analysis by Country, 2017-2032

Figure 46: Latin America Patient Transport Services Market Value Share (%) and BPS Analysis by Country, 2022-2032

Figure 47: Latin America Patient Transport Services Market Y-o-Y Growth (%) Projections by Country, 2022-2032

Figure 48: Latin America Patient Transport Services Market Value (US$ Mn) Analysis by Transport Vehicle, 2017-2032

Figure 49: Latin America Patient Transport Services Market Value Share (%) and BPS Analysis by Transport Vehicle, 2022-2032

Figure 50: Latin America Patient Transport Services Market Y-o-Y Growth (%) Projections by Transport Vehicle, 2022-2032

Figure 51: Latin America Patient Transport Services Market Value (US$ Mn) Analysis by Emergency Services, 2017-2032

Figure 52: Latin America Patient Transport Services Market Value Share (%) and BPS Analysis by Emergency Services, 2022-2032

Figure 53: Latin America Patient Transport Services Market Y-o-Y Growth (%) Projections by Emergency Services, 2022-2032

Figure 54: Latin America Patient Transport Services Market Value (US$ Mn) Analysis by Equipment Type, 2017-2032

Figure 55: Latin America Patient Transport Services Market Value Share (%) and BPS Analysis by Equipment Type, 2022-2032

Figure 56: Latin America Patient Transport Services Market Y-o-Y Growth (%) Projections by Equipment Type, 2022-2032

Figure 57: Latin America Patient Transport Services Market Attractiveness by Transport Vehicle, 2022-2032

Figure 58: Latin America Patient Transport Services Market Attractiveness by Emergency Services, 2022-2032

Figure 59: Latin America Patient Transport Services Market Attractiveness by Equipment Type, 2022-2032

Figure 60: Latin America Patient Transport Services Market Attractiveness by Country, 2022-2032

Figure 61: Europe Patient Transport Services Market Value (US$ Mn) by Transport Vehicle, 2022-2032

Figure 62: Europe Patient Transport Services Market Value (US$ Mn) by Emergency Services, 2022-2032

Figure 63: Europe Patient Transport Services Market Value (US$ Mn) by Equipment Type, 2022-2032

Figure 64: Europe Patient Transport Services Market Value (US$ Mn) by Country, 2022-2032

Figure 65: Europe Patient Transport Services Market Value (US$ Mn) Analysis by Country, 2017-2032

Figure 66: Europe Patient Transport Services Market Value Share (%) and BPS Analysis by Country, 2022-2032

Figure 67: Europe Patient Transport Services Market Y-o-Y Growth (%) Projections by Country, 2022-2032

Figure 68: Europe Patient Transport Services Market Value (US$ Mn) Analysis by Transport Vehicle, 2017-2032

Figure 69: Europe Patient Transport Services Market Value Share (%) and BPS Analysis by Transport Vehicle, 2022-2032

Figure 70: Europe Patient Transport Services Market Y-o-Y Growth (%) Projections by Transport Vehicle, 2022-2032

Figure 71: Europe Patient Transport Services Market Value (US$ Mn) Analysis by Emergency Services, 2017-2032

Figure 72: Europe Patient Transport Services Market Value Share (%) and BPS Analysis by Emergency Services, 2022-2032

Figure 73: Europe Patient Transport Services Market Y-o-Y Growth (%) Projections by Emergency Services, 2022-2032

Figure 74: Europe Patient Transport Services Market Value (US$ Mn) Analysis by Equipment Type, 2017-2032

Figure 75: Europe Patient Transport Services Market Value Share (%) and BPS Analysis by Equipment Type, 2022-2032

Figure 76: Europe Patient Transport Services Market Y-o-Y Growth (%) Projections by Equipment Type, 2022-2032

Figure 77: Europe Patient Transport Services Market Attractiveness by Transport Vehicle, 2022-2032

Figure 78: Europe Patient Transport Services Market Attractiveness by Emergency Services, 2022-2032

Figure 79: Europe Patient Transport Services Market Attractiveness by Equipment Type, 2022-2032

Figure 80: Europe Patient Transport Services Market Attractiveness by Country, 2022-2032

Figure 81: Asia Pacific Patient Transport Services Market Value (US$ Mn) by Transport Vehicle, 2022-2032

Figure 82: Asia Pacific Patient Transport Services Market Value (US$ Mn) by Emergency Services, 2022-2032

Figure 83: Asia Pacific Patient Transport Services Market Value (US$ Mn) by Equipment Type, 2022-2032

Figure 84: Asia Pacific Patient Transport Services Market Value (US$ Mn) by Country, 2022-2032

Figure 85: Asia Pacific Patient Transport Services Market Value (US$ Mn) Analysis by Country, 2017-2032

Figure 86: Asia Pacific Patient Transport Services Market Value Share (%) and BPS Analysis by Country, 2022-2032

Figure 87: Asia Pacific Patient Transport Services Market Y-o-Y Growth (%) Projections by Country, 2022-2032

Figure 88: Asia Pacific Patient Transport Services Market Value (US$ Mn) Analysis by Transport Vehicle, 2017-2032

Figure 89: Asia Pacific Patient Transport Services Market Value Share (%) and BPS Analysis by Transport Vehicle, 2022-2032

Figure 90: Asia Pacific Patient Transport Services Market Y-o-Y Growth (%) Projections by Transport Vehicle, 2022-2032

Figure 91: Asia Pacific Patient Transport Services Market Value (US$ Mn) Analysis by Emergency Services, 2017-2032

Figure 92: Asia Pacific Patient Transport Services Market Value Share (%) and BPS Analysis by Emergency Services, 2022-2032

Figure 93: Asia Pacific Patient Transport Services Market Y-o-Y Growth (%) Projections by Emergency Services, 2022-2032

Figure 94: Asia Pacific Patient Transport Services Market Value (US$ Mn) Analysis by Equipment Type, 2017-2032

Figure 95: Asia Pacific Patient Transport Services Market Value Share (%) and BPS Analysis by Equipment Type, 2022-2032

Figure 96: Asia Pacific Patient Transport Services Market Y-o-Y Growth (%) Projections by Equipment Type, 2022-2032

Figure 97: Asia Pacific Patient Transport Services Market Attractiveness by Transport Vehicle, 2022-2032

Figure 98: Asia Pacific Patient Transport Services Market Attractiveness by Emergency Services, 2022-2032

Figure 99: Asia Pacific Patient Transport Services Market Attractiveness by Equipment Type, 2022-2032

Figure 100: Asia Pacific Patient Transport Services Market Attractiveness by Country, 2022-2032

Figure 101: MEA Patient Transport Services Market Value (US$ Mn) by Transport Vehicle, 2022-2032

Figure 102: MEA Patient Transport Services Market Value (US$ Mn) by Emergency Services, 2022-2032

Figure 103: MEA Patient Transport Services Market Value (US$ Mn) by Equipment Type, 2022-2032

Figure 104: MEA Patient Transport Services Market Value (US$ Mn) by Country, 2022-2032

Figure 105: MEA Patient Transport Services Market Value (US$ Mn) Analysis by Country, 2017-2032

Figure 106: MEA Patient Transport Services Market Value Share (%) and BPS Analysis by Country, 2022-2032

Figure 107: MEA Patient Transport Services Market Y-o-Y Growth (%) Projections by Country, 2022-2032

Figure 108: MEA Patient Transport Services Market Value (US$ Mn) Analysis by Transport Vehicle, 2017-2032

Figure 109: MEA Patient Transport Services Market Value Share (%) and BPS Analysis by Transport Vehicle, 2022-2032

Figure 110: MEA Patient Transport Services Market Y-o-Y Growth (%) Projections by Transport Vehicle, 2022-2032

Figure 111: MEA Patient Transport Services Market Value (US$ Mn) Analysis by Emergency Services, 2017-2032

Figure 112: MEA Patient Transport Services Market Value Share (%) and BPS Analysis by Emergency Services, 2022-2032

Figure 113: MEA Patient Transport Services Market Y-o-Y Growth (%) Projections by Emergency Services, 2022-2032

Figure 114: MEA Patient Transport Services Market Value (US$ Mn) Analysis by Equipment Type, 2017-2032

Figure 115: MEA Patient Transport Services Market Value Share (%) and BPS Analysis by Equipment Type, 2022-2032

Figure 116: MEA Patient Transport Services Market Y-o-Y Growth (%) Projections by Equipment Type, 2022-2032

Figure 117: MEA Patient Transport Services Market Attractiveness by Transport Vehicle, 2022-2032

Figure 118: MEA Patient Transport Services Market Attractiveness by Emergency Services, 2022-2032

Figure 119: MEA Patient Transport Services Market Attractiveness by Equipment Type, 2022-2032

Figure 120: MEA Patient Transport Services Market Attractiveness by Country, 2022-2032

Explore Healthcare Insights

View Reports

Patient Transport Services Market