Reports

- Global Locations -

Headquarters

Future Market Insights, Inc.

Christiana Corporate, 200
Continental Drive, Suite 401,
Newark, Delaware - 19713,
United States

T: +1-845-579-5705

Americas

Future Market Insights, Inc.

616 Corporate Way, Suite 2-9018,
Valley Cottage, NY 10989, United States

T: +1-347-918-3531

MEA

Future Market Insights

1602-6 Jumeirah Bay X2 Tower, Plot No: JLT-PH2-X2A,
Jumeirah Lakes Towers, Dubai,
United Arab Emirates

Europe

Future Market Insights

3rd Floor, 207 Regent Street,
W1B 3HH London
United Kingdom

T: + 44 (0) 20 8123 9659
D: +44 (0) 20 3287 4268

Asia Pacific

Future Market Insights

IndiaLand Global Tech Park, Unit UG-1, Behind Grand HighStreet, Phase 1, Hinjawadi, MH, Pune – 411057, India

Patient Registry Software Market Outlook (2022 to 2032)

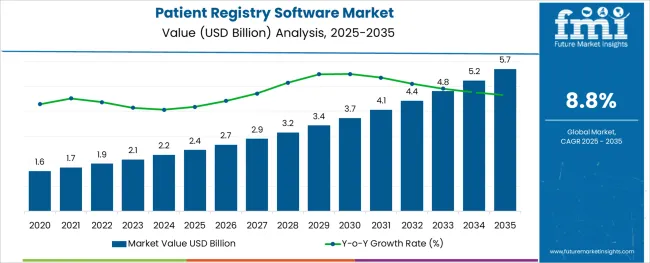
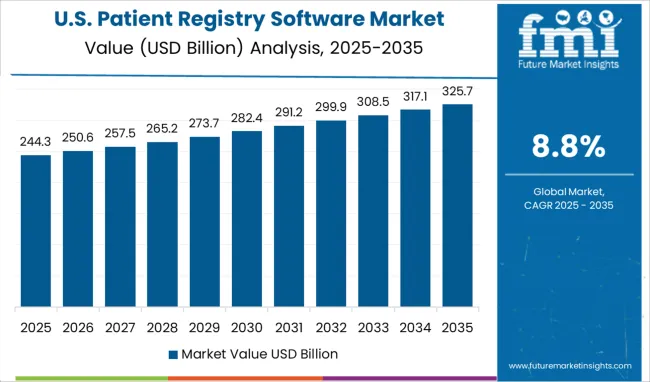
[307 Pages Report] Flourishing at a CAGR of 8.8% from 2022 to 2032, the global patient registry software market is expected to procure US$ 4.4 Billion by 2032, against US$ 1.9 Billion in 2022. Increased revenue can be attributed to the increasing prevalence of chronic diseases and the rising geriatric population.

Growing incidences of chronic diseases across the globe are expected to drive the patient registry software market in the forecast period. With the growing cases of cancer, diabetes, and cardiovascular diseases, among others, there has been a significant rise in demand for EHRs, which will benefit the market in the forecast period.

Increasing application of electronic health records and growing usage of stored data for post-marketing surveillance and implementation of favorable government initiatives are expected to play a significant role in strengthening the market in the forecast period. Also, with rising pressure to lessen costs and increasing access to social media and mobile technologies, the healthcare sector is experiencing a significant transformation, which is expected to benefit the patient registry software market in the forecast period.

Attributes Details
Patient Registry Software Market CAGR (2022 to 2032) 8.8%
Patient Registry Software Market Size (2022) US$ 1.9 Billion
Patient Registry Software Market (2032) US$ 4.4 Billion

Increasing investment in clinical trials by various biotechnological and pharmaceutical enterprises is anticipated to offer significant opportunities to the market. In June 2019, CloudPWR announced a strategic partnership with Accela. The initiative will assist in tapping the volume-based consumption of medical cannabis to reduce misuse.

Don't pay for what you don't need

Customize your report by selecting specific countries or regions and save 30%!

What are the Major Factors Fuelling the Global Patient Registry Software Market?

Increasing adoption of EHRs in the healthcare sector is expected to be the key factor benefitting the global patient registry software market during the forecast period. Growing initiatives by the various government to implement strategies to lessen regulatory and administrative responsibilities on healthcare providers are expected to play a salient role in driving demand for EHRs in the healthcare sector thereby, benefitting the patient registry software market.

For instance, on December 13, 2016, the USA introduced Cures Act, which aims to enhance medical product development and offer innovative and advanced medical technology. Such initiatives are expected to drive the demand for EHRs, thus, benefitting the market during the assessment period.

With the incorporation of AI into electronic health record solutions, the market is expected to experience a notable expansion. Various players are aiming to incorporate the technology in the EHRs through voice recognition capabilities.

Patient Registry Software Market

For example, a physician can access a voice-based HER solution to analyze a patient’s last recorded medical reports. In October 2019, various scripts along with Northwell Health inked an agreement to produce the next-generation electronic health record. The initiative is expected to support massive revenue generation, thereby, fuelling the market expansion in the coming time.

Over the last few years, there has been a rise in demand for EHRs in various countries. This can be attributed to the growing demand for robust health information technology, which is important to achieve fine-quality services at affordable prices.

The increasing application of EHRs in the healthcare sector helps in result management, analyze health information and data, and decision support, which is anticipated to strengthen the market in the forecast period.

What are the Emerging Opportunities in the Patient Registry Software Market?

The emergence of cloud-based EHR software is expected to offer significant market opportunities during the assessment period. Such solutions offer more advanced and developed approaches. Moreover, the installation expenses for the system are cheaper than the client server-based systems. Also, such methods eliminate the requirement for in-house maintenance, which is expected to offer significant opportunities to the patient registry software market.

Other benefits offered, such as; low-cost maintenance, low licensing, cheaper start-up cost, and wider accessibility are other salient factors that can offer various avenues of opportunities to the market in the forecast period. Moreover, these solutions do not demand any major capital investment for hardware and offer swift data transfer between enterprises. Owing to such benefits, the demand for cloud-based software is expected to witness considerable opportunities in the coming time.

In April 2020, Allscripts launched a COVID-19 package of solutions for healthcare institutions. The Allscripts Hospital Management Package offers a series of COVID-19 workflows that recognizes disease-specific demands within SunriseTM EHR, Allscripts Care Director, and Paragon EHR.

Sudip Saha
Sudip Saha

Principal Consultant

Talk to Analyst

Find your sweet spots for generating winning opportunities in this market.

What are the Factors the Global Patient Registry Software Uptake?

Concerns associated with data privacy and security are expected to impact the market negatively in the forecast period. The breach of data can result in the exposure of confidential details of a large number of patients. Moreover, there have been various cases of data breaches.

About one-third of data breaches lead to medical identity theft, principally because of a lack of internal control over patient information, conventional policies, and a dearth of personnel expertise. As per the Identity Theft Resource Center, the USA recorded about 1.473 breaches in 2019, a rise of 17% against 2018.

There has been a reluctance in adopting modern solutions, and enterprises yet rely on paper paper-based solutions. Small and rural areas continue to use conventional paper-based registry methods. Also, several hospitals do not encourage the application of such approaches owing to the lack of expertise and various costs included in the implementation of such software.

In April 2022, the GHT Coeur Grand Est. Hospitals, a Northeast France-based healthcare institute, had to disconnect all outgoing and incoming Internet connections after they suffered from a cyberattack that resulted in the theft of administrative and patient data.

Comparative View of Adjacent Patient Registry Software Markets

Global Patient Registry Software Market:

Attributes Global Patient Registry Software Market
CAGR (2022 to 2032) 8.8%
Market Value (2032) US$ 4.4 Billion
Growth Factor Growing initiatives by the various government to implement strategies to lessen regulatory and administrative responsibilities on healthcare providers
Opportunity The emergence of cloud-based EHR software is expected to offer significant market opportunities during the assessment period

Medical Software Market:

Attributes Medical Software Market
CAGR (2022 to 2032) 7%
Market Value (2032) US$ 7.05 Billion
Growth Factor Increasing the application of electronic health records to distribute, store, and manage patient health information through medical images is expected to drive the demand for efficient medical software in the assessment period.
Opportunity Integration of machine learning and AI in the healthcare sector is anticipated to various avenues of opportunities to the market in the assessment period.

Global EHR Market:

Attributes Global EHR Market
CAGR (2022 to 2032) 5%
Market Value (2032) US$ 45.6 Billion
Growth Factor The growing application of electronic health records in the administrative sector and healthcare financing among others are expected to drive global sales for EHR in the assessment period.
Opportunity The incorporation of AI and voice recognition with EHR is expected to offer significant opportunities for expansion in the forecast period

Get the data you need at a Fraction of the cost

Personalize your report by choosing insights you need
and save 40%!

Segmental Overview of the Patient Registry Software Market

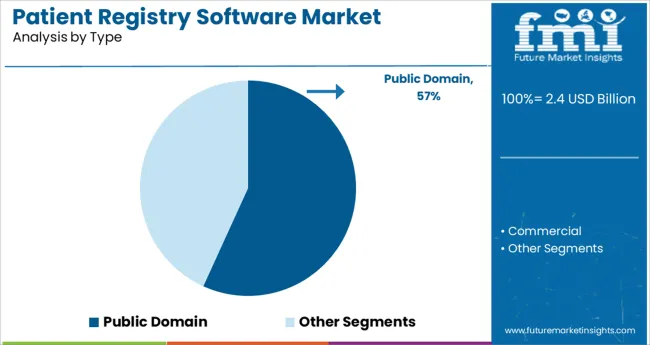
Based on type, the global patient registry software market can be segmented into public domain registry software and commercial registry software. As per the analysis, the commercial registry software is expected to lead the market in the assessment period. The segment is projected to expand at a CAGR of 9.3% from 2022 to 2032.

The growth of the segment can be attributed to the rapid adoption of electronic health records and various other HCIT solutions in healthcare institutions. Various regulatory bodies are encouraging the adoption of HER solutions to enhance the delivery of healthcare services, which is anticipated to strengthen the segment in the forecast period.

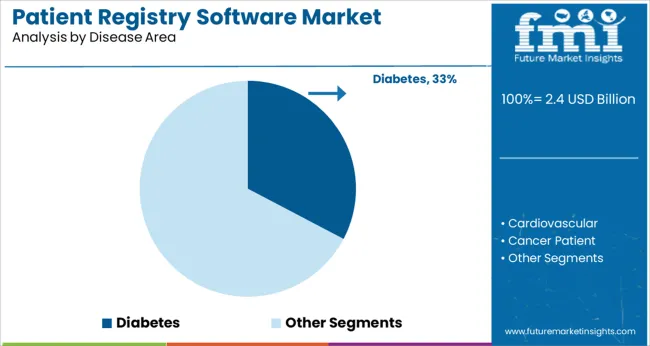
Based on the disease area, the diabetes registry segment is anticipated to dominate the market in the forecast period. The segment is projected to flourish at a CAGR of 9.3% from 2022 to 2032. The growth of the segment can be attributed to the rising number of diabetic patients across the globe. As per the World Health Organization, about 422 million across the globe suffer from diabetes.
What is the Regional Analysis of the Global Patient Registry Software Market?

How will North America emerge as an Opportunistic Market?

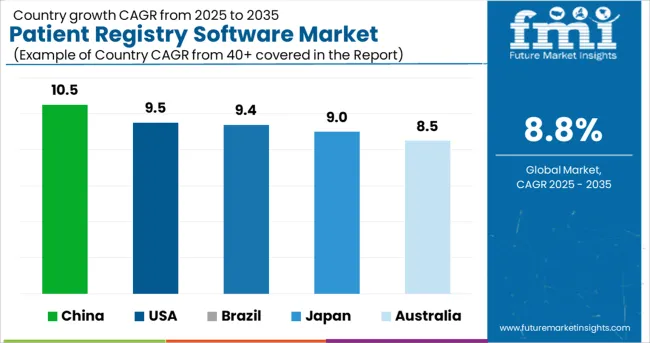
According to the latest reports by FMI, the North American patient registry software market is expected to dominate the market during the forecast period. The analysis reveals that the region is projected to be dominated by the USA, with a CAGR of 9.5% from 2022 to 2032. The USA is likely to garner US$ 1.5 Billion by 2032.

The growth of the region can be attributed to the expanding target population along with the growing prevalence of diseases. Moreover, favorable initiatives taken by the government are likely to propel the market in the region. Players in the region are taking various efforts to make patient registry software clinical research-friendly and user-interactive software. In August 2019, IQVIA announced a web-based solution for the enlistment of clinical trial information.

Will APAC be an Important Investment Destination for Patient Registry Software Providers?

APAC is anticipated to be the fastest-growing region during the forecast period. As per the analysis, the region is projected to expand at a significant CAGR from 2022 to 2032. China is expected to lead the market, flourishing at a growth rate of 10.5% during the forecast period. Japan is expected to expand at the second-highest CAGR of 9% during the said period of assessment.

On the other hand, India and South Korea have been recognized with some lucrative opportunities. The growing need to eliminate medical errors and increased diagnostics errors are expected to play a significant role in driving the market in the region.

Also, growing awareness about the benefits of EHRs, development in healthcare systems, and rising medical tourism in APAC are other important factors propelling the market in the assessment period. In addition, the implementation of favorable initiatives by the government is expected to augment the market size in the region. In May 2018, the government of South Korea made an investment of US$33.4 Million to develop AI systems that would analyze a patient’s medical registry for better diagnostics. Similarly, in 2019, Fujifilm established FUJIFILM VET Systems in Japan to enhance the adoption of the cancer registry software.
Country Projected CAGR
USA 9.5%
Brazil 9.4%
China 10.5%
Japan 9%
Australia 8.5%

How Competitive is the Global Patient Registry Software Landscape?

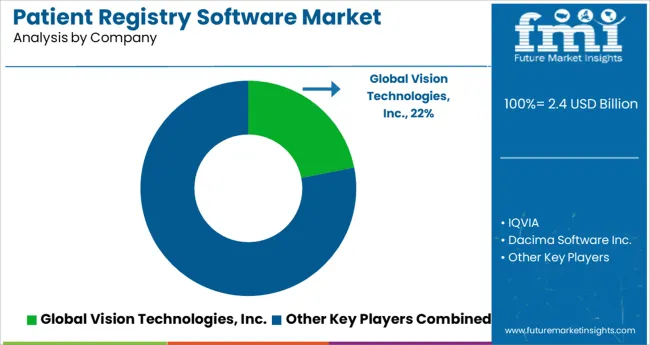
Key players in the global patient registry software market include Dacima Software Inc., Evado eClinical Solutions, IQVIA, Global Vision Technologies Inc., and Invitae. Recent Developments among key players are:

  • In March 2021, ESO Solutions announced a strategic partnership with Virginia EMS Systems (US) to provide an EMS data repository and trauma registry across the state.
  • In April 2021, IQVIA Holdings accomplished the remaining 40% of Q2 solutions from diagnostic information services provider Quest Diagnostics.
  • In December 2020, ImageTrend, Inc. (US) disclosed the latest National Trauma Data Bank (NTDB) Data Dictionary that would be available in the Patient Registry from January 1, 2021.
  • In June 2020, ArborMetrix Inc. (US) entered into a strategic partnership with The Society of Interventional Radiology (SIR). The initiative aims to offer the IR Quality Registry to enhance patient care by deploying analytics.

Key Segments Covered in the Patient Registry Software Market Report

By Type:

  • Public Domain
  • Commercial

By Disease Area:

  • Diabetes
  • Cardiovascular
  • Cancer Patient
  • Rare Disease/Orphan Disease
  • Other Chronic Disease

By End User:

  • Governments
  • Commercial Use

By Region:

  • North America
  • Europe Patient
  • Asia Pacific
  • MEA Patient
  • Latin America

Frequently Asked Questions

What is the projected market size of the global patient registry software market in 2022?

The global patient registry software market is anticipated to secure US$ 1.9 Billion in 2022

What is the expected CAGR of the global patient registry software market from 2022 to 2032?

The expected CAGR of the market is 8.8% from 2022 to 2032

What is the expected market size of the USA by 2032?

The USA is projected at US$ 1.5 Billion by 2032 with regard to the patient registry software market.

What is the projected CAGR of the Chinese market by 2032?

China is expected to expand at a CAGR of 10.5% from 2022 to 2032

What is the contribution of the commercial registry software segment in strengthening the market?

The commercial registry software segment is projected to expand at a CAGR of 8.9% from 2022 to 2032

What is the expected CAGR of Japan by 2032?

Japan is anticipated to expand at a CAGR of 9% during the forecast period by 2032.

Table of Content

1. Preface | Patient Registry Software Market

    1.1. Report Description

    1.2. Report Scope

    1.3. Research Methodology

        1.3.1. Primary Research

2. Executive Summary

    2.1. Market Snapshot: Global Market

    2.2. Global Market Revenue, 2015 to 2032 (US$ Million) and Y-o-Y Growth (%)

3. Global Market Analysis, 2015 to 2032 (US$ Million)

    3.1. Market Dynamics

        3.1.1. Drivers

        3.1.2. Restraints

        3.1.3. Opportunities

    3.2. Key Trends Analysis

    3.3. Global Market Analysis, By Type, 2015 to 2032 (US$ Million)

        3.3.1. Public Domain Registry Software

        3.3.2. Commercial Registry Software

    3.4. Global Market Analysis, By Disease Areas, 2015 to 2032 (US$ Million)

        3.4.1. Diabetes Registry

        3.4.2. Cardiovascular Registry

        3.4.3. Cancer Registry

        3.4.4. Rare Disease/Orphan Disease Registry

        3.4.5. Other Chronic Disease Registry

    3.5. Global Market Analysis, By End-User, 2015 to 2032 (US$ Million)

        3.5.1. Government

        3.5.2. Commercial

    3.6. Competitive Landscape

        3.6.1. Market Positioning of Key Players, 2014

        3.6.2. Competitive Strategies Adopted by Leading Players

4. North America Market Analysis, 2015 to 2032 (US$ Million)

    4.1. Key Trends Analysis

    4.2. North America Market Analysis, By Type, 2015 to 2032 (US$ Million)

        4.2.1. Public Domain Registry Software

        4.2.2. Commercial Registry Software

    4.3. North America Market Analysis, By Disease Areas, 2015 to 2032 (US$ Million)

        4.3.1. Diabetes Registry

        4.3.2. Cardiovascular Registry

        4.3.3. Cancer Registry

        4.3.4. Rare Disease/Orphan Disease Registry

        4.3.5. Other Chronic Disease Registry

    4.4. North America Market Analysis, By End-User, 2015 to 2032 (US$ Million)

        4.4.1. Government

        4.4.2. Commercial

    4.5. North America Market Analysis, By Region, 2015 to 2032 (US$ Million)

        4.5.1. United States of America

        4.5.2. Rest of North America

5. Europe Market Analysis, 2015 to 2032 (US$ Million)

    5.1. Key Trends Analysis

    5.2. Europe Market Analysis, By Type, 2015 to 2032 (US$ Million)

        5.2.1. Public Domain Registry Software

        5.2.2. Commercial Registry Software

    5.3. Europe Market Analysis, By Disease Areas, 2015 to 2032 (US$ Million)

        5.3.1. Diabetes Registry

        5.3.2. Cardiovascular Registry

        5.3.3. Cancer Registry

        5.3.4. Rare Disease/Orphan Disease Registry

        5.3.5. Other Chronic Disease Registry

    5.4. Europe Market Analysis, By End-User, 2015 to 2032 (US$ Million)

        5.4.1. Government

        5.4.2. Commercial

    5.5. Europe Market Analysis, By Region, 2015 to 2032 (US$ Million)

        5.5.1. EU7

        5.5.2. CIS

        5.5.3. Rest of Europe

6. Asia Pacific Market Analysis, 2015 to 2032 (US$ Million)

    6.1. Key Trends Analysis

    6.2. Asia Pacific Market Analysis, By Type, 2015 to 2032 (US$ Million)

        6.2.1. Public Domain Registry Software

        6.2.2. Commercial Registry Software

    6.3. Asia Pacific Market Analysis, By Disease Areas, 2015 to 2032 (US$ Million)

        6.3.1. Diabetes Registry

        6.3.2. Cardiovascular Registry

        6.3.3. Cancer Registry

        6.3.4. Rare Disease/Orphan Disease Registry

        6.3.5. Other Chronic Disease Registry

    6.4. Asia Pacific Market Analysis, By End-User, 2015 to 2032 (US$ Million)

        6.4.1. Government

        6.4.2. Commercial

    6.5. Asia Pacific Market Analysis, By Region, 2015 to 2032 (US$ Million)

        6.5.1. Japan

        6.5.2. China

        6.5.3. South Asia

        6.5.4. Australasia

        6.5.5. Rest of APAC

7. Middle East & Africa (MEA) Market Analysis, 2015 to 2032 (US$ Million)

    7.1. Key Trends Analysis

    7.2. MEA Market Analysis, By Type, 2015 to 2032 (US$ Million)

        7.2.1. Public Domain Registry Software

        7.2.2. Commercial Registry Software

    7.3. MEA Market Analysis, By Disease Areas, 2015 to 2032 (US$ Million)

        7.3.1. Diabetes Registry

        7.3.2. Cardiovascular Registry

        7.3.3. Cancer Registry

        7.3.4. Rare Disease/Orphan Disease Registry

        7.3.5. Other Chronic Disease Registry

    7.4. MEA Market Analysis, By End-User, 2015 to 2032 (US$ Million)

        7.4.1. Government

        7.4.2. Commercial

    7.5. MEA Market Analysis, By Region, 2015 to 2032 (US$ Million)

        7.5.1. GCC Countries

        7.5.2. North Africa

        7.5.3. South Africa

        7.5.4. Rest of MEA

8. Latin America Market Analysis, 2015 to 2032 (US$ Million)

    8.1. Key Trends Analysis

    8.2. Latin America Market Analysis, By Type, 2015 to 2032 (US$ Million)

        8.2.1. Public Domain Registry Software

        8.2.2. Commercial Registry Software

    8.3. Latin America Market Analysis, By Disease Areas, 2015 to 2032 (US$ Million)

        8.3.1. Diabetes Registry

        8.3.2. Cardiovascular Registry

        8.3.3. Cancer Registry

        8.3.4. Rare Disease/Orphan Disease Registry

        8.3.5. Other Chronic Disease Registry

    8.4. Latin America Market Analysis, By End-User, 2015 to 2032 (US$ Million)

        8.4.1. Government

        8.4.2. Commercial

    8.5. Latin America Market Analysis, By Region, 2015 to 2032 (US$ Million)

        8.5.1. Brazil

        8.5.2. Rest of Latin America

9. Company Profiles

    9.1. Global Vision Technologies, Inc.

    9.2. IQVIA

    9.3. Dacima Software Inc.

    9.4. Invitae

    9.5. Evado eClinical Solutions

Don't pay for what you don't need

Customize your report by selecting specific countries or regions and save 30%!

List of Tables

Table 1: Global Market Value (US$ Million), By Type, 2015 to 2032

Table 2: Global Market Value (US$ Million), By Type, 2022 to 2032

Table 3: Global Market Value (US$ Million), By Disease Area, 2015 to 2032

Table 4: Global Market Value (US$ Million), By Disease Area, 2022 to 2032

Table 5: Global Market Value (US$ Million), By End User, 2015 to 2032

Table 6: Global Market Value (US$ Million), By End User, 2022 to 2032

Table 7: Global Market, By Region, 2015 to 2032

Table 8: Global Market, By Region, 2022 to 2032

Table 9: North America Market Value (US$ Million), By Type, 2015 to 2032

Table 10: North America Market Value (US$ Million), By Type, 2022 to 2032

Table 11: North America Market Value (US$ Million), By Disease Area, 2015 to 2032

Table 12: North America Market Value (US$ Million), By Disease Area, 2022 to 2032

Table 13: North America Market Value (US$ Million), By End User, 2015 to 2032

Table 14: North America Market Value (US$ Million), By End User, 2022 to 2032

Table 15: North America Market, By Country, 2015 to 2032

Table 16: North America Market, By Country, 2022 to 2032

Table 17: Latin America Market Value (US$ Million), By Type, 2015 to 2032

Table 18: Latin America Market Value (US$ Million), By Type, 2022 to 2032

Table 19: Latin America Market Value (US$ Million), By Disease Area, 2015 to 2032

Table 20: Latin America Market Value (US$ Million), By Disease Area, 2022 to 2032

Table 21: Latin America Market Value (US$ Million), By End User, 2015 to 2032

Table 22: Latin America Market Value (US$ Million), By End User, 2022 to 2032

Table 23: Latin America Market, By Country, 2015 to 2032

Table 24: Latin America Market, By Country, 2022 to 2032

Table 25: Europe Market Value (US$ Million), By Type, 2015 to 2032

Table 26: Europe Market Value (US$ Million), By Type, 2022 to 2032

Table 27: Europe Market Value (US$ Million), By Disease Area, 2015 to 2032

Table 28: Europe Market Value (US$ Million), By Disease Area, 2022 to 2032

Table 29: Europe Market Value (US$ Million), By End User, 2015 to 2032

Table 30: Europe Market Value (US$ Million), By End User, 2022 to 2032

Table 31: Europe Market, By Country, 2015 to 2032

Table 32: Europe Market, By Country, 2022 to 2032

Table 33: Asia Pacific Market Value (US$ Million), By Type, 2015 to 2032

Table 34: Asia Pacific Market Value (US$ Million), By Type, 2022 to 2032

Table 35: Asia Pacific Market Value (US$ Million), By Disease Area, 2015 to 2032

Table 36: Asia Pacific Market Value (US$ Million), By Disease Area, 2022 to 2032

Table 37: Asia Pacific Market Value (US$ Million), By End User, 2015 to 2032

Table 38: Asia Pacific Market Value (US$ Million), By End User, 2022 to 2032

Table 39: Asia Pacific Market, By Country, 2015 to 2032

Table 40: Asia Pacific Market, By Country, 2022 to 2032

Table 41: MEA Market Value (US$ Million), By Type, 2015 to 2032

Table 42: MEA Market Value (US$ Million), By Type, 2022 to 2032

Table 43: MEA Market Value (US$ Million), By Disease Area, 2015 to 2032

Table 44: MEA Market Value (US$ Million), By Disease Area, 2022 to 2032

Table 45: MEA Market Value (US$ Million), By End User, 2015 to 2032

Table 46: MEA Market Value (US$ Million), By End User, 2022 to 2032

Table 47: MEA Market, By Country, 2015 to 2032

Table 48: MEA Market, By Country, 2022 to 2032

Table 49: Global Market Incremental $ Opportunity, By Type, 2015 to 2032

Table 50: Global Market Incremental $ Opportunity, By Disease Area, 2022 to 2032

Table 51: Global Market Incremental $ Opportunity, By End User, 2015 to 2032

Table 52: Global Market Incremental $ Opportunity, By Region, 2022 to 2032

Table 53: North America Market Incremental $ Opportunity, By Type, 2015 to 2032

Table 54: North America Market Incremental $ Opportunity, By Disease Area, 2022 to 2032

Table 55: North America Market Incremental $ Opportunity, By End User, 2015 to 2032

Table 56: North America Market Incremental $ Opportunity, By Country, 2022 to 2032

Table 57: Latin America Market Incremental $ Opportunity, By Type, 2015 to 2032

Table 58: Latin America Market Incremental $ Opportunity, By Disease Area, 2022 to 2032

Table 59: Latin America Market Incremental $ Opportunity, By End User, 2015 to 2032

Table 60: Latin America Market Incremental $ Opportunity, By Country, 2022 to 2032

Table 61: Europe Market Incremental $ Opportunity, By Type, 2015 to 2032

Table 62: Europe Market Incremental $ Opportunity, By Disease Area, 2022 to 2032

Table 63: Europe Market Incremental $ Opportunity, By End User, 2015 to 2032

Table 64: Europe Market Incremental $ Opportunity, By Country, 2015 to 2032

Table 65: Asia Pacific Market Incremental $ Opportunity, By Type, 2015 to 2032

Table 66: Asia Pacific Market Incremental $ Opportunity, By Disease Area, 2022 to 2032

Table 67: Asia Pacific Market Incremental $ Opportunity, By End User, 2015 to 2032

Table 68: Asia Pacific Market Incremental $ Opportunity, By Country, 2022 to 2032

Table 69: MEA Market Incremental $ Opportunity, By Type, 2015 to 2032

Table 70: MEA Market Incremental $ Opportunity, By Disease Area, 2022 to 2032

Table 71: MEA Market Incremental $ Opportunity, By End User, 2015 to 2032

Table 72: MEA Market Incremental $ Opportunity, By Country, 2015 to 2032
Sudip Saha
Sudip Saha

Principal Consultant

Talk to Analyst

Find your sweet spots for generating winning opportunities in this market.

List of Charts

Figure 1: Global Market Value (US$ Million) and Year-on-Year Growth, 2015 to 2032

Figure 2: Global Market Absolute $ Historical Gain (2015 to 2032) and Opportunity (2015 to 2032), US$ Million

Figure 3: Global Market Share, by Type, 2021 & 2032

Figure 4: Global Market Y-o-Y Growth Projections, Type - 2015 to 2032

Figure 5: Global Market Attractiveness Index, Type - 2015 to 2032

Figure 6: Global Market Share, By Disease Area, 2021 & 2032

Figure 7: Global Market Y-o-Y Growth Projections, By Disease Area- 2015 to 2032

Figure 8: Global Market Attractiveness Index, By Disease Area- 2015 to 2032

Figure 9: Global Market Share, By End User, 2021 & 2032

Figure 10: Global Market Y-o-Y Growth Projections, By End User - 2015 to 2032

Figure 11: Global Market Attractiveness Index, By End User - 2015 to 2032

Figure 12: Global Market Share, By Region, 2021 & 2032

Figure 13: Global Market Y-o-Y Growth Projections, By Region - 2015 to 2032

Figure 14: Global Market Attractiveness Index, By Region - 2015 to 2032

Figure 15: North America Market Value (US$ Million) and Year-on-Year Growth, 2015 to 2032

Figure 16: North America Market Absolute $ Opportunity Historical (2015 to 2032) and Forecast Period (2015 to 2032), US$ Million

Figure 17: North America Market Share, Type, 2021 & 2032

Figure 18: North America Market Y-o-Y Growth Projections, Type - 2015 to 2032

Figure 19: North America Market Attractiveness Index, Type - 2015 to 2032

Figure 20: North America Market Share, By Disease Area, 2021 & 2032

Figure 21: North America Market Y-o-Y Growth Projections, By Disease Area- 2015 to 2032

Figure 22: North America Market Attractiveness Index, By Disease Area- 2015 to 2032

Figure 23: North America Market Share, By End User, 2021 & 2032

Figure 24: North America Market Y-o-Y Growth Projections, By End User - 2015 to 2032

Figure 25: North America Market Attractiveness Index, By End User - 2015 to 2032

Figure 26: North America Market Share, By Country, 2021 & 2032

Figure 27: North America Market Y-o-Y Growth Projections, By Country - 2015 to 2032

Figure 28: North America Market Attractiveness Index, By Country - 2015 to 2032

Figure 29: Latin America Market Value (US$ Million) and Year-on-Year Growth, 2015 to 2032

Figure 30: Latin America Market Absolute $ Opportunity Historical (2015 to 2032) and Forecast Period (2015 to 2032), US$ Million

Figure 31: Latin America Market Share, Type, 2021 & 2032

Figure 32: Latin America Market Y-o-Y Growth Projections, Type - 2015 to 2032

Figure 33: Latin America Market Attractiveness Index, Type - 2015 to 2032

Figure 34: Latin America Market Share, By Disease Area, 2021 & 2032

Figure 35: Latin America Market Y-o-Y Growth Projections, By Disease Area- 2015 to 2032

Figure 36: Latin America Market Attractiveness Index, By Disease Area- 2015 to 2032

Figure 37: Latin America Market Share, By End User, 2021 & 2032

Figure 38: Latin America Market Y-o-Y Growth Projections, By End User - 2015 to 2032

Figure 39: Latin America Market Attractiveness Index, By End User - 2015 to 2032

Figure 40: Latin America Market Share, By Country, 2021 & 2032

Figure 41: Latin America Market Y-o-Y Growth Projections, By Country - 2015 to 2032

Figure 42: Latin America Market Attractiveness Index, By Country - 2015 to 2032

Figure 43: Europe Market Value (US$ Million) and Year-on-Year Growth, 2015 to 2032

Figure 44: Europe Market Absolute $ Opportunity Historical (2015 to 2032) and Forecast Period (2015 to 2032), US$ Million

Figure 45: Europe Market Share, Type, 2021 & 2032

Figure 46: Europe Market Y-o-Y Growth Projections, Type - 2015 to 2032

Figure 47: Europe Market Attractiveness Index, Type - 2015 to 2032

Figure 48: Europe Market Share, By Disease Area, 2021 & 2032

Figure 49: Europe Market Y-o-Y Growth Projections, By Disease Area- 2015 to 2032

Figure 50: Europe Market Attractiveness Index, By Disease Area- 2015 to 2032

Figure 51: Europe Market Share, By End User, 2021 & 2032

Figure 52: Europe Market Y-o-Y Growth Projections, By End User - 2015 to 2032

Figure 53: Europe Market Attractiveness Index, By End User - 2015 to 2032

Figure 54: Europe Market Share, By Country, 2021 & 2032

Figure 55: Europe Market Y-o-Y Growth Projections, By Country - 2015 to 2032

Figure 56: Europe Market Attractiveness Index, By Country - 2015 to 2032

Figure 57: MEA Market Value (US$ Million) and Year-on-Year Growth, 2015 to 2032

Figure 58: MEA Market Absolute $ Opportunity Historical (2015 to 2032) and Forecast Period (2015 to 2032), US$ Million

Figure 59: MEA Market Share, Type, 2021 & 2032

Figure 60: MEA Market Y-o-Y Growth Projections, Type - 2015 to 2032

Figure 61: MEA Market Attractiveness Index, Type - 2015 to 2032

Figure 62: MEA Market Share, By Disease Area, 2021 & 2032

Figure 63: MEA Market Y-o-Y Growth Projections, By Disease Area- 2015 to 2032

Figure 64: MEA Market Attractiveness Index, By Disease Area- 2015 to 2032

Figure 65: MEA Market Share, By End User, 2021 & 2032

Figure 66: MEA Market Y-o-Y Growth Projections, By End User - 2015 to 2032

Figure 67: MEA Market Attractiveness Index, By End User - 2015 to 2032

Figure 68: MEA Market Share, By Country, 2021 & 2032

Figure 69: MEA Market Y-o-Y Growth Projections, By Country - 2015 to 2032

Figure 70: MEA Market Attractiveness Index, By Country - 2015 to 2032

Figure 71: Asia Pacific Market Value (US$ Million) and Year-on-Year Growth, 2015 to 2032

Figure 72: Asia Pacific Market Absolute $ Opportunity Historical (2015 to 2032) and Forecast Period (2015 to 2032), US$ Million

Figure 73: Asia Pacific Market Share, Type, 2021 & 2032

Figure 74: Asia Pacific Market Y-o-Y Growth Projections, Type - 2015 to 2032

Figure 75: Asia Pacific Market Attractiveness Index, Type - 2015 to 2032

Figure 76: Asia Pacific Market Share, By Disease Area, 2021 & 2032

Figure 77: Asia Pacific Market Y-o-Y Growth Projections, By Disease Area- 2015 to 2032

Figure 78: Asia Pacific Market Attractiveness Index, By Disease Area- 2015 to 2032

Figure 79: Asia Pacific Market Share, By End User, 2021 & 2032

Figure 80: Asia Pacific Market Y-o-Y Growth Projections, By End User - 2015 to 2032

Figure 81: Asia Pacific Market Attractiveness Index, By End User - 2015 to 2032

Figure 82: Asia Pacific Market Share, By Country, 2021 & 2032

Figure 83: Asia Pacific Market Y-o-Y Growth Projections, By Country - 2015 to 2032

Figure 84: Asia Pacific Market Attractiveness Index, By Country - 2015 to 2032

Figure 67: USA Market Value (US$ Million) and Forecast, 2015 to 2032

Figure 68: USA Market Share, Delivery Mode, 2021 & 2032

Figure 69: USA Market Share, By End User, 2021 & 2032

Figure 70: Rest of North America Market Value (US$ Million) and Forecast, 2015 to 2032

Figure 71: Rest of North America Market Share, Delivery Mode, 2021 & 2032

Figure 72: Rest of North America Market Share, By End User, 2021 & 2032

Figure 73: EU7 Market Value (US$ Million) and Forecast, 2015 to 2032

Figure 74: EU7  Patient Engagement Solutions Market Share, Delivery Mode, 2021 & 2032

Figure 75: EU7 Market Share, By End User, 2021 & 2032

Figure 76: CIS Market Value (US$ Million) and Forecast, 2015 to 2032

Figure 77: CIS Market Share, Delivery Mode, 2021 & 2032

Figure 78: CIS Market Share, By End User, 2021 & 2032

Figure 79: Rest of Europe Market Value (US$ Million) and Forecast, 2015 to 2032

Figure 80: Rest of Europe Market Share, Delivery Mode, 2021 & 2032

Figure 81: Rest of Europe Market Share, By End User, 2021 & 2032

Figure 82: GCC Countries Market Value (US$ Million) and Forecast, 2015 to 2032

Figure 83: GCC Countries Market Share, Delivery Mode, 2021 & 2032

Figure 84: GCC Countries Market Share, By End User, 2021 & 2032

Figure 85: North Africa Market Value (US$ Million) and Forecast, 2015 to 2032

Figure 86: North Africa  Patient Engagement Solutions Market Share, Delivery Mode, 2021 & 2032

Figure 87: North Africa  Patient Engagement Solutions Market Share, By End User, 2021 & 2032

Figure 88: South Africa Market Value (US$ Million) and Forecast, 2015 to 2032

Figure 89: South Africa Market Share, Delivery Mode, 2021 & 2032

Figure 90: South Africa Market Share, By End User, 2021 & 2032

Figure 91: Rest of MEA Market Value (US$ Million) and Forecast, 2015 to 2032

Figure 92: Rest of MEA Market Share, Delivery Mode, 2021 & 2032

Figure 93: Rest of MEA Market Share, By End User, 2021 & 2032

Figure 94: Brazil Market Value (US$ Million) and Forecast, 2015 to 2032

Figure 95: Brazil Market Share, Delivery Mode, 2021 & 2032

Figure 96: Brazil Market Share, By End User, 2021 & 2032

Figure 97: Rest of Latin America  Patient Engagement Solutions Market Value (US$ Million) and Forecast, 2015 to 2032

Figure 98: Rest of Latin America Market Share, Delivery Mode, 2021 & 2032

Figure 99: Rest of Latin America Market Share, By End User, 2021 & 2032

Figure 100: China Market Value (US$ Million) and Forecast, 2015 to 2032

Figure 101: China Market Share, Delivery Mode, 2021 & 2032

Figure 102: China Market Share, By End User, 2021 & 2032

Figure 103: Japan Market Value (US$ Million) and Forecast, 2015 to 2032

Figure 104: Japan Market Share, Delivery Mode, 2021 & 2032

Figure 105: Japan Market Share, By End User, 2021 & 2032

Figure 106: South Asia Market Value (US$ Million) and Forecast, 2015 to 2032

Figure 107: South Asia Market Share, Delivery Mode, 2021 & 2032

Figure 108: South Asia Market Share, By End User, 2021 & 2032

Figure 109: Australasia Market Value (US$ Million) and Forecast, 2015 to 2032

Figure 110: Australasia Market Share, Delivery Mode, 2021 & 2032

Figure 111: Australasia Market Share, By End User, 2021 & 2032

Figure 112: Rest of APAC Market Value (US$ Million) and Forecast, 2015 to 2032

Figure 113: Rest of APAC Market Share, Delivery Mode, 2021 & 2032

Figure 114: Rest of APAC Market Share, By End User, 2021 & 2032

Recommendations

Technology

Metrology Software Market

Published : June 2023

Technology

Customer Revenue Optimization (CRO) Software Market

Published : June 2023

Technology

Incidence Management Software Market

Published : December 2022

Technology

MEA Enterprise Software Market

Published : September 2022

Explore Technology Insights

View Reports

Patient Registry Software Market