Reports

- Global Locations -

Headquarters

Future Market Insights, Inc.

Christiana Corporate, 200
Continental Drive, Suite 401,
Newark, Delaware - 19713,
United States

T: +1-845-579-5705

Americas

Future Market Insights, Inc.

616 Corporate Way, Suite 2-9018,
Valley Cottage, NY 10989, United States

T: +1-347-918-3531

MEA

Future Market Insights

1602-6 Jumeirah Bay X2 Tower, Plot No: JLT-PH2-X2A,
Jumeirah Lakes Towers, Dubai,
United Arab Emirates

Europe

Future Market Insights

3rd Floor, 207 Regent Street,
W1B 3HH London
United Kingdom

T: + 44 (0) 20 8123 9659
D: +44 (0) 20 3287 4268

Asia Pacific

Future Market Insights

IndiaLand Global Tech Park, Unit UG-1, Behind Grand HighStreet, Phase 1, Hinjawadi, MH, Pune – 411057, India

Patient Engagement Platforms Market Outlook (2022 to 2032)

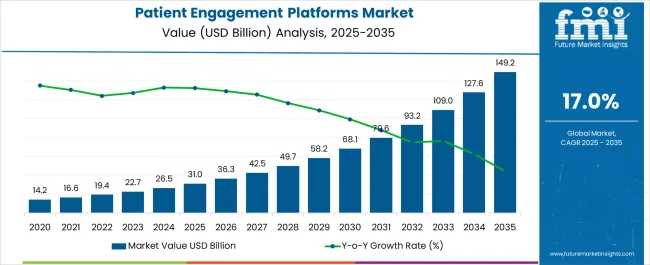
The global patient engagement platforms market is anticipated to grow at a 17% CAGR during the forecast period, reaching nearly US$ 93.4 Billion by 2032, up from US$ 16.6 Billion in 2021.

Below-mentioned factors are expected to play a pivotal role in furthering market growth:

  • Breakthroughs of online services in all aspects of life, including investments in evolving patient engagement mobile health apps to demonstrate a real-time connection with patients.
  • A greater percentage of the senior population, combined with a rise in the prevalence of contagious diseases that consider visits to medical facilities a serious issue, has resulted in a demand for virtual consulting services as a great solution for such a circumstance.
  • The increasing popularity of digital communication and data utilization.

The COVID-19 pandemic, just as with any other online business, emerged as an important factor in the expansion of patient engagement platforms. Before the pandemic, digital health engagement platforms were only obtainable to young patients who were familiar with digital equipment or smartphones.

However, due to various worldwide constraints on people's movement during the pandemic, doctors and patients were able to resume consultation and therapy with the aid of mobile patient engagement facilities. During the global epidemic, the annual sales of patient engagement platforms rose significantly and have proceeded to do so post-pandemic.

Attributes Details
Patient Engagement Platforms Market CAGR (2022 to 2032) 17%
Patient Engagement Platforms Market (2027) US$ 42.5 Billion
Patient Engagement Platforms Market Attraction The establishment of e-commerce websites has made a strong network of goods delivery networks that can be used to increase the efficiency of digital engagements by supplying necessary equipment and medicines.

Don't pay for what you don't need

Customize your report by selecting specific countries or regions and save 30%!

North America And Europe To Emerging As A Highly Lucrative Markets For Patient Engagement Platforms

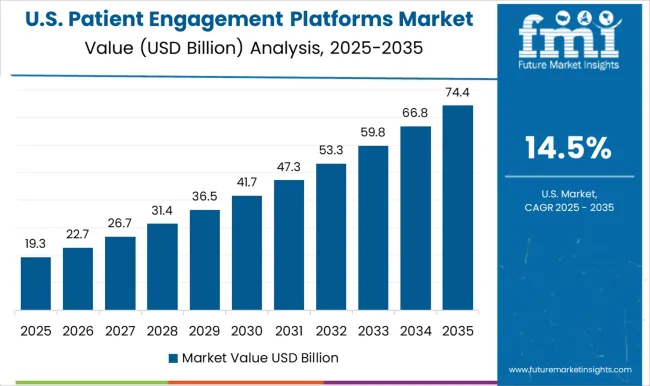
North American countries have made significant investments in developing digital patient engagement platform solutions for patient involvement due to the advantages of having a robust healthcare infrastructure and rapid adoption of clinical and electronic health record (EHR) systems.

This forward transformation by various healthcare Corporations, notably in the United States (USA) and Canada, has aided in placing North America at the leading edge of the global patient engagement platforms market. According to the previous analysis report, the Northwell Health Company of the USA expanded its services in December 2021 by implementing the Playback Health platform at some preferred clinical sites.

In Europe, software companies have successfully established an environment for implementing computer assistance to the elderly population who suffer from a variety of ailments, in addition to patient engagement.

Europe ranks second in the world in regards to providing patient engagement platforms through its well-known National Health Services (NHS) schemes conducted by different countries. The more evolved countries in Europe, such as the United Kingdom (UK), are also attempting to make the healthcare sector utterly paperless to address sustainability apprehensions.

Increasing growth of the Global Software Segment poses Substantial Expansion Opportunities

The software solution that serves as the interface between users and healthcare service providers is vital to the success of patient engagement platforms. These solutions, in the pattern of patient engagement mobile apps, permit the efficient transfer of prescription data to patients who reside in remote locations with access to the Internet.

As expected, this segment will produce the greatest growth output for the global market over the next few years. With the expansion of digital consciousness and the declining cost of mobile devices, the consulting services' software sub-segment is estimated to be the largest revenue-generating segment of the worldwide patient engagement platforms market, outpacing the technology segment.

By the end of 2021, the software and hardware segment comprised nearly 80% of the patient engagement mobile health applications market.

As digitization has been introduced in every walk of our lives, healthcare organizations have also started providing online services through various patient engagement platforms, which is a superbly growing market in the present decade.

With the advancement of online services in every sphere of life, healthcare organizations are also increasingly investing in developing patient-engagement mobile health apps for establishing a real-time connection with patients even when they are at home.

A new method of patient engagement has emerged as the most suitable method for maintaining customer satisfaction and trust in the healthcare organization and medical sector as well.

Health engagement platforms are also very essential from the point of view that most of the patients suffering from serious issues cannot visit the hospitals in time. In such times patient engagement platforms relieve the burden of traveling during such a sensitive condition. Healthcare sectors across the world are adopting the implementation of online services as much as possible to provide and strengthen their services for their patients.

Sabyasachi Ghosh
Sabyasachi Ghosh

Principal Consultant

Talk to Analyst

Find your sweet spots for generating winning opportunities in this market.

What is the Covid-19 Impact on Patient Engagement Platforms Market?

Like every other online business, the Covid-19 pandemic proved to be a major factor in the growth of patient engagement platforms. Before the pandemic, digital health engagement platforms were limited only to young patients having sufficient knowledge about digital devices or smartphones.

But during the pandemic, as there were worldwide restrictions on the movement of people, the doctors and patients were able to continue the consultation and therapy with the help of mobile patient engagement services.

During the pandemic, the market revenue of patient engagement platforms grew exponentially and is continuing to do so in the post-pandemic period as well.

As the service providers realize the benefits of patient engagement mobile apps, they are trying to assimilate more and more services for other diseases as well which is likely to boost the patient engagement platform market immensely in the coming days. In a nutshell, the Covid-19 pandemic proved to be bliss in disguise for the patient engagement platforms market.

What is the Current Dynamics of the Global Patient Engagement Platforms Market?

With the growing cases of infectious disease to the emergence of novel pathogens and vector-borne diseases, the use of patient engagement platforms has substituted the physical service provided at healthcare facilities and has provided the required impetus for the rapid growth of the patient engagement platforms market across the globe.

A rising proportion of the senior population and an increasing amount of contagious diseases that visit healthcare institutions is a severe issue that has created the demand for online consulting services as a perfect solution for such a situation.

Even the higher cost of healthcare services post the medical surgeries have also positioned digital patient engagement platforms as a relief for the citizens of developed and developing countries alike.

The growing trend of digital communication and data consumption is the major driving factor for higher healthcare engagement platforms in developing regions such as the Asia Pacific and Latin America.

What are the Major Challenges Limiting the Growth of the Patient Engagement Platform Market?

Making patients digitally literate and comfortable with online consulting services will pose a major hurdle for the rapid adoption of digital healthcare engagement platforms in all regions. Also, the availability of sufficient tools and equipment for conducting healthcare procedures for the patient is a major challenge that will be faced by the market players for popularizing the patient engagement platforms software in the area within their domain.

Get the data you need at a Fraction of the cost

Personalize your report by choosing insights you need
and save 40%!

Comparative View of Adjacent Patient Engagement Platforms Market

Patient Engagement Platform Market:

Attributes Patient Engagement Platform Market
CAGR (2022 to 2032) 17%
Market Value (2027) US$ 42.5 Billion
Growth Factor The growing trend of digitizing the service sector is the major growth factor for this market.
Opportunity Asia Pacific with an increasing data consumption rate has the highest growth potential.
Key Trends Post-acute facilities are gaining traction with the rise in medical emergency cases.

Hospital Information System Market:

Attributes Hospital Information System Market
CAGR (2022 to 2032) 5.4%
Market Value (2027) US$ 79.7 Billion
Growth Factor With the rapid increase in patient counts at hospitals and healthcare institutions HIS is emerging as a suitable solution.
Opportunity Record keeping for insurance policies and legal imperatives has created an enormous demand for HIS over online platforms.
Key Trends The requirement for automation and high data accuracy is the reason for the higher adoption of HIS by healthcare institutions.

Healthcare Customer Data Platform Market:

Attributes Healthcare Customer Data Platform Market
CAGR (2022 to 2032) 24%
Market Value (2027) US$ 930 Million
Growth Factor The growth of patient footfall in hospitals and medical institutions has made it necessary to keep digital records.
Opportunity Aggressive marketing by private hospitals to retain their customer base will increase the demand for digital data platforms
Key Trends The easy availability of cloud services for keeping vast amounts of data safe has increased the use of healthcare data platforms.

Patient engagement solutions service providers and market players indulged in developing new solutions are the two distinct fields operating in the global patient engagement platforms market.

Until 2021 service providers held almost 45% of the US$ 16.6 Billion revenue generated globally. Being the primary line of treatment services, service providers are predicted to continue this dominant position of occupying the most significant volume of the mobile patient engagement platform market for some more years ahead.

Healthcare financial engagement platforms are the emerging solution types widely adopted by healthcare services in the USA and other regions in the global market.

According to the previous analysis report, the Northwell Health Company of the USA expanded its services by deploying the Playback Health platform at some selected clinical siesta in December 2021.

What is the Growth Outlook for the Patient Engagement Platforms Market based on its Various Segments?

Patients around the world are opting more and more for digital solutions for the consulting service provided by their healthcare institutions which is driving the popularity of patient engagement platforms around the world.

The prominent component for the success of Patient engagement platforms is the software solution that acts as the interface between users and healthcare service providers. These solutions in the form of patient engagement mobile apps enable the efficient transfer of prescription data to the patient living at a remote location with an internet facility.

As evident, this segment is projected to provide the maximum growth output for the global market in the coming years.

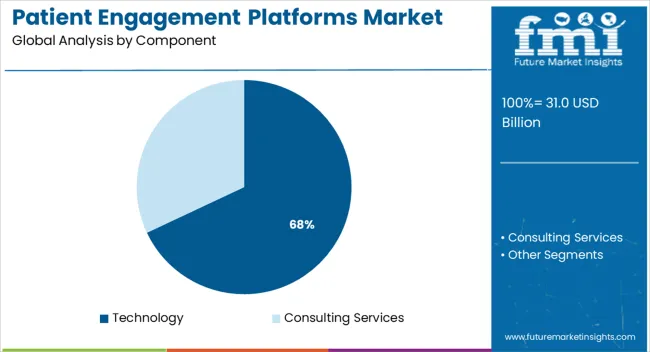
With the rise in digital awareness and decreasing cost of mobile devices, the consulting services' software sub-segment is expected to be the highest revenue-generating component of the technology segment of the global patient engagement platforms market.

The software and hardware segment accounted for almost 80% of the patient engagement mobile health applications market by the end of 2021.

In the technology segment, the patient rounding and patient experience survey sub-segments are also essential for the proper development of software solutions for the successful implementation of the best patient engagement platforms within any consumer base.

The technology part of the patient engagement platform market is growing rapidly, adopting the newest scientific advancements and promises of reliable growth following the popularity of consultation services provided by the software segment.

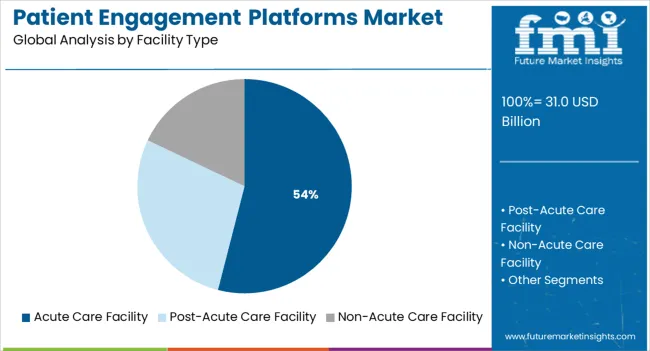
Patient engagement software solutions have evolved over the years and have turned specific in providing various types of facilities as per the requirement. In the present market, pharma patient engagement platforms are dealing in acute care facilities, post-acute care facilities, and non-acute care facilities as well.

Acute hospitals providing services for chronic disease management occupied the largest portion of the total revenue generated by healthcare engagement platforms at about 40% by the end of the year 2021.

Children's hospitals and ambulatory surgery centers are also observed to have a significant contribution to the expansion of the key companies in the market.

Also, the vast amount of research work carried out in the field for the development of the best patient engagement platforms has attracted various academic medical centers and military treatment facilities into the ambit of its market.

Post-acute care facilities provided are growing at a promising rate and are predicted to be the popular segment for patient engagement software companies increasingly trying to attract more users by expanding their services for every type of ailment.

Long-term acute facilities and skilled nursing facilities are expected to be the most promising sub-segments of the post-acute care facility segment for the digital healthcare engagement platforms in the coming days.

In the non-acute segment, physicians' offices and clinics have remained stagnant in their growth given the small patient base and less area of operation in specific locations. However, this segment is expected to generate some significant market for health engagement platforms with an increase in disease burden around the world.

What is the Performance of Silent Generator Market in different Geographic Regions?

With the advantage of having a robust healthcare infrastructure and early adoption of medical and electronic health record (EHR) systems, the countries of North America have invested highly in developing digital patient engagement platform solutions for involving patients.

This forward movement by a number of Healthcare Corporations, mostly in the United States (USA) and in Canada, to some extent has placed the North American geographic region at the forefront of the global patient engagement platforms market.

In Europe, as well as patient engagement, software companies have succeeded in creating an environment for providing digital assistance to the old age population suffering from several types of ailments.

Europe stands in second position globally in providing patient engagement platforms through its famous National Health Services (NHS) schemes formulated by various countries. The more developed Europe, such as the United Kingdom (UK), is also on the path of turning the healthcare sector totally paperless in accordance with environmental concerns.

Asia Pacific countries are also developing their digital ecosystem very rapidly and have digitized most of their financial activities in the last couple of years. With the advantage of having the highest population count in the countries such as China and India development of patient engagement mobile apps have been a booming industry in recent times.

Also, by recognizing the benefits of digital solutions in the healthcare sector, government organizations are also providing immense opportunities for the development and adoption of healthcare financial engagement platforms by private players.

With the rising economic conditions of the general people, the Asia Pacific geographical region is predicted to be the region with the highest growth potential for patient engagement platforms during the forecast years.

What are the Various Competition going on in the Patient Engagement Platforms Market?

The global market for patient engagement platforms is severely fragmented by the presence of a number of solution-providing companies that range widely in size.

The major players are well equipped with the most advanced technology and software products that provide them an edge over the local players.

The main strategy adopted by these players to capture the digital patient engagement platforms market is to collaborate and partner with renowned healthcare service providers already well-established in the

What are the Most Recent Developments Adopted by the Market Players Influencing the Global Patient Engagement Platforms Market?

  • Press Ganey Company of the USA partnered with another USA global network company of healthcare professionals and experienced doctors by the name of the Beryl Institute in 2021. This partnership is expected to increase the focus of Press Ganey in accelerating its healthcare engagement platforms for its patients and advancing the healthcare experience movement ahead.
  • Two companies in the USA named Vocera and Amazon collaborated in 2021 to build a product for the Alexa assistant devices named Vocera skill tool. This collaboration will expand Vocera’s pharma patient engagement platforms ecosystem by providing hands-free and voice experiences for aged patients and families.
  • SONIFI Health and Cipher Health of the USA entered into a partnership in 2021 to offer a more holistic approach to patient communications via mobile patient engagement platforms. Both solution providers are focusing to leverage their key capabilities of providing successful care planning for their customers worldwide.

Key Players

  • Allscripts Healthcare Solutions
  • Orion Health Ltd.
  • McKesson Corporation
  • Cerner Corporation
  • GetwellNetwork Inc.
  • Phytel Inc.
  • Medecision Inc.
  • Lincor Solutions Ltd.
  • YourCareUniverse Inc.
  • Athenahealth Inc.

Key Segments

By Component:

  • Technology
    • Patient Rounding
    • Patient Experience Survey
  • Consulting Services

By Facility Type:

  • Acute Care Facility
    • Acute Hospitals
    • Children’s Hospitals
    • Academic Medical Centre
    • Military Treatment Facility
    • Ambulatory Surgery Centre
  • Post Acute Care Facility
    • Long-Term Acute Facility
    • Skilled Nursing Facility
    • Other
  • Non-Acute Care Facility
    • Physicians Office
    • Clinics

By Region:

  • North America
  • Latin America
  • Europe
  • Asia Pacific
  • Middle East and Africa (MEA)

Frequently Asked Questions

What is the Growth Outlook of the Patient Engagement Platforms Market?

The patient engagement platforms market is estimated to record a CAGR of 17% during the forecast period.

What is the Projected Value of Patient Engagement Platforms Market By 2032?

The patient engagement platforms market is predicted to be valued at US$ 93.4 Billion by 2032.

What was the Historical Size of the Patient Engagement Platforms Market?

The global patient engagement platforms market was valued at US$ 16.6 Billion in 2021.

Which Region in the Global Patient Engagement Platforms Market Accounts for the Largest Revenue Share?

North America accounts for the largest revenue share in the global patient engagement platforms market.

Which Region has the Highest Growth Potential in the Patient Engagement Platforms Market?

Asia Pacific region is predicted to witness the highest growth rate in the patient engagement platforms market.

Table of Content

1. Executive Summary | Patient Engagement Platforms Market

    1.1. Global Market Outlook

    1.2. Demand-side Trends

    1.3. Supply-side Trends

    1.4. Technology Roadmap Analysis

    1.5. Analysis and Recommendations

2. Market Overview

    2.1. Market Coverage / Taxonomy

    2.2. Market Definition / Scope / Limitations

3. Market Background

    3.1. Market Dynamics

        3.1.1. Drivers

        3.1.2. Restraints

        3.1.3. Opportunity

        3.1.4. Trends

    3.2. Scenario Forecast

        3.2.1. Demand in Optimistic Scenario

        3.2.2. Demand in Likely Scenario

        3.2.3. Demand in Conservative Scenario

    3.3. Opportunity Map Analysis

    3.4. Investment Feasibility Matrix

    3.5. Value Chain Analysis

        3.5.1. Profit Margin Analysis

        3.5.2. Service Providers

    3.6. PESTLE and Porter’s Analysis

    3.7. Regulatory Landscape

        3.7.1. By Key Regions

        3.7.2. By Key Countries

    3.8. Regional Parent Market Outlook

4. Global Market Analysis 2017 to 2021 and Forecast, 2022 to 2032

    4.1. Historical Market Size Value (US$ Million) Analysis, 2017 to 2021

    4.2. Current and Future Market Size Value (US$ Million) Projections, 2022 to 2032

        4.2.1. Y-o-Y Growth Trend Analysis

        4.2.2. Absolute $ Opportunity Analysis

5. Global Market Analysis 2017 to 2021 and Forecast 2022 to 2032, By Component

    5.1. Introduction / Key Findings

    5.2. Historical Market Size Value (US$ Million) Analysis By Component, 2017 to 2021

    5.3. Current and Future Market Size Value (US$ Million) Analysis and Forecast By Component, 2022 to 2032

        5.3.1. Technology

            5.3.1.1. Patient Rounding

            5.3.1.2. Patient Experience Survey

        5.3.2. Consulting Services

    5.4. Y-o-Y Growth Trend Analysis By Component, 2017 to 2021

    5.5. Absolute $ Opportunity Analysis By Component, 2022 to 2032

6. Global Market Analysis 2017 to 2021 and Forecast 2022 to 2032, By Facility Type

    6.1. Introduction / Key Findings

    6.2. Historical Market Size Value (US$ Million) Analysis By Facility Type, 2017 to 2021

    6.3. Current and Future Market Size Value (US$ Million) Analysis and Forecast By Facility Type, 2022 to 2032

        6.3.1. Acute Care Facility

            6.3.1.1. Acute Hospitals

            6.3.1.2. Children Hospitals

            6.3.1.3. Academic Medical Center

            6.3.1.4. Military Treatment Facility

            6.3.1.5. Ambulatory Surgery Center

        6.3.2. Post-Acute Care Facility

            6.3.2.1. Long-Term Acute Facility

            6.3.2.2. Skilled Nursing Facility

            6.3.2.3. Other

        6.3.3. Non-Acute Care Facility

            6.3.3.1. Physicians Office

            6.3.3.2. Clinics

    6.4. Y-o-Y Growth Trend Analysis By Facility Type, 2017 to 2021

    6.5. Absolute $ Opportunity Analysis By Facility Type, 2022 to 2032

7. Global Market Analysis 2017 to 2021 and Forecast 2022 to 2032, By Region

    7.1. Introduction

    7.2. Historical Market Size Value (US$ Million) Analysis By Region, 2017 to 2021

    7.3. Current Market Size Value (US$ Million) Analysis and Forecast By Region, 2022 to 2032

        7.3.1. North America

        7.3.2. Latin America

        7.3.3. Europe

        7.3.4. Asia Pacific

        7.3.5. Middle East and Africa(MEA)

    7.4. Market Attractiveness Analysis By Region

8. North America Market Analysis 2017 to 2021 and Forecast 2022 to 2032, By Country

    8.1. Historical Market Size Value (US$ Million) Trend Analysis By Market Taxonomy, 2017 to 2021

    8.2. Market Size Value (US$ Million) Forecast By Market Taxonomy, 2022 to 2032

        8.2.1. By Country

            8.2.1.1. USA

            8.2.1.2. Canada

        8.2.2. By Component

        8.2.3. By Facility Type

    8.3. Market Attractiveness Analysis

        8.3.1. By Country

        8.3.2. By Component

        8.3.3. By Facility Type

    8.4. Key Takeaways

9. Latin America Market Analysis 2017 to 2021 and Forecast 2022 to 2032, By Country

    9.1. Historical Market Size Value (US$ Million) Trend Analysis By Market Taxonomy, 2017 to 2021

    9.2. Market Size Value (US$ Million) Forecast By Market Taxonomy, 2022 to 2032

        9.2.1. By Country

            9.2.1.1. Brazil

            9.2.1.2. Mexico

            9.2.1.3. Argentina

            9.2.1.4. Chile

            9.2.1.5. Peru

            9.2.1.6. Rest of Latin America

        9.2.2. By Component

        9.2.3. By Facility Type

    9.3. Market Attractiveness Analysis

        9.3.1. By Country

        9.3.2. By Component

        9.3.3. By Facility Type

    9.4. Key Takeaways

10. Europe Market Analysis 2017 to 2021 and Forecast 2022 to 2032, By Country

    10.1. Historical Market Size Value (US$ Million) Trend Analysis By Market Taxonomy, 2017 to 2021

    10.2. Market Size Value (US$ Million) Forecast By Market Taxonomy, 2022 to 2032

        10.2.1. By Country

            10.2.1.1. Germany

            10.2.1.2. Italy

            10.2.1.3. France

            10.2.1.4. United Kingdom

            10.2.1.5. Spain

            10.2.1.6. Russia

            10.2.1.7. BENELUX

            10.2.1.8. Rest of Europe

        10.2.2. By Component

        10.2.3. By Facility Type

    10.3. Market Attractiveness Analysis

        10.3.1. By Country

        10.3.2. By Component

        10.3.3. By Facility Type

    10.4. Key Takeaways

11. Asia Pacific Market Analysis 2017 to 2021 and Forecast 2022 to 2032, By Country

    11.1. Historical Market Size Value (US$ Million) Trend Analysis By Market Taxonomy, 2017 to 2021

    11.2. Market Size Value (US$ Million) Forecast By Market Taxonomy, 2022 to 2032

        11.2.1. By Country

            11.2.1.1. China

            11.2.1.2. Japan

            11.2.1.3. South Korea

            11.2.1.4. Rest of Asia Pacific

        11.2.2. By Component

        11.2.3. By Facility Type

    11.3. Market Attractiveness Analysis

        11.3.1. By Country

        11.3.2. By Component

        11.3.3. By Facility Type

    11.4. Key Takeaways

12. MEA Market Analysis 2017 to 2021 and Forecast 2022 to 2032, By Country

    12.1. Historical Market Size Value (US$ Million) Trend Analysis By Market Taxonomy, 2017 to 2021

    12.2. Market Size Value (US$ Million) Forecast By Market Taxonomy, 2022 to 2032

        12.2.1. By Country

            12.2.1.1. GCC Countries

            12.2.1.2. South Africa

            12.2.1.3. Turkey

            12.2.1.4. Rest of Middle East and Africa(MEA)

        12.2.2. By Component

        12.2.3. By Facility Type

    12.3. Market Attractiveness Analysis

        12.3.1. By Country

        12.3.2. By Component

        12.3.3. By Facility Type

    12.4. Key Takeaways

13. Key Countries Market Analysis

    13.1. USA

        13.1.1. Pricing Analysis

        13.1.2. Market Share Analysis, 2021

            13.1.2.1. By Component

            13.1.2.2. By Facility Type

    13.2. Canada

        13.2.1. Pricing Analysis

        13.2.2. Market Share Analysis, 2021

            13.2.2.1. By Component

            13.2.2.2. By Facility Type

    13.3. Brazil

        13.3.1. Pricing Analysis

        13.3.2. Market Share Analysis, 2021

            13.3.2.1. By Component

            13.3.2.2. By Facility Type

    13.4. Mexico

        13.4.1. Pricing Analysis

        13.4.2. Market Share Analysis, 2021

            13.4.2.1. By Component

            13.4.2.2. By Facility Type

    13.5. Argentina

        13.5.1. Pricing Analysis

        13.5.2. Market Share Analysis, 2021

            13.5.2.1. By Component

            13.5.2.2. By Facility Type

    13.6. Chile

        13.6.1. Pricing Analysis

        13.6.2. Market Share Analysis, 2021

            13.6.2.1. By Component

            13.6.2.2. By Facility Type

    13.7. Peru

        13.7.1. Pricing Analysis

        13.7.2. Market Share Analysis, 2021

            13.7.2.1. By Component

            13.7.2.2. By Facility Type

    13.8. Germany

        13.8.1. Pricing Analysis

        13.8.2. Market Share Analysis, 2021

            13.8.2.1. By Component

            13.8.2.2. By Facility Type

    13.9. Italy

        13.9.1. Pricing Analysis

        13.9.2. Market Share Analysis, 2021

            13.9.2.1. By Component

            13.9.2.2. By Facility Type

    13.10. France

        13.10.1. Pricing Analysis

        13.10.2. Market Share Analysis, 2021

            13.10.2.1. By Component

            13.10.2.2. By Facility Type

    13.11. United Kingdom

        13.11.1. Pricing Analysis

        13.11.2. Market Share Analysis, 2021

            13.11.2.1. By Component

            13.11.2.2. By Facility Type

    13.12. Spain

        13.12.1. Pricing Analysis

        13.12.2. Market Share Analysis, 2021

            13.12.2.1. By Component

            13.12.2.2. By Facility Type

    13.13. Russia

        13.13.1. Pricing Analysis

        13.13.2. Market Share Analysis, 2021

            13.13.2.1. By Component

            13.13.2.2. By Facility Type

    13.14. BENELUX

        13.14.1. Pricing Analysis

        13.14.2. Market Share Analysis, 2021

            13.14.2.1. By Component

            13.14.2.2. By Facility Type

    13.15. China

        13.15.1. Pricing Analysis

        13.15.2. Market Share Analysis, 2021

            13.15.2.1. By Component

            13.15.2.2. By Facility Type

    13.16. Japan

        13.16.1. Pricing Analysis

        13.16.2. Market Share Analysis, 2021

            13.16.2.1. By Component

            13.16.2.2. By Facility Type

    13.17. South Korea

        13.17.1. Pricing Analysis

        13.17.2. Market Share Analysis, 2021

            13.17.2.1. By Component

            13.17.2.2. By Facility Type

    13.18. GCC Countries

        13.18.1. Pricing Analysis

        13.18.2. Market Share Analysis, 2021

            13.18.2.1. By Component

            13.18.2.2. By Facility Type

    13.19. South Africa

        13.19.1. Pricing Analysis

        13.19.2. Market Share Analysis, 2021

            13.19.2.1. By Component

            13.19.2.2. By Facility Type

    13.20. Turkey

        13.20.1. Pricing Analysis

        13.20.2. Market Share Analysis, 2021

            13.20.2.1. By Component

            13.20.2.2. By Facility Type

14. Market Structure Analysis

    14.1. Competition Dashboard

    14.2. Competition Benchmarking

    14.3. Market Share Analysis of Top Players

        14.3.1. By Regional

        14.3.2. By Component

        14.3.3. By Facility Type

15. Competition Analysis

    15.1. Competition Deep Dive

        15.1.1. Vocera Communications Inc.

            15.1.1.1. Overview

            15.1.1.2. Product Portfolio

            15.1.1.3. Profitability by Market Segments

            15.1.1.4. Sales Footprint

            15.1.1.5. Strategy Overview

                15.1.1.5.1. Marketing Strategy

                15.1.1.5.2. Product Strategy

                15.1.1.5.3. Channel Strategy

        15.1.2. Press Ganey Associates

            15.1.2.1. Overview

            15.1.2.2. Product Portfolio

            15.1.2.3. Profitability by Market Segments

            15.1.2.4. Sales Footprint

            15.1.2.5. Strategy Overview

                15.1.2.5.1. Marketing Strategy

                15.1.2.5.2. Product Strategy

                15.1.2.5.3. Channel Strategy

        15.1.3. Qualtrics International Inc.

            15.1.3.1. Overview

            15.1.3.2. Product Portfolio

            15.1.3.3. Profitability by Market Segments

            15.1.3.4. Sales Footprint

            15.1.3.5. Strategy Overview

                15.1.3.5.1. Marketing Strategy

                15.1.3.5.2. Product Strategy

                15.1.3.5.3. Channel Strategy

        15.1.4. Sodexo

            15.1.4.1. Overview

            15.1.4.2. Product Portfolio

            15.1.4.3. Profitability by Market Segments

            15.1.4.4. Sales Footprint

            15.1.4.5. Strategy Overview

                15.1.4.5.1. Marketing Strategy

                15.1.4.5.2. Product Strategy

                15.1.4.5.3. Channel Strategy

        15.1.5. Huron Consulting Group

            15.1.5.1. Overview

            15.1.5.2. Product Portfolio

            15.1.5.3. Profitability by Market Segments

            15.1.5.4. Sales Footprint

            15.1.5.5. Strategy Overview

                15.1.5.5.1. Marketing Strategy

                15.1.5.5.2. Product Strategy

                15.1.5.5.3. Channel Strategy

        15.1.6. Aramark

            15.1.6.1. Overview

            15.1.6.2. Product Portfolio

            15.1.6.3. Profitability by Market Segments

            15.1.6.4. Sales Footprint

            15.1.6.5. Strategy Overview

                15.1.6.5.1. Marketing Strategy

                15.1.6.5.2. Product Strategy

                15.1.6.5.3. Channel Strategy

        15.1.7. Cipherhealth

            15.1.7.1. Overview

            15.1.7.2. Product Portfolio

            15.1.7.3. Profitability by Market Segments

            15.1.7.4. Sales Footprint

            15.1.7.5. Strategy Overview

                15.1.7.5.1. Marketing Strategy

                15.1.7.5.2. Product Strategy

                15.1.7.5.3. Channel Strategy

        15.1.8. Accenture Plc

            15.1.8.1. Overview

            15.1.8.2. Product Portfolio

            15.1.8.3. Profitability by Market Segments

            15.1.8.4. Sales Footprint

            15.1.8.5. Strategy Overview

                15.1.8.5.1. Marketing Strategy

                15.1.8.5.2. Product Strategy

                15.1.8.5.3. Channel Strategy

        15.1.9. GetWellNetwork Inc.

            15.1.9.1. Overview

            15.1.9.2. Product Portfolio

            15.1.9.3. Profitability by Market Segments

            15.1.9.4. Sales Footprint

            15.1.9.5. Strategy Overview

                15.1.9.5.1. Marketing Strategy

                15.1.9.5.2. Product Strategy

                15.1.9.5.3. Channel Strategy

        15.1.10. HybridChart Inc.

            15.1.10.1. Overview

            15.1.10.2. Product Portfolio

            15.1.10.3. Profitability by Market Segments

            15.1.10.4. Sales Footprint

            15.1.10.5. Strategy Overview

                15.1.10.5.1. Marketing Strategy

                15.1.10.5.2. Product Strategy

                15.1.10.5.3. Channel Strategy

16. Assumptions & Acronyms Used

17. Research Methodology

Don't pay for what you don't need

Customize your report by selecting specific countries or regions and save 30%!

List of Tables

Table 1: Global Market Value (US$ Million) Forecast by Region, 2017 to 2032

Table 2: Global Market Value (US$ Million) Forecast by Component, 2017 to 2032

Table 3: Global Market Value (US$ Million) Forecast by Facility Type, 2017 to 2032

Table 4: North America Market Value (US$ Million) Forecast by Country, 2017 to 2032

Table 5: North America Market Value (US$ Million) Forecast by Component, 2017 to 2032

Table 6: North America Market Value (US$ Million) Forecast by Facility Type, 2017 to 2032

Table 7: Latin America Market Value (US$ Million) Forecast by Country, 2017 to 2032

Table 8: Latin America Market Value (US$ Million) Forecast by Component, 2017 to 2032

Table 9: Latin America Market Value (US$ Million) Forecast by Facility Type, 2017 to 2032

Table 10: Europe Market Value (US$ Million) Forecast by Country, 2017 to 2032

Table 11: Europe Market Value (US$ Million) Forecast by Component, 2017 to 2032

Table 12: Europe Market Value (US$ Million) Forecast by Facility Type, 2017 to 2032

Table 13: Asia Pacific Market Value (US$ Million) Forecast by Country, 2017 to 2032

Table 14: Asia Pacific Market Value (US$ Million) Forecast by Component, 2017 to 2032

Table 15: Asia Pacific Market Value (US$ Million) Forecast by Facility Type, 2017 to 2032

Table 16: MEA Market Value (US$ Million) Forecast by Country, 2017 to 2032

Table 17: MEA Market Value (US$ Million) Forecast by Component, 2017 to 2032

Table 18: MEA Market Value (US$ Million) Forecast by Facility Type, 2017 to 2032
Sabyasachi Ghosh
Sabyasachi Ghosh

Principal Consultant

Talk to Analyst

Find your sweet spots for generating winning opportunities in this market.

List of Charts

Figure 1: Global Market Value (US$ Million) by Component, 2022 to 2032

Figure 2: Global Market Value (US$ Million) by Facility Type, 2022 to 2032

Figure 3: Global Market Value (US$ Million) by Region, 2022 to 2032

Figure 4: Global Market Value (US$ Million) Analysis by Region, 2017 to 2032

Figure 5: Global Market Value Share (%) and BPS Analysis by Region, 2022 to 2032

Figure 6: Global Market Y-o-Y Growth (%) Projections by Region, 2022 to 2032

Figure 7: Global Market Value (US$ Million) Analysis by Component, 2017 to 2032

Figure 8: Global Market Value Share (%) and BPS Analysis by Component, 2022 to 2032

Figure 9: Global Market Y-o-Y Growth (%) Projections by Component, 2022 to 2032

Figure 10: Global Market Value (US$ Million) Analysis by Facility Type, 2017 to 2032

Figure 11: Global Market Value Share (%) and BPS Analysis by Facility Type, 2022 to 2032

Figure 12: Global Market Y-o-Y Growth (%) Projections by Facility Type, 2022 to 2032

Figure 13: Global Market Attractiveness by Component, 2022 to 2032

Figure 14: Global Market Attractiveness by Facility Type, 2022 to 2032

Figure 15: Global Market Attractiveness by Region, 2022 to 2032

Figure 16: North America Market Value (US$ Million) by Component, 2022 to 2032

Figure 17: North America Market Value (US$ Million) by Facility Type, 2022 to 2032

Figure 18: North America Market Value (US$ Million) by Country, 2022 to 2032

Figure 19: North America Market Value (US$ Million) Analysis by Country, 2017 to 2032

Figure 20: North America Market Value Share (%) and BPS Analysis by Country, 2022 to 2032

Figure 21: North America Market Y-o-Y Growth (%) Projections by Country, 2022 to 2032

Figure 22: North America Market Value (US$ Million) Analysis by Component, 2017 to 2032

Figure 23: North America Market Value Share (%) and BPS Analysis by Component, 2022 to 2032

Figure 24: North America Market Y-o-Y Growth (%) Projections by Component, 2022 to 2032

Figure 25: North America Market Value (US$ Million) Analysis by Facility Type, 2017 to 2032

Figure 26: North America Market Value Share (%) and BPS Analysis by Facility Type, 2022 to 2032

Figure 27: North America Market Y-o-Y Growth (%) Projections by Facility Type, 2022 to 2032

Figure 28: North America Market Attractiveness by Component, 2022 to 2032

Figure 29: North America Market Attractiveness by Facility Type, 2022 to 2032

Figure 30: North America Market Attractiveness by Country, 2022 to 2032

Figure 31: Latin America Market Value (US$ Million) by Component, 2022 to 2032

Figure 32: Latin America Market Value (US$ Million) by Facility Type, 2022 to 2032

Figure 33: Latin America Market Value (US$ Million) by Country, 2022 to 2032

Figure 34: Latin America Market Value (US$ Million) Analysis by Country, 2017 to 2032

Figure 35: Latin America Market Value Share (%) and BPS Analysis by Country, 2022 to 2032

Figure 36: Latin America Market Y-o-Y Growth (%) Projections by Country, 2022 to 2032

Figure 37: Latin America Market Value (US$ Million) Analysis by Component, 2017 to 2032

Figure 38: Latin America Market Value Share (%) and BPS Analysis by Component, 2022 to 2032

Figure 39: Latin America Market Y-o-Y Growth (%) Projections by Component, 2022 to 2032

Figure 40: Latin America Market Value (US$ Million) Analysis by Facility Type, 2017 to 2032

Figure 41: Latin America Market Value Share (%) and BPS Analysis by Facility Type, 2022 to 2032

Figure 42: Latin America Market Y-o-Y Growth (%) Projections by Facility Type, 2022 to 2032

Figure 43: Latin America Market Attractiveness by Component, 2022 to 2032

Figure 44: Latin America Market Attractiveness by Facility Type, 2022 to 2032

Figure 45: Latin America Market Attractiveness by Country, 2022 to 2032

Figure 46: Europe Market Value (US$ Million) by Component, 2022 to 2032

Figure 47: Europe Market Value (US$ Million) by Facility Type, 2022 to 2032

Figure 48: Europe Market Value (US$ Million) by Country, 2022 to 2032

Figure 49: Europe Market Value (US$ Million) Analysis by Country, 2017 to 2032

Figure 50: Europe Market Value Share (%) and BPS Analysis by Country, 2022 to 2032

Figure 51: Europe Market Y-o-Y Growth (%) Projections by Country, 2022 to 2032

Figure 52: Europe Market Value (US$ Million) Analysis by Component, 2017 to 2032

Figure 53: Europe Market Value Share (%) and BPS Analysis by Component, 2022 to 2032

Figure 54: Europe Market Y-o-Y Growth (%) Projections by Component, 2022 to 2032

Figure 55: Europe Market Value (US$ Million) Analysis by Facility Type, 2017 to 2032

Figure 56: Europe Market Value Share (%) and BPS Analysis by Facility Type, 2022 to 2032

Figure 57: Europe Market Y-o-Y Growth (%) Projections by Facility Type, 2022 to 2032

Figure 58: Europe Market Attractiveness by Component, 2022 to 2032

Figure 59: Europe Market Attractiveness by Facility Type, 2022 to 2032

Figure 60: Europe Market Attractiveness by Country, 2022 to 2032

Figure 61: Asia Pacific Market Value (US$ Million) by Component, 2022 to 2032

Figure 62: Asia Pacific Market Value (US$ Million) by Facility Type, 2022 to 2032

Figure 63: Asia Pacific Market Value (US$ Million) by Country, 2022 to 2032

Figure 64: Asia Pacific Market Value (US$ Million) Analysis by Country, 2017 to 2032

Figure 65: Asia Pacific Market Value Share (%) and BPS Analysis by Country, 2022 to 2032

Figure 66: Asia Pacific Market Y-o-Y Growth (%) Projections by Country, 2022 to 2032

Figure 67: Asia Pacific Market Value (US$ Million) Analysis by Component, 2017 to 2032

Figure 68: Asia Pacific Market Value Share (%) and BPS Analysis by Component, 2022 to 2032

Figure 69: Asia Pacific Market Y-o-Y Growth (%) Projections by Component, 2022 to 2032

Figure 70: Asia Pacific Market Value (US$ Million) Analysis by Facility Type, 2017 to 2032

Figure 71: Asia Pacific Market Value Share (%) and BPS Analysis by Facility Type, 2022 to 2032

Figure 72: Asia Pacific Market Y-o-Y Growth (%) Projections by Facility Type, 2022 to 2032

Figure 73: Asia Pacific Market Attractiveness by Component, 2022 to 2032

Figure 74: Asia Pacific Market Attractiveness by Facility Type, 2022 to 2032

Figure 75: Asia Pacific Market Attractiveness by Country, 2022 to 2032

Figure 76: MEA Market Value (US$ Million) by Component, 2022 to 2032

Figure 77: MEA Market Value (US$ Million) by Facility Type, 2022 to 2032

Figure 78: MEA Market Value (US$ Million) by Country, 2022 to 2032

Figure 79: MEA Market Value (US$ Million) Analysis by Country, 2017 to 2032

Figure 80: MEA Market Value Share (%) and BPS Analysis by Country, 2022 to 2032

Figure 81: MEA Market Y-o-Y Growth (%) Projections by Country, 2022 to 2032

Figure 82: MEA Market Value (US$ Million) Analysis by Component, 2017 to 2032

Figure 83: MEA Market Value Share (%) and BPS Analysis by Component, 2022 to 2032

Figure 84: MEA Market Y-o-Y Growth (%) Projections by Component, 2022 to 2032

Figure 85: MEA Market Value (US$ Million) Analysis by Facility Type, 2017 to 2032

Figure 86: MEA Market Value Share (%) and BPS Analysis by Facility Type, 2022 to 2032

Figure 87: MEA Market Y-o-Y Growth (%) Projections by Facility Type, 2022 to 2032

Figure 88: MEA Market Attractiveness by Component, 2022 to 2032

Figure 89: MEA Market Attractiveness by Facility Type, 2022 to 2032

Figure 90: MEA Market Attractiveness by Country, 2022 to 2032

Recommendations

Healthcare

Remote Patient Monitoring Devices Market

Published : March 2023

Healthcare

Patient Handling Equipment Market

Published : November 2022

Healthcare

Europe Radiotherapy Patient Positioning Market

Published : May 2022

Explore Healthcare Insights

View Reports

Patient Engagement Platforms Market