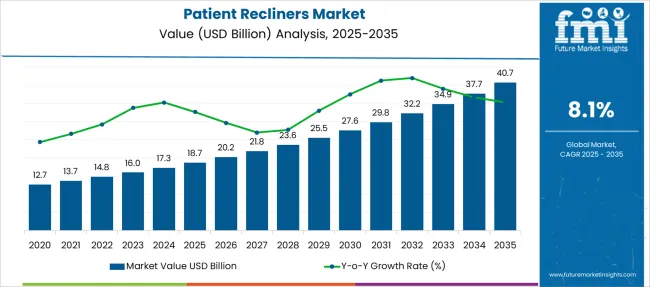
The Patient Recliners Market is estimated to be valued at USD 18.7 billion in 2025 and is projected to reach USD 40.7 billion by 2035, registering a compound annual growth rate (CAGR) of 8.1% over the forecast period.

| Metric | Value |
|---|---|
| Patient Recliners Market Estimated Value in (2025 E) | USD 18.7 billion |
| Patient Recliners Market Forecast Value in (2035 F) | USD 40.7 billion |
| Forecast CAGR (2025 to 2035) | 8.1% |
The patient recliners market is showing steady growth, driven by the increasing demand for specialized seating solutions in healthcare settings. Rising prevalence of cardiac conditions and other chronic illnesses has led to greater focus on patient comfort and recovery support. Hospitals have been prioritizing ergonomic furniture that enhances patient mobility, reduces pressure sores, and improves overall care outcomes.
Advances in recliner design, including adjustable features and durable materials, have made these products essential in clinical environments. Additionally, healthcare infrastructure development and an aging patient population have expanded the need for patient recliners.
The growing emphasis on patient-centered care and hospital accreditation standards has further boosted market adoption. Moving forward, innovation in material technology and increased healthcare spending are expected to support market growth. Segmental expansion is anticipated to be driven by Cardiac Care Recliners as the leading indication and Hospitals as the primary end user.
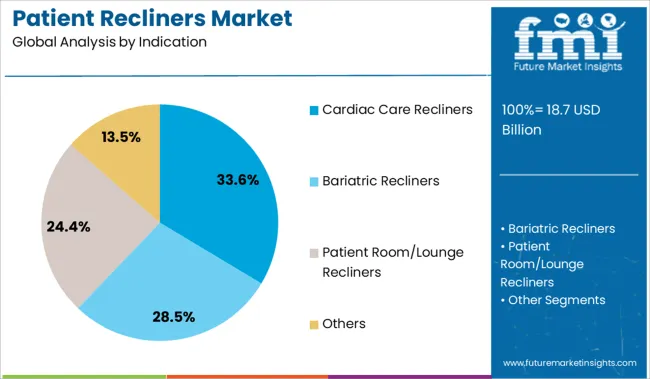
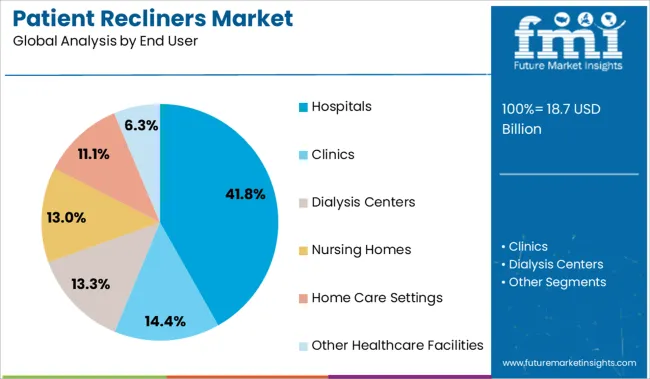
The market is segmented by Indication and End User and region. By Indication, the market is divided into Cardiac Care Recliners, Bariatric Recliners, Patient Room/Lounge Recliners, and Others. In terms of End User, the market is classified into Hospitals, Clinics, Dialysis Centers, Nursing Homes, Home Care Settings, and Other Healthcare Facilities. Regionally, the market is classified into North America, Latin America, Western Europe, Eastern Europe, Balkan & Baltic Countries, Russia & Belarus, Central Asia, East Asia, South Asia & Pacific, and the Middle East & Africa.

The Cardiac Care Recliners segment is projected to account for 33.6% of the patient recliners market revenue in 2025, maintaining its leadership among indication categories. This growth is driven by the necessity for recliners designed to support patients with cardiac conditions who require enhanced comfort and posture management. These recliners are often equipped with features that facilitate circulation, reduce swelling, and accommodate medical devices.
The segment benefits from the increasing incidence of cardiovascular diseases and longer hospital stays for cardiac patients. Healthcare providers prefer recliners that improve patient recovery experiences while supporting clinical monitoring.
As cardiac care units expand and focus on patient comfort, the demand for specialized recliners in this segment is expected to remain strong.

The Hospitals segment is expected to hold 41.8% of the patient recliners market revenue in 2025, sustaining its position as the dominant end user. Hospitals represent the primary environment where patient recliners are utilized due to their role in inpatient care and post-operative recovery.
The segment’s growth is supported by hospital investments in patient comfort amenities and the need for durable seating solutions that can withstand frequent use. Hospitals prioritize recliners that offer ease of cleaning, infection control compliance, and multi-functionality to serve diverse patient needs.
Furthermore, rising hospital admissions and the expansion of cardiac and critical care units have increased the adoption of patient recliners. As healthcare facilities continue to upgrade infrastructure and focus on enhancing patient experience, the Hospitals segment is projected to maintain its market leadership.
Increased safety for both patients as well as caregivers is the prime requirement of any medical equipment that is generating a huge demand for patient recliners as well. The global patient recliners market is expected to witness steady and continuous growth over the forecast period of 2020 to 2035 due to the growing number of private as well as public healthcare facilities across the globe.
Sales of patient recliners for home care settings are expected to increase with increasing disposable income and to improve the standard of living in both developed as well as emerging markets.
Expanding aging population and higher footfall in hospitals are the major factors driving the sales of patient recliners market over the last few years. Technological advancements and enhanced functionality of modern assets would significantly drive the demand for patient recliners over the forecast period.
For instance, ergonomically mapped recliners designed to relieve pressure are widely getting adopted by the USA patient recliners market share these days. However, most of the sales of patient recliners in today’s market are achieved by typical ones that are hard to move despite the fact that they are equipped with casters.
Moreover, aesthetic and functional issues are also limiting the demand for patient recliners by healthcare institutions. However, recent advances have made the shifting of patients from recliners to wheelchairs, beds, or other patient transfer devices easier, which has supplemented the demand for patient recliners further.
Geographically, the demand for patient recliners is highest in the North America region, accounting for almost 37.5% achieved globally. The USA clearly dominates the global patient recliners market due to the highest standard of healthcare. Europe is figured out to be the second-largest market for sales of patient recliners contributing to nearly 33.4% due to more number of key players operating in the region.
Asia Pacific patient recliners market is expected to witness considerable growth in demand for patient recliners due to rapid acceptance of these products by the growing aging population. Higher installation and maintenance costs are the major factors and challenges for the sales of patient recliners in Asia Pacific countries.

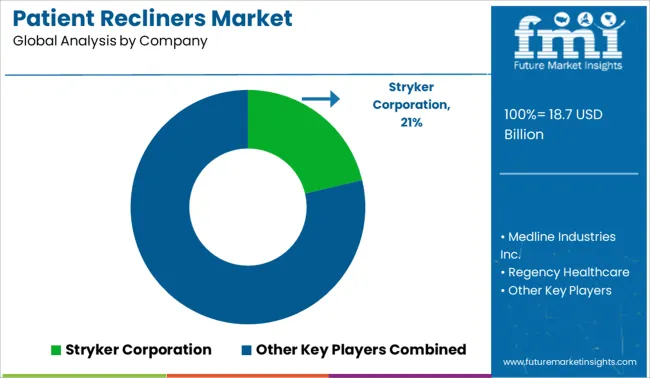
Some of the popular players in the patient recliners market include Jordan Active Patient Recliner (Krug Inc.), Ava, Serenity (Nemschoff), Accord Wieland, versant (Sauder MFG Co.), Affina, Perth, Soltice (KI), and Symmetry Plus (Stryker) among others.
| Report Attribute | Details |
|---|---|
| Growth Rate | CAGR of 8.1% from 2025 to 2035 |
| Base Year for Estimation | 2024 |
| Historical Data | 2020 to 2024 |
| Forecast Period | 2025 to 2035 |
| Quantitative Units | Revenue in USD Million and CAGR from 2025 to 2035 |
| Report Coverage | Revenue Forecast, Volume Forecast, Company Ranking, Competitive Landscape, Growth Factors, Trends and Pricing Analysis |
| Segments Covered | Indication, End user, Region |
| Regions Covered | North America; Latin America; Europe; East Asia; South Asia; Oceania; Middle East and Africa |
| Key Countries Profiled | USA, Canada, Brazil, Argentina, Germany, UK, France, Spain, Italy, Nordics, BENELUX, Australia & New Zealand, China, India, ASEAN, GCC, South Africa |
| Key Companies Profiled | Jordan Active Patient Recliner (Krug Inc.); Ava, Serenity (Nemschoff); Accord Wieland; Versant (Sauder MFG Co.); Affina; Perth; Soltice (KI); Symmetry Plus (Stryker) |
| Customization | Available Upon Request |
The global patient recliners market is estimated to be valued at USD 18.7 billion in 2025.
The market size for the patient recliners market is projected to reach USD 40.7 billion by 2035.
The patient recliners market is expected to grow at a 8.1% CAGR between 2025 and 2035.
The key product types in patient recliners market are cardiac care recliners, bariatric recliners, patient room/lounge recliners and others.
In terms of end user, hospitals segment to command 41.8% share in the patient recliners market in 2025.


Full Research Suite comprises of:
Market outlook & trends analysis
Interviews & case studies
Strategic recommendations
Vendor profiles & capabilities analysis
5-year forecasts
8 regions and 60+ country-level data splits
Market segment data splits
12 months of continuous data updates
DELIVERED AS:
PDF EXCEL ONLINE
Patient-Controlled Analgesia Pumps Market Size and Share Forecast Outlook 2025 to 2035
Patient Transportation Market Size and Share Forecast Outlook 2025 to 2035
Patient Handling Equipment Market Size and Share Forecast Outlook 2025 to 2035
Patient Monitoring System Market Size and Share Forecast Outlook 2025 to 2035
Patient Positioning Equipment Market Size and Share Forecast Outlook 2025 to 2035
Patient Monitoring Accessories Market Size and Share Forecast Outlook 2025 to 2035
Patient Self-Service Kiosks Market Size and Share Forecast Outlook 2025 to 2035
Patient Monitoring Devices Market Size and Share Forecast Outlook 2025 to 2035
Patient Transport Services Market Size and Share Forecast Outlook 2025 to 2035
Patient Engagement Platforms Market Size and Share Forecast Outlook 2025 to 2035
Patient Registry Software Market Size and Share Forecast Outlook 2025 to 2035
Patient Positioning System Analysis by Product Type and by End User through 2035
Patient Lateral Transfer Market - Innovations, Demand & Forecast 2035
Patient Identification Wristbands Market Analysis – Size, Trends & Forecast 2025 to 2035
Patient Hygiene Aids Market – Demand & Forecast 2024 to 2034
Patient Portal Market – Growth & Forecast 2024-2034
Patient-Controlled Injectors Market
Patient Health Management Market
Patient Monitoring Pods Market
Outpatient Clinics Market Trends and Forecast 2025 to 2035

Thank you!
You will receive an email from our Business Development Manager. Please be sure to check your SPAM/JUNK folder too.
Chat With
MaRIA