Reports

- Global Locations -

Headquarters

Future Market Insights, Inc.

Christiana Corporate, 200
Continental Drive, Suite 401,
Newark, Delaware - 19713,
United States

T: +1-845-579-5705

Americas

Future Market Insights, Inc.

616 Corporate Way, Suite 2-9018,
Valley Cottage, NY 10989, United States

T: +1-347-918-3531

MEA

Future Market Insights

1602-6 Jumeirah Bay X2 Tower, Plot No: JLT-PH2-X2A,
Jumeirah Lakes Towers, Dubai,
United Arab Emirates

Europe

Future Market Insights

3rd Floor, 207 Regent Street,
W1B 3HH London
United Kingdom

T: + 44 (0) 20 8123 9659
D: +44 (0) 20 3287 4268

Asia Pacific

Future Market Insights

IndiaLand Global Tech Park, Unit UG-1, Behind Grand HighStreet, Phase 1, Hinjawadi, MH, Pune – 411057, India

Noise Monitoring Devices Market Snapshot (2022 to 2032)

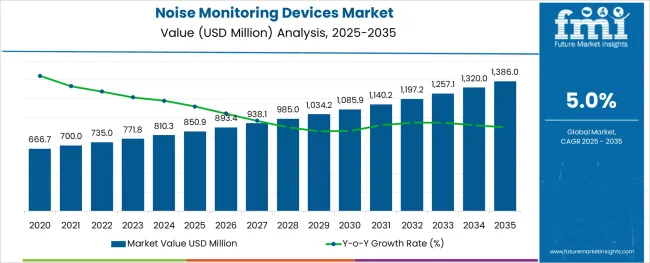
[300 Pages Report] The global noise monitoring devices market is expected to be valued at US$ 735 Million in 2022. The increased need for noise monitoring devices in mining, wind farms, the petroleum sector, and ports is expected to propel the noise monitoring devices market forward. The overall demand for noise monitoring devices is projected to grow at a CAGR of 5% between 2022 and 2032, totaling around US$ 1,198 Million by 2032.

Data Points Key Statistics
Noise Monitoring Devices Market Value 2022 US$ 735 Million
Noise Monitoring Devices Market Projected Value (2032) US$ 1198 Million
Noise Monitoring Devices Market CAGR (2022 to 2032) 5%

Noise monitoring devices are devices that measure the amount of noise in various applications such as industry, hospitals, and others. These gadgets aid in the reduction of noise-related health concerns in the workplace.

The burgeoning occupational hearing impairment in industries, stringent government policies, demand for reducing noise pollution in urban areas, need for noise monitoring devices at airports to optimize profit and capacity, rising installation of all-in-one environmental monitoring solutions, and requirement of noise monitoring infrastructures in mining, wind plants, petrochemical industry, and harbor.

Don't pay for what you don't need

Customize your report by selecting specific countries or regions and save 30%!

Noise Monitoring Devices Demand Analysis (2017 to 2021) Vs Market Outlook (2022 to 2032)

The global demand for noise monitoring devices is projected to increase at a CAGR of 3.7% during the forecast period between 2022 and 2032, reaching a total of US$ 2.63 Million in 2032, according to a report from Future Market Insights (FMI). From 2017 to 2021, sales witnessed significant growth, registering a CAGR of 1.6%.

The high prevalence of occupational hearing loss is propelling the growth of the noise monitoring devices Market. Hearing loss is ranked as the world's fourth most severe handicap. This element contributes to a growing global awareness of the growing need for accessible hearing care.

According to the estimates, there are presently over 466 million individuals worldwide who suffer from hearing loss. Rising worker safety concerns in industries such as oil and gas, mining, chemical, healthcare, transportation, and other industrial sectors are driving noise monitoring devices trends. The rising occurrence of industrial injuries is one of the world's significant issues today.

Which Drivers underpin Noise Monitoring Devices Industry Expansion?

Upgrading Of All the Major Enterprises to Accelerate the Market Growth

The global market for noise monitoring devices is expanding rapidly. The noise monitoring devices market offers several advantages for measuring and managing noise levels. The upgrading of all the major enterprises is what drives the market. Furthermore, in the industry, there are continual momentum games that influence the market with innovative technology.

The global market for noise monitoring devices is rapidly expanding. The videos of Portuguese data existing in the noise monitoring devices market have the greatest CAGR, which is predicted to expand further in South Asia in the next years. The use of ethernet and cellular communication removal data storage devices weather sensors interface AC battery or solar power, and other technologies are growing. All of this implies an increase in demand for the noise monitoring devices market.

Sudip Saha
Sudip Saha

Principal Consultant

Talk to Analyst

Find your sweet spots for generating winning opportunities in this market.

Which Factors are limiting the Growth of Noise Monitoring Devices Market?

A Lack of Enforcement of Effective Legislation Implementation in Emerging Nations to Restrain the Market Growth

The primary factors inhibiting the growth of the noise monitoring device market are workplace carelessness and a lack of enforcement of effective legislation implementation in emerging nations.

Region-wise Insights

Will North America Continue Dominance in the Global Noise Monitoring Devices Market?

Increasing Workplace Hearing Impairment Incidences to Fuel the Market Growth
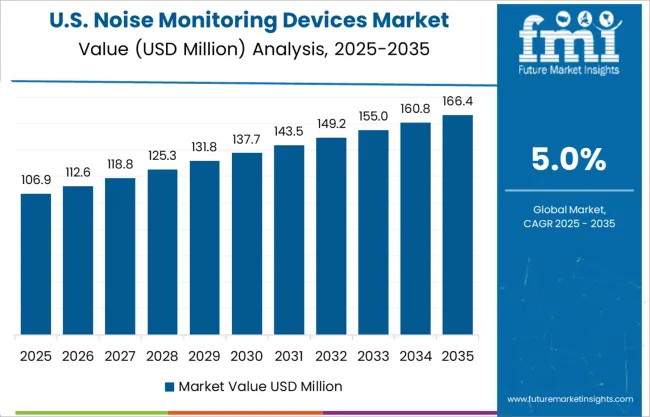
The noise monitoring devices market in North America is expected to accumulate the highest market share of 28.9% in 2022. North America will dominate the noise monitoring device market from 2022 to 2032.

Increasing workplace hearing impairment incidences in industrial areas, imposition of stringent government rules and norms related to noise pollution, demand for reducing noise pollution in private property areas, and need for customized noise monitoring devices & software for retail users are the major factors driving the market's growth in the North American region.

Where does the growth of the Noise Monitoring Devices Market in Asia-Pacific stand?

Rising Noise Pollution in the Region to Fuel Market Growth

The noise monitoring devices market in Asia-Pacific is expected to accumulate a significant market share of 13% in 2022 and is expected to continue to maintain the trend over the forecast period as well.

During the forecast period, the Asia Pacific region is predicted to be the fastest-expanding sector in the noise monitoring devices market. Rising noise pollution and increased government pressure to regulate noise pollution are the primary drivers driving the APAC region's growth.

How Will the Growth of the Noise Monitoring Devices Market unfold in Europe?

Presence of Major Key Players in the Region to Widen Prospects
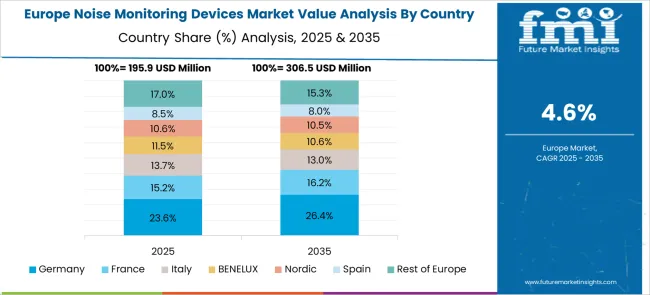
The noise monitoring devices market in Europe is expected to accumulate a market share value of 21.7% in 2022. Over the projected period, Europe's noise monitoring device market is predicted to dominate the industry.

The presence of key industry players characterizes the expansion of the sector. The European government is quite strict on noise policies. To avoid significant penalties, businesses in this region must maintain and monitor noise levels on a regular basis.

Get the data you need at a Fraction of the cost

Personalize your report by choosing insights you need
and save 40%!

Category-wise Insights

By Vertical Application, which Noise Monitoring Devices Category dominates the Market?

The Industries Vertical Application Segment to Drive the Noise Monitoring Devices Market

The noise monitoring devices market is segmented by vertical application in railways applications, airports applications, recreational areas applications, industries applications, hospitals applications, residential areas applications, construction sites applications, road traffic applications, commercial applications, and other applications.

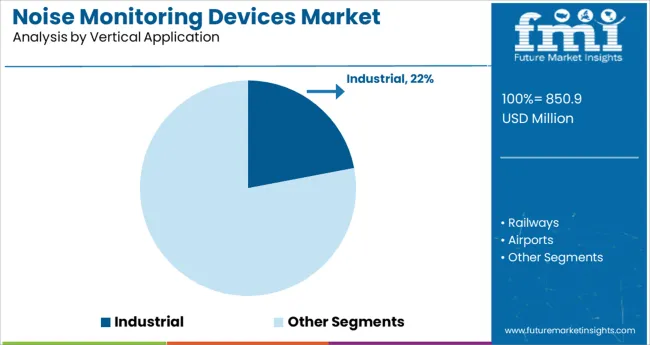
From 2022 to 2032, the noise monitoring devices market for industrial applications is predicted to develop at the fastest rate. The cause for this rapid expansion is the rising adoption of noise monitoring regulations by businesses all over the world. The government's increasing emphasis on public health and safety has compelled enterprises to control factory noise and offer adequate noise-reducing equipment to personnel working in high-noise zones. This has also broadened the market for noise monitoring devices.

The Start-up Ecosystem: How key Players are opening Frontiers for Future Growth?

With growing noise pollution and government restriction, it has become really important to keep tabs on the noise levels around us. Hence, demand for noise monitoring devices is increasing and to meet the demand the market has ample new start-ups, some of which are mentioned below:
  • Sonic-Shield, established in the United States, offers acoustic testing and analysis services to the construction, automotive, and aerospace sectors, among others. The startup provides acoustical camera testing, OSHA noise compliance, and noise and vibration level testing and analysis. Sonic-Shield also performs community noise assessments to evaluate outside noise emission levels, as well as interior acoustic quality testing to determine optimal sound characteristics in conference rooms, auditoriums, and theatres.
  • Acoufelt, an Australian firm, creates acoustic design solutions to reduce noise in working, learning, and living settings. With noise-absorbing materials, the firm develops the Making Quiet product range. To mitigate noise pollution, Acoufelt uses high-precision color painting on wall panels and vertically strung ceiling baffles.
  • DeNoize, a Dutch firm, develops smart window solutions to fight noise pollution in commercial and residential buildings. The firm provides a low-cost noise-canceling kit that is compatible with most window types and sizes and improves noise attenuation. The smart window system includes sensors that measure sound signals and a glass façade that reduces exterior noise while amplifying natural sounds.
  • QuietStar, a British firm, provides noise management solutions for industrial settings. The company creates both permanent and temporary noise-canceling solutions, such as acoustic barriers and enclosures. QuietStar creates soundproofing solutions for industries, heavy machinery, and mechanical plants. These techniques lessen the impact of noise pollution on adjacent residents and employees at industrial sites.
  • A-Cloud, a French firm, provides soundproofing solutions for nurseries, coworking spaces, and restaurants. The company is working on a low-weight, cloud-shaped sound-absorbing device for various types of ceilings. A- Cloud's solutions boost workplace productivity, keep noisy customers at bay in a restaurant, and help youngsters relax after a long day of play.

Who are the Leading Players in the Noise Monitoring Devices Market?

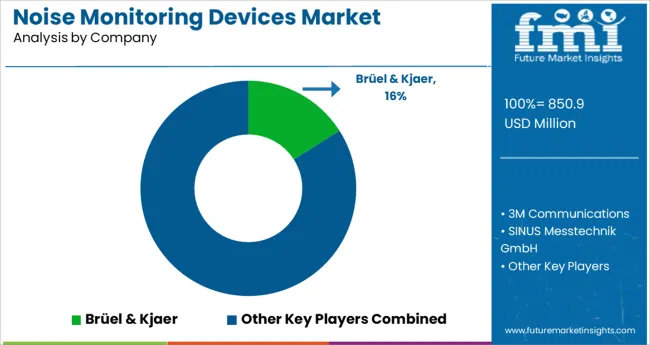
Prominent players in the noise monitoring devices market are Honeywell International Inc., Casella Inc., FLIR Systems, RION Co. Ltd., CESVA INSTRUMENTS SLU, ACOEM Group, Pulsar Instruments, SKF Group, PCE Instruments, Brüel & Kjaer, Cirrus Research Plc, NTi Audio, Larson Davis, Svantek, and KIMO are among others.

Recent Developments

  • In May 2021, Teledyne Technologies Incorporated announced that the purchase of FLIR Systems, Inc. was completed successfully. Shareholders authorized and accepted merger proposals pertaining to the Agreement and Plan of Merger dated January 4, 2021, at each company's special meeting of stockholders held on May 13, 2021. FLIR will now be part of Teledyne's Digital Imaging business and will be known as Teledyne FLIR.

Report Scope

Report Attribute Details
Growth Rate CAGR of 5% from 2022 to 2032
Market Value in 2022 US$ 735 Million
Market Value in 2032 US$ 1,198 Million
Base Year for Estimation 2021
Historical Data 2016 to 2021
Forecast Period 2022 to 2032
Quantitative Units Revenue in US$ Million and CAGR from 2022 to 2032
Report Coverage Revenue Forecast, Company Ranking, Competitive Landscape, Growth Factors, Trends, and Pricing Analysis
Segments Covered
  • Vertical Application
  • Component
  • Connectivity
  • Type of Noise
  • Region
Regions Covered
  • North America
  • Latin America
  • Europe
  • Asia Pacific
  • Middle East and Africa
Key Countries Profiled
  • The USA
  • Canada
  • Brazil
  • Mexico
  • Germany
  • The United Kingdom
  • France
  • Spain
  • Italy
  • China
  • Japan
  • South Korea
  • Malaysia
  • Singapore
  • Australia
  • GCC Countries
  • South Africa
  • Israel
Key Companies Profiled
  • 3M Communications
  • SINUS Messtechnik GmbH
  • Honeywell International Inc.
  • Casella Inc.
  • Forward Looking InfraRed (FLIR) Systems
  • RION Co. Ltd.
  • CESVA INSTRUMENTS SLU
  • ACOEM Group
  • Pulsar Instruments
  • SKF Group (Svenska Kullagerfabriken)
  • PCE Instruments
  • Brüel & Kjaer
  • Cirrus Research Plc.
  • NTi Audio (New Technologies in Audio)
  • Larson Davis
  • Savntek
  • Kommunernes International Miljoorganisation (KIMO)

Key Segments Covered in the Noise Monitoring Devices Industry Analysis

Noise Monitoring Devices Market by Vertical Application:

  • Noise Monitoring Devices for Railways
  • Noise Monitoring Devices for Airports
  • Noise Monitoring Devices for Recreational Areas
  • Noise Monitoring Devices for Industries
  • Noise Monitoring Devices for Hospitals
  • Noise Monitoring Devices for Residential Areas
  • Noise Monitoring Devices for Construction Sites
  • Noise Monitoring Devices for Road Traffic
  • Noise Monitoring Devices for Commercial Applications
  • Noise Monitoring Devices for Other Applications

Noise Monitoring Devices Market by Component:

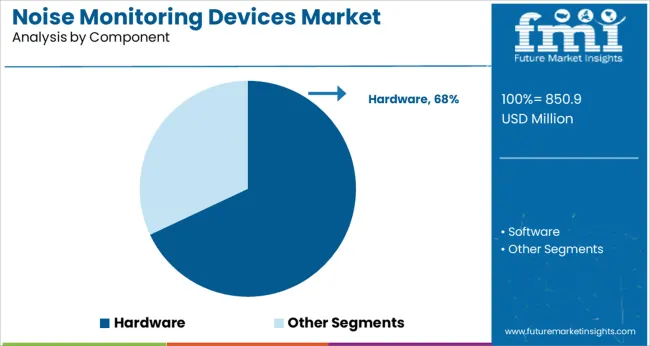
  • Noise Monitoring Hardware
  • Noise Monitoring Software

Noise Monitoring Devices Market by Connectivity:

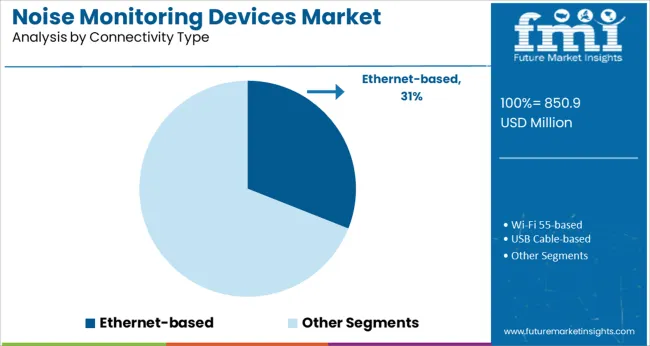
  • Ethernet-based Noise Monitoring Devices
  • Wi-Fi 55-based Noise Monitoring Devices
  • USB Cable-based Noise Monitoring Devices
  • Cellular-based Noise Monitoring Devices

Noise Monitoring Devices Market by Type of Noise:

  • Class 1 Standard Noise Monitoring Devices 51
  • Class 2 Standard Noise Monitoring Devices 52

Noise Monitoring Devices Market by Region:

  • North America Noise Monitoring Devices Market
  • Latin America Noise Monitoring Devices Market
  • Europe Noise Monitoring Devices Market
  • Asia Pacific Noise Monitoring Devices Market
  • Middle East and Africa Noise Monitoring Devices Market

Frequently Asked Questions

At what value did the noise monitoring devices market close in 2022?

By 2022-end, sales of noise monitoring devices closed at a value of US$ 735 Million

What was the last 5 years value CAGR for noise monitoring devices market value?

From 2016 to 2021, noise monitoring devices demand expanded at a CAGR of 4.2%

What is the projected forecast CAGR for the noise monitoring devices industry from 2022 to 2032?

From 2022 to 2032, noise monitoring devices sales are expected to flourish at a CAGR of 5%

According to FMI, what is the anticipated market value for noise monitoring devices in 2032?

By 2032, the market value of noise monitoring devices is expected to reach US$ 1,198 Million

Table of Content

1. Executive Summary | Noise Monitoring Devices Market

    1.1. Global Market Outlook

    1.2. Demand-side Trends

    1.3. Supply-side Trends

    1.4. Technology Roadmap Analysis

    1.5. Analysis and Recommendations

2. Market Overview

    2.1. Market Coverage / Taxonomy

    2.2. Market Definition / Scope / Limitations

3. Market Background

    3.1. Market Dynamics

        3.1.1. Drivers

        3.1.2. Restraints

        3.1.3. Opportunity

        3.1.4. Trends

    3.2. Scenario Forecast

        3.2.1. Demand in Optimistic Scenario

        3.2.2. Demand in Likely Scenario

        3.2.3. Demand in Conservative Scenario

    3.3. Opportunity Map Analysis

    3.4. Investment Feasibility Matrix

    3.5. PESTLE and Porter’s Analysis

    3.6. Regulatory Landscape

        3.6.1. By Key Regions

        3.6.2. By Key Countries

    3.7. Regional Parent Market Outlook

4. Global Market Analysis 2016 to 2021 and Forecast, 2022 to 2032

    4.1. Historical Market Size Value (US$ million) Analysis, 2016 to 2021

    4.2. Current and Future Market Size Value (US$ million) Projections, 2022 to 2032

        4.2.1. Y-o-Y Growth Trend Analysis

        4.2.2. Absolute $ Opportunity Analysis

5. Global Market Analysis 2016 to 2021 and Forecast 2022 to 2032, By Vertical Application

    5.1. Introduction / Key Findings

    5.2. Historical Market Size Value (US$ million) Analysis By Vertical application, 2016 to 2021

    5.3. Current and Future Market Size Value (US$ million) Analysis and Forecast By Vertical application, 2022 to 2032

        5.3.1. Railways

        5.3.2. Airports

        5.3.3. Recreational Areas

        5.3.4. Industries

        5.3.5. Hospitals

        5.3.6. Residential Areas

        5.3.7. Construction Sites

        5.3.8. Road Traffic

        5.3.9. Commercial

        5.3.10. Others

    5.4. Y-o-Y Growth Trend Analysis By Vertical application, 2016 to 2021

    5.5. Absolute $ Opportunity Analysis By Vertical application, 2022 to 2032

6. Global Market Analysis 2016 to 2021 and Forecast 2022 to 2032, By Component

    6.1. Introduction / Key Findings

    6.2. Historical Market Size Value (US$ million) Analysis By Component, 2016 to 2021

    6.3. Current and Future Market Size Value (US$ million) Analysis and Forecast By Component, 2022 to 2032

        6.3.1. Hardware

        6.3.2. Software

    6.4. Y-o-Y Growth Trend Analysis By Component, 2016 to 2021

    6.5. Absolute $ Opportunity Analysis By Component, 2022 to 2032

7. Global Market Analysis 2016 to 2021 and Forecast 2022 to 2032, By Connectivity

    7.1. Introduction / Key Findings

    7.2. Historical Market Size Value (US$ million) Analysis By Connectivity, 2016 to 2021

    7.3. Current and Future Market Size Value (US$ million) Analysis and Forecast By Connectivity, 2022 to 2032

        7.3.1. ETHERNET

        7.3.2. WI-FI 55

        7.3.3. USB CABLE

        7.3.4. CELLULAR

    7.4. Y-o-Y Growth Trend Analysis By Connectivity, 2016 to 2021

    7.5. Absolute $ Opportunity Analysis By Connectivity, 2022 to 2032

8. Global Market Analysis 2016 to 2021 and Forecast 2022 to 2032, By Type of Noise

    8.1. Introduction / Key Findings

    8.2. Historical Market Size Value (US$ million) Analysis By Type for Noise, 2016 to 2021

    8.3. Current and Future Market Size Value (US$ million) Analysis and Forecast By Type for Noise, 2022 to 2032

        8.3.1. Class 1 Standard Devices 51

        8.3.2. Class 2 Standard Devices 52

    8.4. Y-o-Y Growth Trend Analysis By Type for Noise, 2016 to 2021

    8.5. Absolute $ Opportunity Analysis By Type for Noise, 2022 to 2032

9. Global Market Analysis 2016 to 2021 and Forecast 2022 to 2032, By Region

    9.1. Introduction

    9.2. Historical Market Size Value (US$ million) Analysis By Region, 2016 to 2021

    9.3. Current Market Size Value (US$ million) Analysis and Forecast By Region, 2022 to 2032

        9.3.1. North America

        9.3.2. Latin America

        9.3.3. Europe

        9.3.4. Asia Pacific

        9.3.5. MEA

    9.4. Market Attractiveness Analysis By Region

10. North America Market Analysis 2016 to 2021 and Forecast 2022 to 2032, By Country

    10.1. Historical Market Size Value (US$ million) Trend Analysis By Market Taxonomy, 2016 to 2021

    10.2. Market Size Value (US$ million) Forecast By Market Taxonomy, 2022 to 2032

        10.2.1. By Country

            10.2.1.1. The USA

            10.2.1.2. Canada

        10.2.2. By Vertical application

        10.2.3. By Component

        10.2.4. By Connectivity

        10.2.5. By Type for Noise

    10.3. Market Attractiveness Analysis

        10.3.1. By Country

        10.3.2. By Vertical application

        10.3.3. By Component

        10.3.4. By Connectivity

        10.3.5. By Type for Noise

    10.4. Key Takeaways

11. Latin America Market Analysis 2016 to 2021 and Forecast 2022 to 2032, By Country

    11.1. Historical Market Size Value (US$ million) Trend Analysis By Market Taxonomy, 2016 to 2021

    11.2. Market Size Value (US$ million) Forecast By Market Taxonomy, 2022 to 2032

        11.2.1. By Country

            11.2.1.1. Brazil

            11.2.1.2. Mexico

            11.2.1.3. Rest of Latin America

        11.2.2. By Vertical application

        11.2.3. By Component

        11.2.4. By Connectivity

        11.2.5. By Type for Noise

    11.3. Market Attractiveness Analysis

        11.3.1. By Country

        11.3.2. By Vertical application

        11.3.3. By Component

        11.3.4. By Connectivity

        11.3.5. By Type for Noise

    11.4. Key Takeaways

12. Europe Market Analysis 2016 to 2021 and Forecast 2022 to 2032, By Country

    12.1. Historical Market Size Value (US$ million) Trend Analysis By Market Taxonomy, 2016 to 2021

    12.2. Market Size Value (US$ million) Forecast By Market Taxonomy, 2022 to 2032

        12.2.1. By Country

            12.2.1.1. Germany

            12.2.1.2. The United Kingdom

            12.2.1.3. France

            12.2.1.4. Spain

            12.2.1.5. Italy

            12.2.1.6. Rest of Europe

        12.2.2. By Vertical application

        12.2.3. By Component

        12.2.4. By Connectivity

        12.2.5. By Type for Noise

    12.3. Market Attractiveness Analysis

        12.3.1. By Country

        12.3.2. By Vertical application

        12.3.3. By Component

        12.3.4. By Connectivity

        12.3.5. By Type for Noise

    12.4. Key Takeaways

13. Asia Pacific Market Analysis 2016 to 2021 and Forecast 2022 to 2032, By Country

    13.1. Historical Market Size Value (US$ million) Trend Analysis By Market Taxonomy, 2016 to 2021

    13.2. Market Size Value (US$ million) Forecast By Market Taxonomy, 2022 to 2032

        13.2.1. By Country

            13.2.1.1. China

            13.2.1.2. Japan

            13.2.1.3. South Korea

            13.2.1.4. Malaysia

            13.2.1.5. Singapore

            13.2.1.6. Australia

            13.2.1.7. Rest of Asia Pacific

        13.2.2. By Vertical application

        13.2.3. By Component

        13.2.4. By Connectivity

        13.2.5. By Type for Noise

    13.3. Market Attractiveness Analysis

        13.3.1. By Country

        13.3.2. By Vertical application

        13.3.3. By Component

        13.3.4. By Connectivity

        13.3.5. By Type for Noise

    13.4. Key Takeaways

14. MEA Market Analysis 2016 to 2021 and Forecast 2022 to 2032, By Country

    14.1. Historical Market Size Value (US$ million) Trend Analysis By Market Taxonomy, 2016 to 2021

    14.2. Market Size Value (US$ million) Forecast By Market Taxonomy, 2022 to 2032

        14.2.1. By Country

            14.2.1.1. GCC Countries

            14.2.1.2. South Africa

            14.2.1.3. Israel

            14.2.1.4. Rest of MEA

        14.2.2. By Vertical application

        14.2.3. By Component

        14.2.4. By Connectivity

        14.2.5. By Type for Noise

    14.3. Market Attractiveness Analysis

        14.3.1. By Country

        14.3.2. By Vertical application

        14.3.3. By Component

        14.3.4. By Connectivity

        14.3.5. By Type for Noise

    14.4. Key Takeaways

15. Key Countries Market Analysis

    15.1. The United Kingdom

        15.1.1. Pricing Analysis

        15.1.2. Market Share Analysis, 2021

            15.1.2.1. By Vertical application

            15.1.2.2. By Component

            15.1.2.3. By Connectivity

            15.1.2.4. By Type for Noise

    15.2. Canada

        15.2.1. Pricing Analysis

        15.2.2. Market Share Analysis, 2021

            15.2.2.1. By Vertical application

            15.2.2.2. By Component

            15.2.2.3. By Connectivity

            15.2.2.4. By Type for Noise

    15.3. Brazil

        15.3.1. Pricing Analysis

        15.3.2. Market Share Analysis, 2021

            15.3.2.1. By Vertical application

            15.3.2.2. By Component

            15.3.2.3. By Connectivity

            15.3.2.4. By Type for Noise

    15.4. Mexico

        15.4.1. Pricing Analysis

        15.4.2. Market Share Analysis, 2021

            15.4.2.1. By Vertical application

            15.4.2.2. By Component

            15.4.2.3. By Connectivity

            15.4.2.4. By Type for Noise

    15.5. Rest of Latin America

        15.5.1. Pricing Analysis

        15.5.2. Market Share Analysis, 2021

            15.5.2.1. By Vertical application

            15.5.2.2. By Component

            15.5.2.3. By Connectivity

            15.5.2.4. By Type for Noise

    15.6. Germany

        15.6.1. Pricing Analysis

        15.6.2. Market Share Analysis, 2021

            15.6.2.1. By Vertical application

            15.6.2.2. By Component

            15.6.2.3. By Connectivity

            15.6.2.4. By Type for Noise

    15.7. The United Kingdom

        15.7.1. Pricing Analysis

        15.7.2. Market Share Analysis, 2021

            15.7.2.1. By Vertical application

            15.7.2.2. By Component

            15.7.2.3. By Connectivity

            15.7.2.4. By Type for Noise

    15.8. France

        15.8.1. Pricing Analysis

        15.8.2. Market Share Analysis, 2021

            15.8.2.1. By Vertical application

            15.8.2.2. By Component

            15.8.2.3. By Connectivity

            15.8.2.4. By Type for Noise

    15.9. Spain

        15.9.1. Pricing Analysis

        15.9.2. Market Share Analysis, 2021

            15.9.2.1. By Vertical application

            15.9.2.2. By Component

            15.9.2.3. By Connectivity

            15.9.2.4. By Type for Noise

    15.10. Italy

        15.10.1. Pricing Analysis

        15.10.2. Market Share Analysis, 2021

            15.10.2.1. By Vertical application

            15.10.2.2. By Component

            15.10.2.3. By Connectivity

            15.10.2.4. By Type for Noise

    15.11. Rest of Europe

        15.11.1. Pricing Analysis

        15.11.2. Market Share Analysis, 2021

            15.11.2.1. By Vertical application

            15.11.2.2. By Component

            15.11.2.3. By Connectivity

            15.11.2.4. By Type for Noise

    15.12. China

        15.12.1. Pricing Analysis

        15.12.2. Market Share Analysis, 2021

            15.12.2.1. By Vertical application

            15.12.2.2. By Component

            15.12.2.3. By Connectivity

            15.12.2.4. By Type for Noise

    15.13. Japan

        15.13.1. Pricing Analysis

        15.13.2. Market Share Analysis, 2021

            15.13.2.1. By Vertical application

            15.13.2.2. By Component

            15.13.2.3. By Connectivity

            15.13.2.4. By Type for Noise

    15.14. South Korea

        15.14.1. Pricing Analysis

        15.14.2. Market Share Analysis, 2021

            15.14.2.1. By Vertical application

            15.14.2.2. By Component

            15.14.2.3. By Connectivity

            15.14.2.4. By Type for Noise

    15.15. Malaysia

        15.15.1. Pricing Analysis

        15.15.2. Market Share Analysis, 2021

            15.15.2.1. By Vertical application

            15.15.2.2. By Component

            15.15.2.3. By Connectivity

            15.15.2.4. By Type for Noise

    15.16. Singapore

        15.16.1. Pricing Analysis

        15.16.2. Market Share Analysis, 2021

            15.16.2.1. By Vertical application

            15.16.2.2. By Component

            15.16.2.3. By Connectivity

            15.16.2.4. By Type for Noise

    15.17. Australia

        15.17.1. Pricing Analysis

        15.17.2. Market Share Analysis, 2021

            15.17.2.1. By Vertical application

            15.17.2.2. By Component

            15.17.2.3. By Connectivity

            15.17.2.4. By Type for Noise

    15.18. Rest of Asia Pacific

        15.18.1. Pricing Analysis

        15.18.2. Market Share Analysis, 2021

            15.18.2.1. By Vertical application

            15.18.2.2. By Component

            15.18.2.3. By Connectivity

            15.18.2.4. By Type for Noise

    15.19. GCC Countries

        15.19.1. Pricing Analysis

        15.19.2. Market Share Analysis, 2021

            15.19.2.1. By Vertical application

            15.19.2.2. By Component

            15.19.2.3. By Connectivity

            15.19.2.4. By Type for Noise

    15.20. South Africa

        15.20.1. Pricing Analysis

        15.20.2. Market Share Analysis, 2021

            15.20.2.1. By Vertical application

            15.20.2.2. By Component

            15.20.2.3. By Connectivity

            15.20.2.4. By Type for Noise

    15.21. Israel

        15.21.1. Pricing Analysis

        15.21.2. Market Share Analysis, 2021

            15.21.2.1. By Vertical application

            15.21.2.2. By Component

            15.21.2.3. By Connectivity

            15.21.2.4. By Type for Noise

    15.22. Rest of Middle East and Africa (MEA)

        15.22.1. Pricing Analysis

        15.22.2. Market Share Analysis, 2021

            15.22.2.1. By Vertical application

            15.22.2.2. By Component

            15.22.2.3. By Connectivity

            15.22.2.4. By Type for Noise

16. Market Structure Analysis

    16.1. Competition Dashboard

    16.2. Competition Benchmarking

    16.3. Market Share Analysis of Top Players

        16.3.1. By Regional

        16.3.2. By Vertical application

        16.3.3. By Component

        16.3.4. By Connectivity

        16.3.5. By Type for Noise

17. Competition Analysis

    17.1. Competition Deep Dive

        17.1.1. 3M Communications

            17.1.1.1. Overview

            17.1.1.2. Product Portfolio

            17.1.1.3. Profitability by Market Segments

            17.1.1.4. Sales Footprint

            17.1.1.5. Strategy Overview

                17.1.1.5.1. Marketing Strategy

        17.1.2. SINUS Messtechnik GmbH

            17.1.2.1. Overview

            17.1.2.2. Product Portfolio

            17.1.2.3. Profitability by Market Segments

            17.1.2.4. Sales Footprint

            17.1.2.5. Strategy Overview

                17.1.2.5.1. Marketing Strategy

        17.1.3. Honeywell International Inc.

            17.1.3.1. Overview

            17.1.3.2. Product Portfolio

            17.1.3.3. Profitability by Market Segments

            17.1.3.4. Sales Footprint

            17.1.3.5. Strategy Overview

                17.1.3.5.1. Marketing Strategy

        17.1.4. Casella Inc.

            17.1.4.1. Overview

            17.1.4.2. Product Portfolio

            17.1.4.3. Profitability by Market Segments

            17.1.4.4. Sales Footprint

            17.1.4.5. Strategy Overview

                17.1.4.5.1. Marketing Strategy

        17.1.5. FLIR Systems

            17.1.5.1. Overview

            17.1.5.2. Product Portfolio

            17.1.5.3. Profitability by Market Segments

            17.1.5.4. Sales Footprint

            17.1.5.5. Strategy Overview

                17.1.5.5.1. Marketing Strategy

        17.1.6. RION Co. Ltd.

            17.1.6.1. Overview

            17.1.6.2. Product Portfolio

            17.1.6.3. Profitability by Market Segments

            17.1.6.4. Sales Footprint

            17.1.6.5. Strategy Overview

                17.1.6.5.1. Marketing Strategy

        17.1.7. CESVA INSTRUMENTS SLU

            17.1.7.1. Overview

            17.1.7.2. Product Portfolio

            17.1.7.3. Profitability by Market Segments

            17.1.7.4. Sales Footprint

            17.1.7.5. Strategy Overview

                17.1.7.5.1. Marketing Strategy

        17.1.8. ACOEM Group

            17.1.8.1. Overview

            17.1.8.2. Product Portfolio

            17.1.8.3. Profitability by Market Segments

            17.1.8.4. Sales Footprint

            17.1.8.5. Strategy Overview

                17.1.8.5.1. Marketing Strategy

        17.1.9. Pulsar Instruments

            17.1.9.1. Overview

            17.1.9.2. Product Portfolio

            17.1.9.3. Profitability by Market Segments

            17.1.9.4. Sales Footprint

            17.1.9.5. Strategy Overview

                17.1.9.5.1. Marketing Strategy

        17.1.10. SKF Group

            17.1.10.1. Overview

            17.1.10.2. Product Portfolio

            17.1.10.3. Profitability by Market Segments

            17.1.10.4. Sales Footprint

            17.1.10.5. Strategy Overview

                17.1.10.5.1. Marketing Strategy

        17.1.11. PCE Instruments

            17.1.11.1. Overview

            17.1.11.2. Product Portfolio

            17.1.11.3. Profitability by Market Segments

            17.1.11.4. Sales Footprint

            17.1.11.5. Strategy Overview

                17.1.11.5.1. Marketing Strategy

        17.1.12. Brüel & Kjaer

            17.1.12.1. Overview

            17.1.12.2. Product Portfolio

            17.1.12.3. Profitability by Market Segments

            17.1.12.4. Sales Footprint

            17.1.12.5. Strategy Overview

                17.1.12.5.1. Marketing Strategy

        17.1.13. Cirrus Research Plc

            17.1.13.1. Overview

            17.1.13.2. Product Portfolio

            17.1.13.3. Profitability by Market Segments

            17.1.13.4. Sales Footprint

            17.1.13.5. Strategy Overview

                17.1.13.5.1. Marketing Strategy

        17.1.14. NTi Audio

            17.1.14.1. Overview

            17.1.14.2. Product Portfolio

            17.1.14.3. Profitability by Market Segments

            17.1.14.4. Sales Footprint

            17.1.14.5. Strategy Overview

                17.1.14.5.1. Marketing Strategy

        17.1.15. Larson Davis

            17.1.15.1. Overview

            17.1.15.2. Product Portfolio

            17.1.15.3. Profitability by Market Segments

            17.1.15.4. Sales Footprint

            17.1.15.5. Strategy Overview

                17.1.15.5.1. Marketing Strategy

        17.1.16. Svantek

            17.1.16.1. Overview

            17.1.16.2. Product Portfolio

            17.1.16.3. Profitability by Market Segments

            17.1.16.4. Sales Footprint

            17.1.16.5. Strategy Overview

                17.1.16.5.1. Marketing Strategy

        17.1.17. KIMO

            17.1.17.1. Overview

            17.1.17.2. Product Portfolio

            17.1.17.3. Profitability by Market Segments

            17.1.17.4. Sales Footprint

            17.1.17.5. Strategy Overview

                17.1.17.5.1. Marketing Strategy

18. Assumptions & Acronyms Used

19. Research Methodology

List of Tables

Table 1: Global Market Value (US$ million) Forecast by Region, 2016 to 2032

Table 2: Global Market Value (US$ million) Forecast by Vertical application, 2016 to 2032

Table 3: Global Market Value (US$ million) Forecast by Component, 2016 to 2032

Table 4: Global Market Value (US$ million) Forecast by Connectivity, 2016 to 2032

Table 5: Global Market Value (US$ million) Forecast by Type for Noise, 2016 to 2032

Table 6: North America Market Value (US$ million) Forecast by Country, 2016 to 2032

Table 7: North America Market Value (US$ million) Forecast by Vertical application, 2016 to 2032

Table 8: North America Market Value (US$ million) Forecast by Component, 2016 to 2032

Table 9: North America Market Value (US$ million) Forecast by Connectivity, 2016 to 2032

Table 10: North America Market Value (US$ million) Forecast by Type for Noise, 2016 to 2032

Table 11: Latin America Market Value (US$ million) Forecast by Country, 2016 to 2032

Table 12: Latin America Market Value (US$ million) Forecast by Vertical application, 2016 to 2032

Table 13: Latin America Market Value (US$ million) Forecast by Component, 2016 to 2032

Table 14: Latin America Market Value (US$ million) Forecast by Connectivity, 2016 to 2032

Table 15: Latin America Market Value (US$ million) Forecast by Type for Noise, 2016 to 2032

Table 16: Europe Market Value (US$ million) Forecast by Country, 2016 to 2032

Table 17: Europe Market Value (US$ million) Forecast by Vertical application, 2016 to 2032

Table 18: Europe Market Value (US$ million) Forecast by Component, 2016 to 2032

Table 19: Europe Market Value (US$ million) Forecast by Connectivity, 2016 to 2032

Table 20: Europe Market Value (US$ million) Forecast by Type for Noise, 2016 to 2032

Table 21: Asia Pacific Market Value (US$ million) Forecast by Country, 2016 to 2032

Table 22: Asia Pacific Market Value (US$ million) Forecast by Vertical application, 2016 to 2032

Table 23: Asia Pacific Market Value (US$ million) Forecast by Component, 2016 to 2032

Table 24: Asia Pacific Market Value (US$ million) Forecast by Connectivity, 2016 to 2032

Table 25: Asia Pacific Market Value (US$ million) Forecast by Type for Noise, 2016 to 2032

Table 26: MEA Market Value (US$ million) Forecast by Country, 2016 to 2032

Table 27: MEA Market Value (US$ million) Forecast by Vertical application, 2016 to 2032

Table 28: MEA Market Value (US$ million) Forecast by Component, 2016 to 2032

Table 29: MEA Market Value (US$ million) Forecast by Connectivity, 2016 to 2032

Table 30: MEA Market Value (US$ million) Forecast by Type for Noise, 2016 to 2032

List of Charts

Figure 1: Global Market Value (US$ million) by Vertical application, 2022 to 2032

Figure 2: Global Market Value (US$ million) by Component, 2022 to 2032

Figure 3: Global Market Value (US$ million) by Connectivity, 2022 to 2032

Figure 4: Global Market Value (US$ million) by Type for Noise, 2022 to 2032

Figure 5: Global Market Value (US$ million) by Region, 2022 to 2032

Figure 6: Global Market Value (US$ million) Analysis by Region, 2016 to 2032

Figure 7: Global Market Value Share (%) and BPS Analysis by Region, 2022 to 2032

Figure 8: Global Market Y-o-Y Growth (%) Projections by Region, 2022 to 2032

Figure 9: Global Market Value (US$ million) Analysis by Vertical application, 2016 to 2032

Figure 10: Global Market Value Share (%) and BPS Analysis by Vertical application, 2022 to 2032

Figure 11: Global Market Y-o-Y Growth (%) Projections by Vertical application, 2022 to 2032

Figure 12: Global Market Value (US$ million) Analysis by Component, 2016 to 2032

Figure 13: Global Market Value Share (%) and BPS Analysis by Component, 2022 to 2032

Figure 14: Global Market Y-o-Y Growth (%) Projections by Component, 2022 to 2032

Figure 15: Global Market Value (US$ million) Analysis by Connectivity, 2016 to 2032

Figure 16: Global Market Value Share (%) and BPS Analysis by Connectivity, 2022 to 2032

Figure 17: Global Market Y-o-Y Growth (%) Projections by Connectivity, 2022 to 2032

Figure 18: Global Market Value (US$ million) Analysis by Type for Noise, 2016 to 2032

Figure 19: Global Market Value Share (%) and BPS Analysis by Type for Noise, 2022 to 2032

Figure 20: Global Market Y-o-Y Growth (%) Projections by Type for Noise, 2022 to 2032

Figure 21: Global Market Attractiveness by Vertical application, 2022 to 2032

Figure 22: Global Market Attractiveness by Component, 2022 to 2032

Figure 23: Global Market Attractiveness by Connectivity, 2022 to 2032

Figure 24: Global Market Attractiveness by Type for Noise, 2022 to 2032

Figure 25: Global Market Attractiveness by Region, 2022 to 2032

Figure 26: North America Market Value (US$ million) by Vertical application, 2022 to 2032

Figure 27: North America Market Value (US$ million) by Component, 2022 to 2032

Figure 28: North America Market Value (US$ million) by Connectivity, 2022 to 2032

Figure 29: North America Market Value (US$ million) by Type for Noise, 2022 to 2032

Figure 30: North America Market Value (US$ million) by Country, 2022 to 2032

Figure 31: North America Market Value (US$ million) Analysis by Country, 2016 to 2032

Figure 32: North America Market Value Share (%) and BPS Analysis by Country, 2022 to 2032

Figure 33: North America Market Y-o-Y Growth (%) Projections by Country, 2022 to 2032

Figure 34: North America Market Value (US$ million) Analysis by Vertical application, 2016 to 2032

Figure 35: North America Market Value Share (%) and BPS Analysis by Vertical application, 2022 to 2032

Figure 36: North America Market Y-o-Y Growth (%) Projections by Vertical application, 2022 to 2032

Figure 37: North America Market Value (US$ million) Analysis by Component, 2016 to 2032

Figure 38: North America Market Value Share (%) and BPS Analysis by Component, 2022 to 2032

Figure 39: North America Market Y-o-Y Growth (%) Projections by Component, 2022 to 2032

Figure 40: North America Market Value (US$ million) Analysis by Connectivity, 2016 to 2032

Figure 41: North America Market Value Share (%) and BPS Analysis by Connectivity, 2022 to 2032

Figure 42: North America Market Y-o-Y Growth (%) Projections by Connectivity, 2022 to 2032

Figure 43: North America Market Value (US$ million) Analysis by Type for Noise, 2016 to 2032

Figure 44: North America Market Value Share (%) and BPS Analysis by Type for Noise, 2022 to 2032

Figure 45: North America Market Y-o-Y Growth (%) Projections by Type for Noise, 2022 to 2032

Figure 46: North America Market Attractiveness by Vertical application, 2022 to 2032

Figure 47: North America Market Attractiveness by Component, 2022 to 2032

Figure 48: North America Market Attractiveness by Connectivity, 2022 to 2032

Figure 49: North America Market Attractiveness by Type for Noise, 2022 to 2032

Figure 50: North America Market Attractiveness by Country, 2022 to 2032

Figure 51: Latin America Market Value (US$ million) by Vertical application, 2022 to 2032

Figure 52: Latin America Market Value (US$ million) by Component, 2022 to 2032

Figure 53: Latin America Market Value (US$ million) by Connectivity, 2022 to 2032

Figure 54: Latin America Market Value (US$ million) by Type for Noise, 2022 to 2032

Figure 55: Latin America Market Value (US$ million) by Country, 2022 to 2032

Figure 56: Latin America Market Value (US$ million) Analysis by Country, 2016 to 2032

Figure 57: Latin America Market Value Share (%) and BPS Analysis by Country, 2022 to 2032

Figure 58: Latin America Market Y-o-Y Growth (%) Projections by Country, 2022 to 2032

Figure 59: Latin America Market Value (US$ million) Analysis by Vertical application, 2016 to 2032

Figure 60: Latin America Market Value Share (%) and BPS Analysis by Vertical application, 2022 to 2032

Figure 61: Latin America Market Y-o-Y Growth (%) Projections by Vertical application, 2022 to 2032

Figure 62: Latin America Market Value (US$ million) Analysis by Component, 2016 to 2032

Figure 63: Latin America Market Value Share (%) and BPS Analysis by Component, 2022 to 2032

Figure 64: Latin America Market Y-o-Y Growth (%) Projections by Component, 2022 to 2032

Figure 65: Latin America Market Value (US$ million) Analysis by Connectivity, 2016 to 2032

Figure 66: Latin America Market Value Share (%) and BPS Analysis by Connectivity, 2022 to 2032

Figure 67: Latin America Market Y-o-Y Growth (%) Projections by Connectivity, 2022 to 2032

Figure 68: Latin America Market Value (US$ million) Analysis by Type for Noise, 2016 to 2032

Figure 69: Latin America Market Value Share (%) and BPS Analysis by Type for Noise, 2022 to 2032

Figure 70: Latin America Market Y-o-Y Growth (%) Projections by Type for Noise, 2022 to 2032

Figure 71: Latin America Market Attractiveness by Vertical application, 2022 to 2032

Figure 72: Latin America Market Attractiveness by Component, 2022 to 2032

Figure 73: Latin America Market Attractiveness by Connectivity, 2022 to 2032

Figure 74: Latin America Market Attractiveness by Type for Noise, 2022 to 2032

Figure 75: Latin America Market Attractiveness by Country, 2022 to 2032

Figure 76: Europe Market Value (US$ million) by Vertical application, 2022 to 2032

Figure 77: Europe Market Value (US$ million) by Component, 2022 to 2032

Figure 78: Europe Market Value (US$ million) by Connectivity, 2022 to 2032

Figure 79: Europe Market Value (US$ million) by Type for Noise, 2022 to 2032

Figure 80: Europe Market Value (US$ million) by Country, 2022 to 2032

Figure 81: Europe Market Value (US$ million) Analysis by Country, 2016 to 2032

Figure 82: Europe Market Value Share (%) and BPS Analysis by Country, 2022 to 2032

Figure 83: Europe Market Y-o-Y Growth (%) Projections by Country, 2022 to 2032

Figure 84: Europe Market Value (US$ million) Analysis by Vertical application, 2016 to 2032

Figure 85: Europe Market Value Share (%) and BPS Analysis by Vertical application, 2022 to 2032

Figure 86: Europe Market Y-o-Y Growth (%) Projections by Vertical application, 2022 to 2032

Figure 87: Europe Market Value (US$ million) Analysis by Component, 2016 to 2032

Figure 88: Europe Market Value Share (%) and BPS Analysis by Component, 2022 to 2032

Figure 89: Europe Market Y-o-Y Growth (%) Projections by Component, 2022 to 2032

Figure 90: Europe Market Value (US$ million) Analysis by Connectivity, 2016 to 2032

Figure 91: Europe Market Value Share (%) and BPS Analysis by Connectivity, 2022 to 2032

Figure 92: Europe Market Y-o-Y Growth (%) Projections by Connectivity, 2022 to 2032

Figure 93: Europe Market Value (US$ million) Analysis by Type for Noise, 2016 to 2032

Figure 94: Europe Market Value Share (%) and BPS Analysis by Type for Noise, 2022 to 2032

Figure 95: Europe Market Y-o-Y Growth (%) Projections by Type for Noise, 2022 to 2032

Figure 96: Europe Market Attractiveness by Vertical application, 2022 to 2032

Figure 97: Europe Market Attractiveness by Component, 2022 to 2032

Figure 98: Europe Market Attractiveness by Connectivity, 2022 to 2032

Figure 99: Europe Market Attractiveness by Type for Noise, 2022 to 2032

Figure 100: Europe Market Attractiveness by Country, 2022 to 2032

Figure 101: Asia Pacific Market Value (US$ million) by Vertical application, 2022 to 2032

Figure 102: Asia Pacific Market Value (US$ million) by Component, 2022 to 2032

Figure 103: Asia Pacific Market Value (US$ million) by Connectivity, 2022 to 2032

Figure 104: Asia Pacific Market Value (US$ million) by Type for Noise, 2022 to 2032

Figure 105: Asia Pacific Market Value (US$ million) by Country, 2022 to 2032

Figure 106: Asia Pacific Market Value (US$ million) Analysis by Country, 2016 to 2032

Figure 107: Asia Pacific Market Value Share (%) and BPS Analysis by Country, 2022 to 2032

Figure 108: Asia Pacific Market Y-o-Y Growth (%) Projections by Country, 2022 to 2032

Figure 109: Asia Pacific Market Value (US$ million) Analysis by Vertical application, 2016 to 2032

Figure 110: Asia Pacific Market Value Share (%) and BPS Analysis by Vertical application, 2022 to 2032

Figure 111: Asia Pacific Market Y-o-Y Growth (%) Projections by Vertical application, 2022 to 2032

Figure 112: Asia Pacific Market Value (US$ million) Analysis by Component, 2016 to 2032

Figure 113: Asia Pacific Market Value Share (%) and BPS Analysis by Component, 2022 to 2032

Figure 114: Asia Pacific Market Y-o-Y Growth (%) Projections by Component, 2022 to 2032

Figure 115: Asia Pacific Market Value (US$ million) Analysis by Connectivity, 2016 to 2032

Figure 116: Asia Pacific Market Value Share (%) and BPS Analysis by Connectivity, 2022 to 2032

Figure 117: Asia Pacific Market Y-o-Y Growth (%) Projections by Connectivity, 2022 to 2032

Figure 118: Asia Pacific Market Value (US$ million) Analysis by Type for Noise, 2016 to 2032

Figure 119: Asia Pacific Market Value Share (%) and BPS Analysis by Type for Noise, 2022 to 2032

Figure 120: Asia Pacific Market Y-o-Y Growth (%) Projections by Type for Noise, 2022 to 2032

Figure 121: Asia Pacific Market Attractiveness by Vertical application, 2022 to 2032

Figure 122: Asia Pacific Market Attractiveness by Component, 2022 to 2032

Figure 123: Asia Pacific Market Attractiveness by Connectivity, 2022 to 2032

Figure 124: Asia Pacific Market Attractiveness by Type for Noise, 2022 to 2032

Figure 125: Asia Pacific Market Attractiveness by Country, 2022 to 2032

Figure 126: MEA Market Value (US$ million) by Vertical application, 2022 to 2032

Figure 127: MEA Market Value (US$ million) by Component, 2022 to 2032

Figure 128: MEA Market Value (US$ million) by Connectivity, 2022 to 2032

Figure 129: MEA Market Value (US$ million) by Type for Noise, 2022 to 2032

Figure 130: MEA Market Value (US$ million) by Country, 2022 to 2032

Figure 131: MEA Market Value (US$ million) Analysis by Country, 2016 to 2032

Figure 132: MEA Market Value Share (%) and BPS Analysis by Country, 2022 to 2032

Figure 133: MEA Market Y-o-Y Growth (%) Projections by Country, 2022 to 2032

Figure 134: MEA Market Value (US$ million) Analysis by Vertical application, 2016 to 2032

Figure 135: MEA Market Value Share (%) and BPS Analysis by Vertical application, 2022 to 2032

Figure 136: MEA Market Y-o-Y Growth (%) Projections by Vertical application, 2022 to 2032

Figure 137: MEA Market Value (US$ million) Analysis by Component, 2016 to 2032

Figure 138: MEA Market Value Share (%) and BPS Analysis by Component, 2022 to 2032

Figure 139: MEA Market Y-o-Y Growth (%) Projections by Component, 2022 to 2032

Figure 140: MEA Market Value (US$ million) Analysis by Connectivity, 2016 to 2032

Figure 141: MEA Market Value Share (%) and BPS Analysis by Connectivity, 2022 to 2032

Figure 142: MEA Market Y-o-Y Growth (%) Projections by Connectivity, 2022 to 2032

Figure 143: MEA Market Value (US$ million) Analysis by Type for Noise, 2016 to 2032

Figure 144: MEA Market Value Share (%) and BPS Analysis by Type for Noise, 2022 to 2032

Figure 145: MEA Market Y-o-Y Growth (%) Projections by Type for Noise, 2022 to 2032

Figure 146: MEA Market Attractiveness by Vertical application, 2022 to 2032

Figure 147: MEA Market Attractiveness by Component, 2022 to 2032

Figure 148: MEA Market Attractiveness by Connectivity, 2022 to 2032

Figure 149: MEA Market Attractiveness by Type for Noise, 2022 to 2032

Figure 150: MEA Market Attractiveness by Country, 2022 to 2032

Recommendations

Industrial Automation

Noise Control System Market

Published : May 2023

Explore Technology Insights

View Reports

Noise Monitoring Devices Market