The motor monitoring market is estimated to be valued at USD 2.9 billion in 2025 and is projected to reach USD 6.5 billion by 2035, registering a compound annual growth rate (CAGR) of 8.3% over the forecast period. The market operates within industrial maintenance environments where predictive analytics and equipment reliability requirements create coordination challenges between maintenance teams and production operations departments. Manufacturing facilities experience operational complexity as motor monitoring systems require coordination between vibration analysis equipment, thermal imaging procedures, and electrical signature analysis while managing data collection schedules, trending analysis, and maintenance planning that affects both equipment availability and production continuity across diverse motor applications and operating conditions.
Plant maintenance operations encounter diagnostic challenges as condition monitoring requires coordination between multiple sensing technologies, data analysis capabilities, and maintenance scheduling while managing alarm thresholds, fault progression tracking, and repair planning procedures. Maintenance supervisors work with reliability engineering teams to establish monitoring protocols while coordinating with production planners about equipment shutdown scheduling and parts procurement that addresses both routine maintenance and emergency repair scenarios.
Cross-functional coordination between maintenance engineering teams and production management creates ongoing dialogue about monitoring system investment versus operational availability requirements. Reliability specialists work with operations managers to evaluate monitoring technology benefits against implementation costs while managing training requirements and workflow integration that affects both maintenance efficiency and production scheduling across different equipment criticality levels.
Manufacturing facilities producing motor monitoring equipment encounter development challenges as sensor integration requires coordination between mechanical mounting systems, electrical signal conditioning, and wireless communication protocols while maintaining accuracy specifications and environmental durability standards. Engineering teams coordinate with product testing departments to establish validation procedures for vibration measurement, temperature monitoring, and current signature analysis while managing calibration requirements and field service support capabilities.
Industrial automation operations experience integration complexity as motor monitoring systems must coordinate with existing plant control systems, maintenance management software, and enterprise resource planning platforms while maintaining data security and system reliability requirements. Technical teams work with information technology departments to establish data communication protocols while coordinating with cybersecurity specialists about network protection and remote access procedures that enable both local and remote monitoring capabilities.
Energy management operations encounter optimization challenges as motor monitoring data requires coordination between power quality analysis, energy consumption tracking, and efficiency improvement initiatives while managing utility cost allocation and regulatory reporting requirements. Energy engineers coordinate with facility management teams to establish performance benchmarking procedures while working with operations departments about load scheduling and equipment optimization strategies that reduce both energy consumption and maintenance costs.
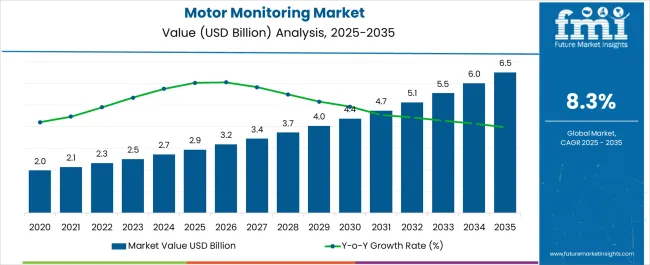
| Metric | Value |
|---|---|
| Motor Monitoring Market Estimated Value in (2025 E) | USD 2.9 billion |
| Motor Monitoring Market Forecast Value in (2035 F) | USD 6.5 billion |
| Forecast CAGR (2025 to 2035) | 8.3% |
The motor monitoring market is experiencing strong momentum as industries prioritize operational efficiency, predictive maintenance, and reduced downtime across critical assets. The rising adoption of Industrial Internet of Things technologies, coupled with advances in data analytics, has significantly enhanced the ability to monitor motor performance in real time.
Growing demand for energy efficiency and cost optimization is pushing enterprises to invest in monitoring systems that ensure prolonged motor lifespan and reduced operational failures. Regulatory frameworks emphasizing workplace safety and environmental standards are also contributing to the widespread deployment of motor monitoring solutions.
The market outlook remains positive as organizations across manufacturing, automotive, and energy sectors continue to integrate intelligent monitoring platforms to support automation, resilience, and long term asset optimization.
The market is segmented by Deployment Type, Monitoring Process, End User, and Offering and region. By Deployment Type, the market is divided into On-premise and Cloud. In terms of Monitoring Process, the market is classified into Online and Offline/Portable. Based on End User, the market is segmented into Automotive, Oil & Gas, Metals and Mining, Power Generation, Water and Wastewater Treatment, Food & Beverages, and Chemicals. By Offering, the market is divided into Software, Hardware, and Services. Regionally, the market is classified into North America, Latin America, Western Europe, Eastern Europe, Balkan & Baltic Countries, Russia & Belarus, Central Asia, East Asia, South Asia & Pacific, and the Middle East & Africa.
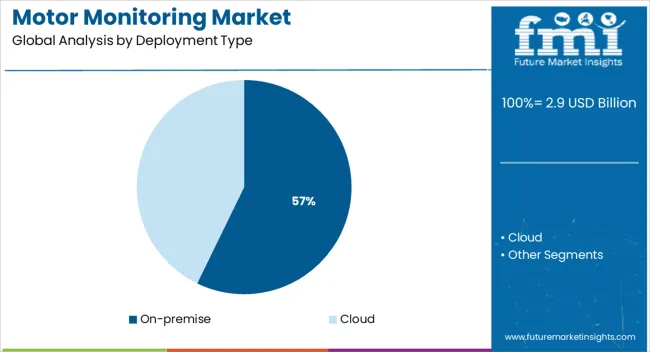
The on premise segment is expected to hold 57.20% of the total market revenue by 2025, positioning it as the dominant deployment type. This leadership is attributed to its strong security features, control over data handling, and reliability in mission critical industrial environments.
Organizations have preferred on premise models for their ability to provide customized monitoring systems that align with internal protocols and compliance requirements.
Additionally, industries with limited cloud infrastructure adoption have continued to rely on on premise systems, reinforcing its position in the overall market.
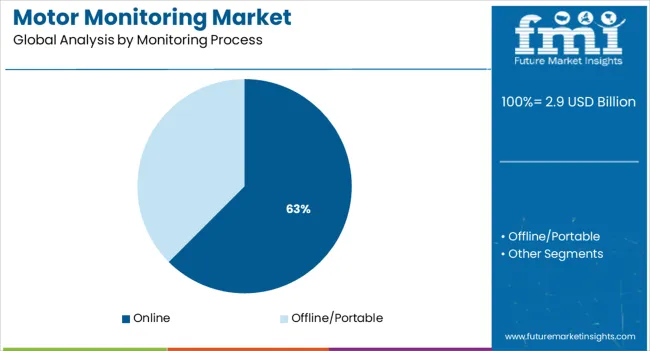
The online monitoring process segment is projected to account for 62.50% of market revenue by 2025, making it the leading process type. This dominance is supported by the need for continuous, real time performance tracking that prevents unexpected breakdowns and costly downtime.
Online systems provide predictive analytics, remote accessibility, and integration with advanced diagnostic tools, which enhance maintenance planning and reduce repair costs.
The ability to deliver actionable insights without interrupting operations has made online monitoring the preferred choice across industries seeking to maximize efficiency and reliability.
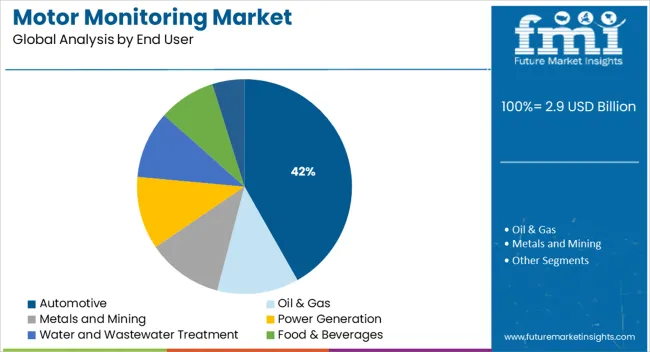
The automotive segment is anticipated to contribute 41.80% of total market revenue by 2025, emerging as the foremost end user category. This growth is being driven by the sector’s high reliance on precision manufacturing, automation, and energy intensive machinery.
Motor monitoring systems are extensively deployed to maintain production line efficiency, ensure quality consistency, and meet stringent safety standards. The automotive industry’s increasing focus on predictive maintenance strategies and sustainability targets has further reinforced adoption.
With rising production volumes and ongoing digital transformation in automotive manufacturing, this segment continues to dominate the market outlook.
The vibration occurs in all rotational equipment. Vibration screening can detect various defects in motors. The use of wireless IoT sensors and cloud-based software for condition monitoring enables industrial workers to stay ahead of equipment problems and reduce downtime by obtaining current, vibration, and temperature data from anywhere in a facility at any time. This is consistent with the market's continued growth.
The significance of electric motor monitoring is linked to the consequences of even a single motor failure. It has been estimated that the cost of missing production in the pasta production sector is equal to one hour of downtime. One of the low-cost solutions is to continue deploying predictive maintenance and educating internal maintenance employees to make them independent as soon as possible.
Rule-based predictive maintenance uses sensors to continuously gather data about assets and provides alerts depending on predetermined criteria, such as when a certain threshold is achieved. Product teams collaborate with engineering and customer service departments to determine the causes or contributing factors to their products failing using rule-based analytics. As a result, industrial IoT technologies are driving the market.
Electrical motors and drives account for around 45% of total power generation. However, if electrical machines are not properly maintained, they consume 5% to 10% more power, reducing productivity and revenue. Wireless motor monitoring can capture machine parameters more accurately, with automatic identification of abnormal situations and reporting to the server in a matter of microseconds.
Wireless technology has the advantage of being exceedingly reliable, operating even at very modest network speeds, and handling several devices at once. Because it does not entail a complex mechanism and employs a lightweight MQTT protocol, the developed system is simple to install and scale up to big industrial setups.
The motor monitoring market was worth USD 2.9 Billion in 2025, with a CAGR of 12.6% over the forecast period. Global market absolute dollar growth is USD 3.0 Billion.
Manufacturers benefit from key features such as real-time visibility into the equipment that has implemented the cloud solution and the opportunity to analyze the status of their motor. The manufacturing plant's additional software solutions can also be monitored by its central system.
Several service providers conducted using this important portable monitoring equipment. Smart sensors are a commonly available instrument that provides a remote look into client assets, hence eliminating the need to visit a site. Remote monitoring and diagnostics will be crucial in driving the market in this situation.
However, the lack of personalization, combined with the hefty initial investment, limits the market's growth. Industrial systems are becoming more complex as new technologies are integrated. At the same time, it increases the cost and complexity of maintenance and monitoring tasks to obtain trustworthy data on time.
The more sensors that are put into the system, the more data must be managed. However, digesting this enormous volume of data using database systems will be difficult. This issue is directly tied to the Big Data notion.
| Historical CAGR (2020 to 2025) | Forecast CAGR (2025 to 2035) |
|---|---|
| 12.6% | 8.3% |
As per the FMI analysts, a valuation of USD 6.5 Billion by 2035 end is estimated for the market.
| 2020 | USD 1.2 million |
|---|---|
| 2024 | USD 2.88 Billion |
| 2025 | USD 2.9 Billion |
| 2025 | USD 2.5 Billion |
| 2035 | USD 6.5 Billion |
Motor monitoring has become more accurate and economical as the cost of sub-meters and sensors has decreased, and big data technology has advanced.
Predictive maintenance has various advantages for the industry, including minimizing the amount of time spent on asset maintenance, reducing downtime, and maximizing the life of current assets to lower the cost of substitute components.
Factors driving the market demand for motor monitoring devices include:
The scarcity of skilled professionals at reasonable prices and limited technical knowledge is expected to be the primary factors limiting the market growth.
The increased use of predictive maintenance and other monitoring technologies prompts businesses to hire a data analysis staff. To obtain accurate information on the health of motors, this team should be well-versed in motors and their operation in a specific machine.
As a result, the indirect cost to businesses will rise. Furthermore, motor manufacturing businesses do not readily give monitoring solutions; hence, industries must seek out other organizations that specialize in providing monitoring solutions to obtain accurate monitoring solutions.
Apart from investments in motor installation, this can occasionally add to the overall cost structure. Different skill sets are required to monitor the data points generated by motor monitoring, which necessitates staff training and the establishment of a standard procedure for motor monitoring.
An energy audit is a government-mandated standard that governs the energy audit of various electrical devices. It offers comprehensive and systematic approaches for energy cost optimization, safety considerations, and enhancing industrial system operating and maintenance standards.
Because motors account for about 70% of energy usage in any industrial setting, motor monitoring devices might result in significant power savings and assist enterprises in complying with energy audits.
This form of implementation is required in North America, Europe, and Asia. Energy audits are required in various Asian nations, including China and India. Few nations in the Middle East and Africa, such as Tunisia and Algeria, require motor monitoring systems for energy audits due to excessive electricity use across the board.
The Energy Efficiency Directive in Europe requires prominent businesses to do energy audits every four years. Penalties are imposed if these responsibilities are not met. Hence, the adoption of motor monitoring systems becomes necessary, opening wide opportunities for market players in these regions.
Motor monitoring-based software, services, and equipment are expensive, and they require specific skill sets to operate. As a result, operators must devote more resources to motor monitoring sensors that control process training and maintenance. The motor monitoring market size determines the cost and the extent to which control services are deployed.
While several enterprises may recover these expenses relatively quickly, many small and medium-sized businesses have a longer payback time for control operations. Furthermore, the payback time and return on investment (ROI) are determined by the percentage of motor monitoring system failures that are likely to occur. When all of these considerations are considered, the payback period lengthens.
Predictive Maintenance and Analytics are Becoming Increasingly Popular
Predictive maintenance is becoming recognized as one of the most easily exploited digitalization applications. Predictive maintenance is an approach for forecasting when a piece of equipment will fail and replacing it before it does. This contributes to reduced downtime and component life extension. Predictive maintenance can save millions of dollars in lost output by preventing manufacturing line downtime. While still in its early stages, predictive maintenance is proven to be extremely beneficial to the projects by offering a new source of data for both OEMs and end users.
Predictive maintenance is crucial for motor and component safety, such as motor controllers and bearings. Predictive maintenance comprises assessing the motor's operating parameters while it is under full load, as well as the effective temperature and moisture conditions.
Predictive maintenance has several advantages for the industry, including minimizing the amount of time spent on asset maintenance, reducing downtime, which means fewer missed work hours, and extending the life of current assets to reduce the cost of replacing components.
Inadequate Technical Knowledge to Manage Monitoring Solutions
The increasing use of predictive maintenance and other monitoring systems is forcing businesses to establish specialized data analysis staff. To obtain accurate information on motor health, this team should be well-versed in motors as well as their operation in a specific machine. As a result, the indirect cost to businesses will rise.
Motor manufacturing firms do not readily supply monitoring solutions; hence, industries must look for other organizations that have competence in providing monitoring solutions. Apart from investments in motor installation, this can occasionally add to the overall cost structure. Different skill sets are necessary to monitor the data points generated by motor monitoring, which necessitates staff training as well as the establishment of a standard protocol for motor monitoring. The scarcity of skilled specialists at reasonable prices is projected to be the most significant impediment to market expansion over the forecast period.
Globally, there is a Growing Emphasis on Energy Audits and Laws
An energy audit is a government norm that governs various electrical devices. It includes comprehensive and systematic approaches for energy cost optimization, safety concerns, and enhancing industrial system operating and maintenance standards. It also aids in the availability of energy costs, energy mix options, power conservation, and reliable energy supply.
Power analyzers are required to help manufacturing units and production facilities in industries such as automotive, aerospace and defense, consumer electronics, and medical equipment comply with energy audits. Penalties apply if these responsibilities are not met. Because motors consume over 70% of the energy in any industrial setting, proper motor monitoring could result in significant power savings and help firms comply with energy audits.
Long Investment Payback Period
A higher initial investment in data gathering and analysis technologies, as well as installation, is required for continuous monitoring. System engineering and installation; field instrumentation (e.g., sensors, cabling); monitoring and diagnostic system (e.g., hardware and software, installation, software licenses); user training and customer support, if necessary; system maintenance (e.g., sensor replacement, software updates); and required external expertise and support are all key considerations when calculating the total cost of ownership. These software, services, and equipment are expensive, and they require certain skill sets to operate. As a result, operators must engage in additional training and maintenance of the motor control process.
The cost incurred is determined by the size of the industry and the extent of control service implementation. While these expenditures are recovered in a relatively short amount of time for large companies, many small and medium-sized businesses confront the difficulty of controlling process payback time. Furthermore, the payback period and return on investment (ROI) are affected by the proportion or likelihood of motor failure. When these considerations are considered, the payback period is extended.
Significant Growth in Oil and Gas
Oil and gas plants currently operate several complicated systems in industrial production. Aside from this complication, if a sudden breakdown happens in the form of misalignment, looseness, unbalance, or bearing wear, the financial and environmental repercussions could be disastrous.
Induction motors are a key piece of machinery in the oil and gas business, as they are in most industries, due to their versatility and durability. Induction motors offer rotating mechanical power to multiple systems, large and small, within an oil or gas refinery, and it is, therefore, critical to monitor their operation.
The oil and gas industry has long been a pioneer in the use of predictive maintenance technologies to optimize asset performance. Artesis predictive maintenance system, for example, offers to give all the benefits of traditional condition monitoring systems at a fraction of the complexity and cost.
Artesia MCM (motor condition monitor) provides comprehensive monitoring and diagnostic capabilities for most electric motor-driven equipment by employing an intelligent, model-based approach.
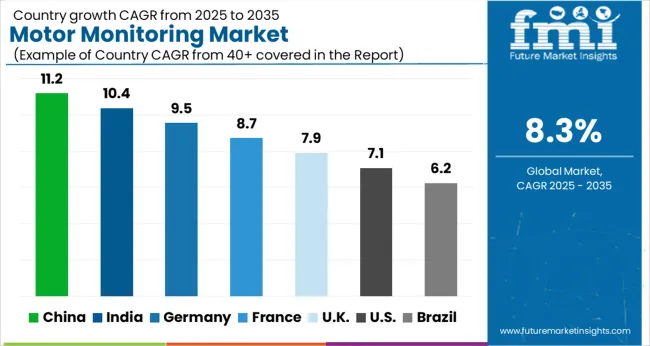
| Country | United States |
|---|---|
| CAGR (2020 to 2025) | 12.2% |
| Valuation (2025 to 2035) | USD 1.9 Billion |
| Country | United Kingdom |
|---|---|
| CAGR (2020 to 2025) | 11.2% |
| Valuation (2025 to 2035) | USD 231.5 million |
| Country | China |
|---|---|
| CAGR (2020 to 2025) | 11.8% |
| CAGR (2020 to 2025) | USD 394.7 million |
| Country | Japan |
|---|---|
| CAGR (2020 to 2025) | 10.7% |
| Valuation (2025 to 2035) | USD 322.6 million |
| Country | South Korea |
|---|---|
| CAGR (2020 to 2025) | 9.3% |
| Valuation (2025 to 2035) | USD 189.8 million |
With an increased industrial expansion in countries like China and India, Asia Pacific is expected to account for significant market growth. The Indian manufacturing industry is one of the fast-growing, with a 7.9% year-on-year increase.
The government's ‘Make in India’ initiative initiates plans to make India equally powerful for domestic and foreign enterprises, as well as to offer the Indian economy global respect. The demand for motor monitoring in this country will skyrocket as the scope expands.
China is a global manufacturing hub, encouraging investments in both the electricity and infrastructure sectors. Such initiative advances are likely to broaden the scope of current technology usage, including vibration monitoring solutions to help condition-based monitoring for motors.
Developed regions like North America and Europe are successfully leading in the global motor monitoring market due to the electrified transport and huge investments in energy infrastructures.
North America is likely to hold a significant market share in the global motor monitoring market. The factors behind the growth of the motor monitoring market in this region are increasing demand for electrical vehicles and lofty investments in heavy infrastructure development.
Due to environmental concerns and governments around the world looking for efficient and green sources of energy, the use of EVs and the use of motor monitoring sensors in them is increasing, and hence they are primarily in demand.
The motor monitoring survey explains that North America has invested more than USD 85 Billion in the energy infrastructure, according to the World Energy Investment report by International Energy Agency.
Even LMC International states that electric vehicles and other hybrid vehicle sales are expected to grow by 7% and 20%, respectively. The demand for motor monitoring systems is increasing globally due to the advent of electric vehicles and their increased applications. This will lead to high sales of motor monitoring devices. The market will thrive well than before with the new trends in the motor monitoring market.
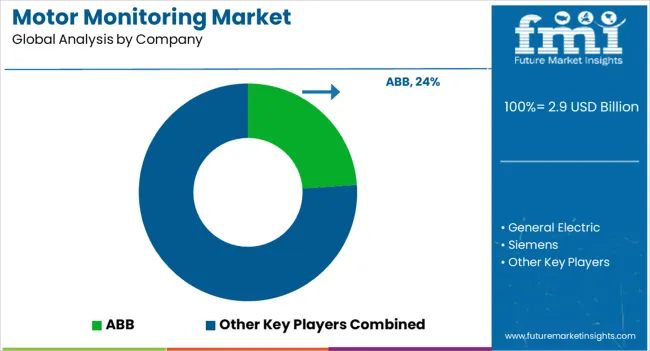
The motor monitoring market is highly competitive and technologically driven, featuring a mix of global industrial automation leaders and specialized monitoring solution providers focused on improving equipment reliability, operational efficiency, and predictive maintenance. Prominent players such as ABB, General Electric (GE), Siemens, Honeywell, and Schneider Electric dominate the landscape through their comprehensive sensor networks, condition monitoring platforms, and advanced analytics software. These companies integrate AI, IoT, and cloud-based diagnostics to enable real-time motor performance tracking and failure prevention across manufacturing, energy, and infrastructure sectors.
Emerson, Eaton, and Rockwell Automation strengthen market competitiveness through predictive maintenance systems, integrated control platforms, and intelligent service tools that optimize operational uptime. Mitsubishi Electric continues to expand its presence by combining automation hardware with digital monitoring solutions, enhancing process visibility for industrial users. Qualitrol is recognized for its expertise in sensor-based monitoring and diagnostic solutions, particularly in power generation and heavy industrial environments.
The market is witnessing growing collaboration and innovation, such as SKF’s partnership with Södra to develop advanced vibration and performance monitoring sensors, and General Electric’s CONNECTIX platform for real-time machine analytics. Moving forward, predictive analytics, wireless sensor integration, and cloud-based service models are expected to be key differentiators among leading players.
| Attribute | Details |
|---|---|
| Market Size Value in 2025 | USD 2.5 Billion |
| Market Size Value in 2035 | USD 5.5 Billion |
| Market Analysis | USD Billion for Value |
| Key Region Covered | North America; Latin America; Europe; Asia Pacific; The Middle East & Africa |
| Key Segments | By Deployment type, By Monitoring Process, By End User, By Offering, By Region |
| Key Companies Profiled |
ABB, General Electric, Siemens, Honeywell, Schneider Electric, Emerson, Eaton, Rockwell Automation, Mitsubishi Electric, Qualitrol |
| Report Coverage | Market Forecast, Company Share Analysis, Competition Intelligence, DROT Analysis, Market Dynamics and Challenges, and Strategic Growth Initiatives |
| Customization & Pricing | Available upon Request |
Growing demand for electric vehicles, electric motors and new efficient sources of energy are the key driving forces behind the growing demand for hardware-based motor monitoring.
On-premise type of deployment or installation is the traditional way of monitoring motors. It involves storing the data and then submitting it physically with the help of motor monitoring sensors and motor monitoring modules. The on-premise segment has the most significant share in the global motor monitoring market share.
It is installed physically on motors, shafts, computers, and servers. The factors behind the preference for on-premise deployment type are the easy installation and the high security it provides to the user. The better control over data that it provides to the end user is also comparatively better than the cloud deployment type while storing data through any motor monitoring system.
It also provides accessible functions without networks and doesn’t involve third-party dealers. Even industries get a better hold over data with the help of on-premise deployment as it stores data physically. These are the key drivers behind the preference for on-premise deployment in the motor control market.
The online segment performs better than any other monitoring process as it is primarily used in plants and industries that are operational all day.
Adoption is also supported owing to its capability of storing data at any point in time. The decline in the prices of sensors, submitters, and other storage devices is also driving the high sales of motor monitoring devices. This process works through a wireless motor monitoring system and a monitoring induction motor.
The hardware segment is likely to perform better and leads the share of the global motor monitoring market.
The growing demand for electric vehicles, electric motors, and new efficient energy sources are the key driving forces behind the growing demand for all these hardware products. The hardware segment involves vibration sensors, infrared sensors, corrosion probes, ultrasound detectors, and spectrum analyzers.
The oil & gas segment is likely to hold a significant portion of the global market in the forecast period.
The primary factor behind the growth of this end-user segment is that a motor is an essential machine used in an oil & gas plant, and it needs constant monitoring to avoid any hazard. The motor monitoring devices help these plants drill in the remotest areas while analyzing the growth remotely, which contributes to their adoption in the industry.
The global motor monitoring market is estimated to be valued at USD 2.9 billion in 2025.
The market size for the motor monitoring market is projected to reach USD 6.5 billion by 2035.
The motor monitoring market is expected to grow at a 8.3% CAGR between 2025 and 2035.
The key product types in motor monitoring market are on-premise and cloud.
In terms of monitoring process, online segment to command 62.5% share in the motor monitoring market in 2025.


Our Research Products

The "Full Research Suite" delivers actionable market intel, deep dives on markets or technologies, so clients act faster, cut risk, and unlock growth.

The Leaderboard benchmarks and ranks top vendors, classifying them as Established Leaders, Leading Challengers, or Disruptors & Challengers.

Locates where complements amplify value and substitutes erode it, forecasting net impact by horizon

We deliver granular, decision-grade intel: market sizing, 5-year forecasts, pricing, adoption, usage, revenue, and operational KPIs—plus competitor tracking, regulation, and value chains—across 60 countries broadly.

Spot the shifts before they hit your P&L. We track inflection points, adoption curves, pricing moves, and ecosystem plays to show where demand is heading, why it is changing, and what to do next across high-growth markets and disruptive tech

Real-time reads of user behavior. We track shifting priorities, perceptions of today’s and next-gen services, and provider experience, then pace how fast tech moves from trial to adoption, blending buyer, consumer, and channel inputs with social signals (#WhySwitch, #UX).

Partner with our analyst team to build a custom report designed around your business priorities. From analysing market trends to assessing competitors or crafting bespoke datasets, we tailor insights to your needs.
Supplier Intelligence
Discovery & Profiling
Capacity & Footprint
Performance & Risk
Compliance & Governance
Commercial Readiness
Who Supplies Whom
Scorecards & Shortlists
Playbooks & Docs
Category Intelligence
Definition & Scope
Demand & Use Cases
Cost Drivers
Market Structure
Supply Chain Map
Trade & Policy
Operating Norms
Deliverables
Buyer Intelligence
Account Basics
Spend & Scope
Procurement Model
Vendor Requirements
Terms & Policies
Entry Strategy
Pain Points & Triggers
Outputs
Pricing Analysis
Benchmarks
Trends
Should-Cost
Indexation
Landed Cost
Commercial Terms
Deliverables
Brand Analysis
Positioning & Value Prop
Share & Presence
Customer Evidence
Go-to-Market
Digital & Reputation
Compliance & Trust
KPIs & Gaps
Outputs
Full Research Suite comprises of:
Market outlook & trends analysis
Interviews & case studies
Strategic recommendations
Vendor profiles & capabilities analysis
5-year forecasts
8 regions and 60+ country-level data splits
Market segment data splits
12 months of continuous data updates
DELIVERED AS:
PDF EXCEL ONLINE
Motor Bearing Market Size and Share Forecast Outlook 2025 to 2035
Motorcycle Fuel Hoses Market Size and Share Forecast Outlook 2025 to 2035
Motorcycle Drive Chain Market Size and Share Forecast Outlook 2025 to 2035
Motorcycle Wheels Market Size and Share Forecast Outlook 2025 to 2035
Motorized Ring Main Unit Market Size and Share Forecast Outlook 2025 to 2035
Motorhome Market Size and Share Forecast Outlook 2025 to 2035
Motorcycle Airbag Jacket Market Size and Share Forecast Outlook 2025 to 2035
Motorcycle Helmet Market Size and Share Forecast Outlook 2025 to 2035
Motorcycle Diagnostic Scan Tools Market Size and Share Forecast Outlook 2025 to 2035
Motorized Prosthesis Market Size and Share Forecast Outlook 2025 to 2035
Motorized Pool Tube Market Size and Share Forecast Outlook 2025 to 2035
Motor Generator Set Market Size, Growth, and Forecast 2025 to 2035
Motorized Decoiler Machine Market Growth - Trends & Forecast 2025 to 2035
Motorcycle Chain Market Analysis - Size, Share, and Forecast 2025 to 2035
Motor Protector Market Size, Growth, and Forecast for 2025 to 2035
Motorcycle Suspension System Market Growth - Trends & Forecast 2025 to 2035
Motor Control IC Market by Type, Industry, and Region – Growth, Trends, and Forecast through 2025 to 2035
Motorcycle Lead Acid Battery Market - Trends & Forecast 2025 to 2035
Motor Winding Repair Service Market Growth - Trends & Forecast 2025 to 2035
Motor Testing Equipment Market - Growth & Demand 2025 to 2035

Thank you!
You will receive an email from our Business Development Manager. Please be sure to check your SPAM/JUNK folder too.
Chat With
MaRIA