Motor Generator Set Market Forecast and Outlook 2025 to 2035

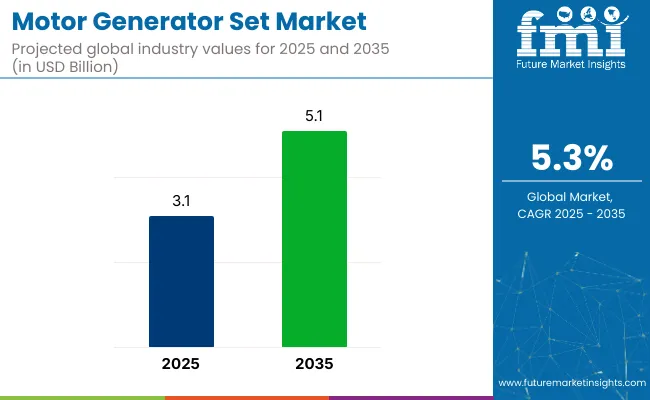
The global motor generator set market is valued at USD 3.1 billion in 2025 and is slated to be worth USD 5.1 billion by 2035, reflecting a CAGR of 5.3%. Market expansion will be driven by increasing demand for stable and uninterrupted power supply across industrial sector, healthcare industry, and data centers.

The increasing adoption of hybrid energy solutions, regulatory pressure to reduce emissions, and the need for backup power in renewable energy integrations are shaping the market. DC to AC motor generator sets will play a critical role in voltage stabilization, especially in precision manufacturing and data processing sectors. Smart grid expansion and microgrid development are expected to support continued adoption globally.
Quick Stats of Motor Generator Set Market

  • Market Value (2025): USD 3.1 billion
  • Forecast Value (2035): USD 5.1 billion
  • Forecast CAGR: 5.3%
  • Type Leader in 2025: DC to AC Motor Generator Sets (62% Market Share)
  • Top Application Segment: Industrial (38% Market Share)
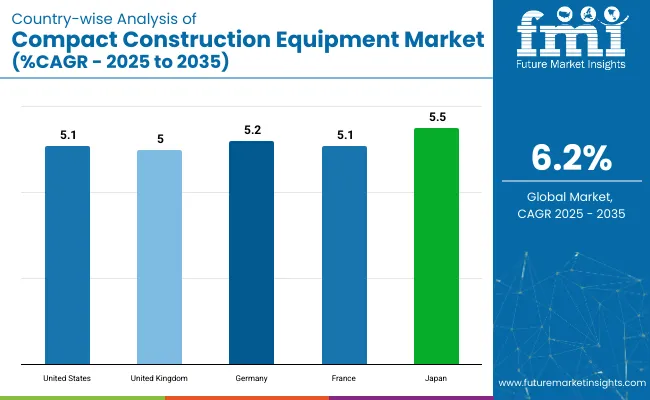
  • Key Growth Region: Asia Pacific (fastest-growing market in Japan with 5.5% CAGR)

Motor Generator Set Market

Metric Value
Estimated Size (2025) USD 3.1 billion
Projected Value (2035) USD 5.1 billion
CAGR (2025 to 2035) 5.3%

The USA is projected to retain the largest market share through 2035, driven by expanding demand in data centers, healthcare, and smart infrastructure. A CAGR of 5.5% is estimated to be registered by Japan, driven by the demand for backup power solutions for high-tech industrial operations. DC to AC systems account for the highest segment share of 62%, while the industrial sector by application segment holds 38% of the market share in 2025.

Profitability is being experienced by Caterpillar and Mitsubishi Electric due to increasing demand for hybrid and fuel-efficient generators. These companies benefit from their focus on digital monitoring and compact designs. Challenges may be faced by companies reliant solely on traditional AC to DC generators due to declining adoption in conventional industries and growing regulatory hurdles. European manufacturers face pressure to comply with stringent emission norms, leading to higher operational costs.

Looking forward, investments in hybrid motor generator systems that combine solar, wind, and diesel backup will shape the next wave of innovations. Integration with IoT and AI for predictive maintenance and efficiency monitoring is expected to gain traction. Emerging markets in Africa and Southeast Asia will offer new growth opportunities due to unreliable grids and ongoing industrialization. Manufacturers who focus on modular, low-emission systems are poised to succeed over the forecast period.

Motor Generator Set Market Analysis by Top Investment Segments

The global motor generator set market is segmented by type into DC to AC motor generator set and AC to DC motor generator set. It is segmented by application into industrial, automotive industry, electrical and electronic industry, energy/oil/power industries, metal & mineral industry, and by region (North America, Latin America, Western Europe, South Asia, East Asia, Eastern Europe, Middle East & Africa).
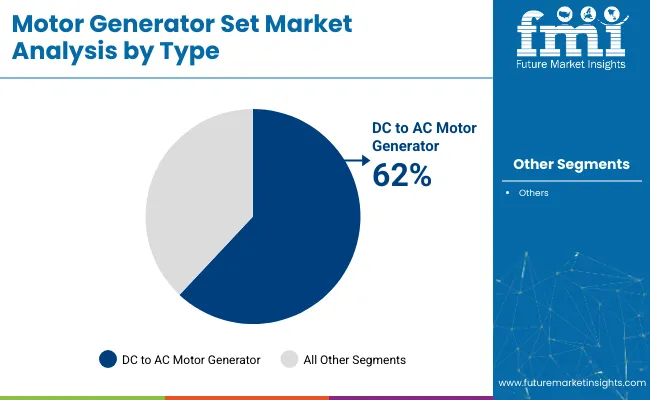
By Type, DC to AC Motor Generator Sets Account for 62% of the Market Share

Motor Generator Set Market Analysis By Type

DC to AC motor generator sets are expected to dominate the global market due to their essential role in renewable energy integration, industrial automation, and backup systems. These sets efficiently convert DC power, often generated by solar and wind sources, into usable AC power for grid and facility use. Their compatibility with modern smart grid systems and critical infrastructure applications like data centers and telecom networks is projected to drive their share to 62% by 2035.
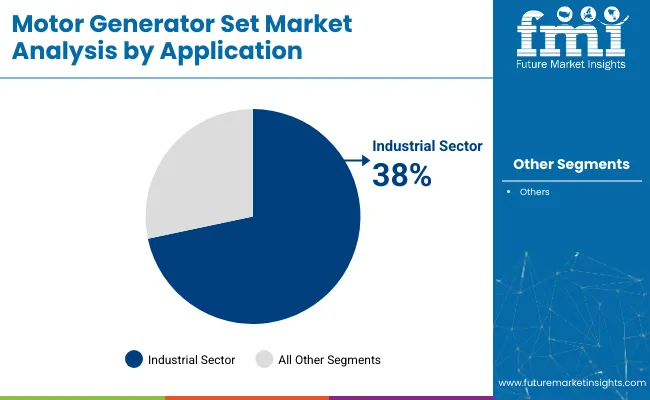
By Application, the Industrial Sector Accounts for 38% of the Market Share

Motor Generator Set Market Analysis By Application

The industrial sector is projected to lead all applications in the motor generator set market, accounting for 38% of the market share by 2035. This dominance is attributed to the sector's dependence on stable and continuous power supply for operations such as mining, manufacturing, and heavy-duty automation. A crucial role in mitigating voltage fluctuations is played by generator sets, ensuring equipment safety, minimizing downtime, and making them indispensable in sectors focused on operational efficiency and precision manufacturing.

Top Motor Generator Set Market Dynamics

Recent Trends in the Motor Generator Set Market

  • Traction is being gained by the integration of hybrid generator systems that combine renewable energy sources with conventional units.
  • An acceleration in adoption is being observed for IoT-enabled predictive maintenance and remote monitoring across industries.
  • Demand for compact, fuel-efficient, and low-emission generator sets is on the rise.
  • Global increases in investment are being seen in decentralized and microgrid-compatible power solutions.

Key Challenges Facing the Motor Generator Set Market
  • High initial capital and ongoing maintenance costs limit adoption, especially among SMEs.
  • Rising competition from battery storage systems and renewable-only power solutions.
  • Stringent environmental regulations push manufacturers toward costlier clean technologies.
  • Dependence on skilled labor for system integration and servicing poses operational hurdles.

Analyzing Top Countries Manufacturing and Supplying Motor Generator Sets

Motor Generator Set Market Country Wise Analysis

USA Motor Generator Set Market Analysis

The motor generator set market in the USA is expected to expand at a CAGR of 5.1% from 2025 to 2035. Growth is being fueled by the rising demand for stable power in data centers, healthcare facilities, and advanced manufacturing units. Adoption is being further boosted by strong federal support for energy resilience and disaster preparedness. Hybrid technologies are gaining popularity to ensure compliance with emission regulations and operational efficiency goals.

  • Widespread deployment in mission-critical sectors like healthcare and defense.
  • Increasing grid instability is driving demand for backup power systems.
  • Strong policy incentives supporting energy-efficient power equipment.

UK Motor Generator Set Demand Analysis

The motor generator set market in the UK is anticipated to grow at a CAGR of 5.0% between 2025 and 2035. Increased investments in digital infrastructure, particularly data centers and smart buildings, are raising demand for stable power solutions. Environmental regulations are pushing the adoption of hybrid and low-emission generator sets. The UK’s transition to renewables has also created demand for grid stabilization tools like motor generator sets.

  • A growing number of data centers require continuous power flow.
  • Stringent emission laws promoting cleaner generator alternatives.
  • Backup systems are critical in the telecom and financial services sectors.

Motor Generator Set Sales Analysis in Germany

The motor generator set market in Germany is projected to witness a CAGR of 5.2% during the forecast period of 2025 to 2035. The country’s strong manufacturing base and leadership in industrial automation support generator set deployment. Adoption is being reinforced by technological innovation, especially through the integration of smart monitoring and fuel efficiency. Government-driven energy transition policies are also increasing hybrid and renewable-compatible generator demand.

  • High automation levels in industries necessitate stable power.
  • Strong R&D in energy-efficient and intelligent generator systems.
  • Environmental policy framework encouraging hybrid integration.

France Motor Generator Set Market Analysis

The motor generator set industry in France is forecast to grow at a CAGR of 5.1% between 2025 and 2035. The country’s focus on energy diversification and infrastructure modernization supports steady demand. The transport and telecommunication sectors are key adopters of backup generator sets. Hybrid generators are also gaining preference in sectors affected by energy transition policies.

  • Modernization of public infrastructure projects is increasing generator demand.
  • Energy diversification goals encourage hybrid system deployment.
  • Increased need for power reliability in telecom networks.

Japan Motor Generator Set Market Analysis

The Japanese motor generator set market is set to grow at 5.5% CAGR from 2025 to 2035. Frequent natural disasters and high-tech industrial operations necessitate resilient backup power solutions. The country is also advancing hybrid and low-emission technologies aligned with its carbon neutrality goals. Investment in smart factories and disaster-resilient infrastructure is further supporting market expansion.

  • Frequent earthquakes drive the need for emergency power systems.
  • High-tech sectors demand stable and efficient energy systems.
  • National policies favoring low-emission, smart energy technologies.

Leading Motor Generator Set Suppliers

The motor generator set market is moderately consolidated, with a mix of global leaders and regional players shaping the competitive landscape. Prominent companies such as Caterpillar Inc., Cummins Inc., Mitsubishi Heavy Industries, ABB Ltd., and General Electric collectively hold a significant share.

These firms compete aggressively based on technology innovation, hybrid system integration, fuel efficiency, emissions compliance, and smart monitoring solutions. The market edge is being maintained through strategic expansions into emerging markets and continuous investment in R&D.

Companies focus on developing hybrid and low-emission generator sets, aligning with global carbon reduction goals. They integrate IoT-based predictive maintenance, making digitalization a major theme and AI-driven diagnostics into their generator systems.

Firms like Cummins and Mitsubishi are expanding manufacturing footprints in Asia Pacific, while Caterpillar is pushing localized service networks to strengthen aftermarket support. The aim is to reduce operational costs and provide resilience in power supply for critical sectors like data centers, oil & gas, and healthcare.

Recent Motor Generator Set Industry News

  • Caterpillar Marine received DNV Approval in Principle for methanol-ready dual-fuel 3500E generator engines in November 2024.
  • In June 2024, Caterpillar introduced the CG260 gas generator set with hydrogen-blend capability (400 kW-4.5 MW), alongside retrofit kits for CG132B, CG170B, CG260, and G3500H platforms.
  • In 2024, rolled out the Centum Power Series (C2750D6E and C3000D6EB) for critical applications.

Motor Generator Set Market Report Scope

Report Attributes                     Details                                                                
Current Total Market Size (2025) USD 3.1 billion
Projected Market Size (2035) USD 5.1 billion
CAGR (2025 to 2035) 5.3%
Base Year for Estimation 2024
Historical Period 2020 to 2024
Projections Period 2025 to 2035
Market Analysis Parameters Revenue in USD billions /Volume in units
By Type DC to AC Motor Generator Set, AC to DC Motor Generator Set
By Application Industrial, Automotive Industry, Electrical and Electronic Industry, Energy/Oil/Power Industries, Metal & Mineral Industry
Regions Covered North America, Latin America, Western Europe, Eastern Europe, East Asia, South Asia, Middle East & Africa
Countries Covered United States, Canada, United Kingdom, Germany, France, China, Japan, South Korea, Brazil, Australia
Key Players Caterpillar Inc., Cummins Inc., Generac Holdings Inc., Kohler Co., Mitsubishi Heavy Industries, ABB Ltd., Siemens AG, General Electric, Toshiba Corporation, Kirloskar Electric Company
Additional Attributes Dollar sales by value, market share analysis by region, and country-wise analysis

Market Segmentation

By Type:

In terms of Type, the industry is divided into DC to AC Motor Generator Set, AC to DC Motor Generator Set

By Application:

In terms of Application, the industry is divided into Industrial, Automotive Industry, Electrical and Electronic Industry, Energy/Oil/Power Industries, Metal & Mineral Industry

By Region:

The report covers key regions, including North America, Latin America, Western Europe, Eastern Europe, East Asia, South Asia, and the Middle East and Africa (MEA).

Table of Content

  1. Executive Summary
    • Global Market Outlook
    • Demand-side Trends
    • Supply-side Trends
    • Technology Roadmap Analysis
    • Analysis and Recommendations
  2. Market Overview
    • Market Coverage / Taxonomy
    • Market Definition / Scope / Limitations
  3. Market Background
    • Market Dynamics
      • Drivers
      • Restraints
      • Opportunity
      • Trends
    • Scenario Forecast
      • Demand in Optimistic Scenario
      • Demand in Likely Scenario
      • Demand in Conservative Scenario
    • Opportunity Map Analysis
    • Product Life Cycle Analysis
    • Supply Chain Analysis
      • Supply Side Participants and their Roles
        • Producers
        • Mid-Level Participants (Traders/ Agents/ Brokers)
        • Wholesalers and Distributors
      • Value Added and Value Created at Node in the Supply Chain
      • List of Raw Material Suppliers
      • List of Existing and Potential Buyer’s
    • Investment Feasibility Matrix
    • Value Chain Analysis
      • Profit Margin Analysis
      • Wholesalers and Distributors
      • Retailers
    • PESTLE and Porter’s Analysis
    • Regulatory Landscape
      • By Key Regions
      • By Key Countries
    • Regional Parent Market Outlook
    • Production and Consumption Statistics
    • Import and Export Statistics
  4. Global Analysis 2020 to 2024 and Forecast, 2025 to 2035
    • Historical Market Size Value (USD Billion) & Volume (Units) Analysis, 2020 to 2024
    • Current and Future Market Size Value (USD Billion) & Volume (Units) Projections, 2025 to 2035
      • Y-o-Y Growth Trend Analysis
      • Absolute $ Opportunity Analysis
  5. Global Pricing Analysis 2020 to 2024 and Forecast 2025 to 2035
  6. Global Analysis 2020 to 2024 and Forecast 2025 to 2035, By Type
    • Introduction / Key Findings
    • Historical Market Size Value (USD Billion) & Volume (Units) Analysis By Type, 2020 to 2024
    • Current and Future Market Size Value (USD Billion) & Volume (Units) Analysis and Forecast By Type, 2025 to 2035
      • DC and AC Motor Generator Set
      • AC to DC Motor Generator Set
    • Y-o-Y Growth Trend Analysis By Type, 2020 to 2024
    • Absolute $ Opportunity Analysis By Type, 2025 to 2035
  7. Global Analysis 2020 to 2024 and Forecast 2025 to 2035, By Application
    • Introduction / Key Findings
    • Historical Market Size Value (USD Billion) & Volume (Units) Analysis By Application, 2020 to 2024
    • Current and Future Market Size Value (USD Billion) & Volume (Units) Analysis and Forecast By Application, 2025 to 2035
      • Industrial
      • Automotive Industry
      • Electric and Electronic Industry
      • Energy/Oil/Power Industries
      • Metal & Mineral Industry
    • Y-o-Y Growth Trend Analysis By Application, 2020 to 2024
    • Absolute $ Opportunity Analysis By Application, 2025 to 2035
  8. Global Analysis 2020 to 2024 and Forecast 2025 to 2035, By Region
    • Introduction
    • Historical Market Size Value (USD Billion) & Volume (Units) Analysis By Region, 2020 to 2024
    • Current Market Size Value (USD Billion) & Volume (Units) Analysis and Forecast By Region, 2025 to 2035
      • North America
      • Latin America
      • Western Europe
      • Eastern Europe
      • East Asia
      • South Asia & Pacific
      • Middle East and Africa
    • Market Attractiveness Analysis By Region
  9. North America Analysis 2020 to 2024 and Forecast 2025 to 2035, By Country
    • Historical Market Size Value (USD Billion) & Volume (Units) Trend Analysis By Market Taxonomy, 2020 to 2024
    • Market Size Value (USD Billion) & Volume (Units) Forecast By Market Taxonomy, 2025 to 2035
      • By Country
        • USA
        • Canada
        • Mexico
      • By Type
      • By Application
    • Market Attractiveness Analysis
      • By Country
      • By Type
      • By Application
    • Key Takeaways
  10. Latin America Analysis 2020 to 2024 and Forecast 2025 to 2035, By Country
    • Historical Market Size Value (USD Billion) & Volume (Units) Trend Analysis By Market Taxonomy, 2020 to 2024
    • Market Size Value (USD Billion) & Volume (Units) Forecast By Market Taxonomy, 2025 to 2035
      • By Country
        • Brazil
        • Argentina
        • Rest of LATAM
      • By Type
      • By Application
    • Market Attractiveness Analysis
      • By Country
      • By Type
      • By Application
    • Key Takeaways
  11. Western Europe Analysis 2020 to 2024 and Forecast 2025 to 2035, By Country
    • Historical Market Size Value (USD Billion) & Volume (Units) Trend Analysis By Market Taxonomy, 2020 to 2024
    • Market Size Value (USD Billion) & Volume (Units) Forecast By Market Taxonomy, 2025 to 2035
      • By Country
        • Germany
        • Italy
        • France
        • UK
        • Spain
        • BENELUX
        • Nordic
        • Rest of W.Europe
      • By Type
      • By Application
    • Market Attractiveness Analysis
      • By Country
      • By Type
      • By Application
    • Key Takeaways
  12. Eastern Europe Analysis 2020 to 2024 and Forecast 2025 to 2035, By Country
    • Historical Market Size Value (USD Billion) & Volume (Units) Trend Analysis By Market Taxonomy, 2020 to 2024
    • Market Size Value (USD Billion) & Volume (Units) Forecast By Market Taxonomy, 2025 to 2035
      • By Country
        • Russia
        • Hungary
        • Poland
        • Balkan & Baltics
        • Rest of E. Europe
      • By Type
      • By Application
    • Market Attractiveness Analysis
      • By Country
      • By Type
      • By Application
    • Key Takeaways
  13. East Asia Analysis 2020 to 2024 and Forecast 2025 to 2035, By Country
    • Historical Market Size Value (USD Billion) & Volume (Units) Trend Analysis By Market Taxonomy, 2020 to 2024
    • Market Size Value (USD Billion) & Volume (Units) Forecast By Market Taxonomy, 2025 to 2035
      • By Country
        • China
        • Japan
        • South Korea
      • By Type
      • By Application
    • Market Attractiveness Analysis
      • By Country
      • By Type
      • By Application
    • Key Takeaways
  14. South Asia & Pacific Analysis 2020 to 2024 and Forecast 2025 to 2035, By Country
    • Historical Market Size Value (USD Billion) & Volume (Units) Trend Analysis By Market Taxonomy, 2020 to 2024
    • Market Size Value (USD Billion) & Volume (Units) Forecast By Market Taxonomy, 2025 to 2035
      • By Country
        • India
        • Australia & New Zealand
        • ASEAN
        • Rest of SAP
      • By Type
      • By Application
    • Market Attractiveness Analysis
      • By Country
      • By Type
      • By Application
    • Key Takeaways
  15. Middle East and Africa Analysis 2020 to 2024 and Forecast 2025 to 2035, By Country
    • Historical Market Size Value (USD Billion) & Volume (Units) Trend Analysis By Market Taxonomy, 2020 to 2024
    • Market Size Value (USD Billion) & Volume (Units) Forecast By Market Taxonomy, 2025 to 2035
      • By Country
        • GCC Countries
        • Northern Africa
        • South Africa
        • Turkiye
        • Rest of MEA
      • By Type
      • By Application
    • Market Attractiveness Analysis
      • By Country
      • By Type
      • By Application
    • Key Takeaways
  16. Key Countries Analysis
    • USA
      • Pricing Analysis
      • Market Share Analysis, 2024
        • By Type
        • By Application
    • Canada
      • Pricing Analysis
      • Market Share Analysis, 2024
        • By Type
        • By Application
    • Brazil
      • Pricing Analysis
      • Market Share Analysis, 2024
        • By Type
        • By Application
    • Mexico
      • Pricing Analysis
      • Market Share Analysis, 2024
        • By Type
        • By Application
    • Argentina
      • Pricing Analysis
      • Market Share Analysis, 2024
        • By Type
        • By Application
  17. Market Structure Analysis
    • Competition Dashboard
    • Competition Benchmarking
    • Market Share Analysis of Top Players
      • By Regional
      • By Type
      • By Application
  18. Competition Analysis
    • Competition Deep Dive
      • Caterpillar Inc.
        • Overview
        • Product Portfolio
        • Profitability by Market Segments (Product/Age /Sales Channel/Region)
        • Sales Footprint
        • Strategy Overview
          • Marketing Strategy
          • Product Strategy
          • Channel Strategy
      • Cummins Inc.
        • Overview
        • Product Portfolio
        • Profitability by Market Segments (Product/Age /Sales Channel/Region)
        • Sales Footprint
        • Strategy Overview
          • Marketing Strategy
          • Product Strategy
          • Channel Strategy
      • General Holdings Inc.
        • Overview
        • Product Portfolio
        • Profitability by Market Segments (Product/Age /Sales Channel/Region)
        • Sales Footprint
        • Strategy Overview
          • Marketing Strategy
          • Product Strategy
          • Channel Strategy
      • Kohler Co.
        • Overview
        • Product Portfolio
        • Profitability by Market Segments (Product/Age /Sales Channel/Region)
        • Sales Footprint
        • Strategy Overview
          • Marketing Strategy
          • Product Strategy
          • Channel Strategy
      • Mitsubishi Heavy Industries
        • Overview
        • Product Portfolio
        • Profitability by Market Segments (Product/Age /Sales Channel/Region)
        • Sales Footprint
        • Strategy Overview
          • Marketing Strategy
          • Product Strategy
          • Channel Strategy
      • ABB Ltb.
        • Overview
        • Product Portfolio
        • Profitability by Market Segments (Product/Age /Sales Channel/Region)
        • Sales Footprint
        • Strategy Overview
          • Marketing Strategy
          • Product Strategy
          • Channel Strategy
      • Siemens AG
        • Overview
        • Product Portfolio
        • Profitability by Market Segments (Product/Age /Sales Channel/Region)
        • Sales Footprint
        • Strategy Overview
          • Marketing Strategy
          • Product Strategy
          • Channel Strategy
      • General Electric
        • Overview
        • Product Portfolio
        • Profitability by Market Segments (Product/Age /Sales Channel/Region)
        • Sales Footprint
        • Strategy Overview
          • Marketing Strategy
          • Product Strategy
          • Channel Strategy
      • Toshiba Corporation
        • Overview
        • Product Portfolio
        • Profitability by Market Segments (Product/Age /Sales Channel/Region)
        • Sales Footprint
        • Strategy Overview
          • Marketing Strategy
          • Product Strategy
          • Channel Strategy
      • Kirloskar Electric Compnay
        • Overview
        • Product Portfolio
        • Profitability by Market Segments (Product/Age /Sales Channel/Region)
        • Sales Footprint
        • Strategy Overview
          • Marketing Strategy
          • Product Strategy
          • Channel Strategy
  19. Assumptions & Acronyms Used
  20. Research Methodology

List of Tables

  • Table 1: Global Value (USD Billion) Forecast by Region, 2020-2035
  • Table 2: Global Volume (Units) Forecast by Region, 2020-2035
  • Table 3: Global Value (USD Billion) Forecast by By Type, 2020-2035
  • Table 4: Global Volume (Units) Forecast by By Type, 2020-2035
  • Table 5: Global Value (USD Billion) Forecast by By Application, 2020-2035
  • Table 6: Global Volume (Units) Forecast by By Application, 2020-2035
  • Table 7: North America Value (USD Billion) Forecast by Country, 2020-2035
  • Table 8: North America Volume (Units) Forecast by Country, 2020-2035
  • Table 9: North America Value (USD Billion) Forecast by By Type, 2020-2035
  • Table 10: North America Volume (Units) Forecast by By Type, 2020-2035
  • Table 11: North America Value (USD Billion) Forecast by By Application, 2020-2035
  • Table 12: North America Volume (Units) Forecast by By Application, 2020-2035
  • Table 13: Latin America Value (USD Billion) Forecast by Country, 2020-2035
  • Table 14: Latin America Volume (Units) Forecast by Country, 2020-2035
  • Table 15: Latin America Value (USD Billion) Forecast by By Type, 2020-2035
  • Table 16: Latin America Volume (Units) Forecast by By Type, 2020-2035
  • Table 17: Latin America Value (USD Billion) Forecast by By Application, 2020-2035
  • Table 18: Latin America Volume (Units) Forecast by By Application, 2020-2035
  • Table 19: Western Europe Value (USD Billion) Forecast by Country, 2020-2035
  • Table 20: Western Europe Volume (Units) Forecast by Country, 2020-2035
  • Table 21: Western Europe Value (USD Billion) Forecast by By Type, 2020-2035
  • Table 22: Western Europe Volume (Units) Forecast by By Type, 2020-2035
  • Table 23: Western Europe Value (USD Billion) Forecast by By Application, 2020-2035
  • Table 24: Western Europe Volume (Units) Forecast by By Application, 2020-2035
  • Table 25: Eastern Europe Value (USD Billion) Forecast by Country, 2020-2035
  • Table 26: Eastern Europe Volume (Units) Forecast by Country, 2020-2035
  • Table 27: Eastern Europe Value (USD Billion) Forecast by By Type, 2020-2035
  • Table 28: Eastern Europe Volume (Units) Forecast by By Type, 2020-2035
  • Table 29: Eastern Europe Value (USD Billion) Forecast by By Application, 2020-2035
  • Table 30: Eastern Europe Volume (Units) Forecast by By Application, 2020-2035
  • Table 31: East Asia Value (USD Billion) Forecast by Country, 2020-2035
  • Table 32: East Asia Volume (Units) Forecast by Country, 2020-2035
  • Table 33: East Asia Value (USD Billion) Forecast by By Type, 2020-2035
  • Table 34: East Asia Volume (Units) Forecast by By Type, 2020-2035
  • Table 35: East Asia Value (USD Billion) Forecast by By Application, 2020-2035
  • Table 36: East Asia Volume (Units) Forecast by By Application, 2020-2035
  • Table 37: South Asia & Pacific Value (USD Billion) Forecast by Country, 2020-2035
  • Table 38: South Asia & Pacific Volume (Units) Forecast by Country, 2020-2035
  • Table 39: South Asia & Pacific Value (USD Billion) Forecast by By Type, 2020-2035
  • Table 40: South Asia & Pacific Volume (Units) Forecast by By Type, 2020-2035
  • Table 41: South Asia & Pacific Value (USD Billion) Forecast by By Application, 2020-2035
  • Table 42: South Asia & Pacific Volume (Units) Forecast by By Application, 2020-2035
  • Table 43: Middle East and Africa Value (USD Billion) Forecast by Country, 2020-2035
  • Table 44: Middle East and Africa Volume (Units) Forecast by Country, 2020-2035
  • Table 45: Middle East and Africa Value (USD Billion) Forecast by By Type, 2020-2035
  • Table 46: Middle East and Africa Volume (Units) Forecast by By Type, 2020-2035
  • Table 47: Middle East and Africa Value (USD Billion) Forecast by By Application, 2020-2035
  • Table 48: Middle East and Africa Volume (Units) Forecast by By Application, 2020-2035

List of Figures

  • Figure 1: Global Volume (Units) Forecast 2020-2035
  • Figure 2: Global Pricing Analysis
  • Figure 3: Global Value (USD Billion) Forecast 2020-2035
  • Figure 4: Global Value Share and BPS Analysis by By Type, 2025 and 2035
  • Figure 5: Global Y-o-Y Growth Comparison by By Type, 2025-2035
  • Figure 6: Global Attractiveness Analysis by By Type
  • Figure 7: Global Value Share and BPS Analysis by By Application, 2025 and 2035
  • Figure 8: Global Y-o-Y Growth Comparison by By Application, 2025-2035
  • Figure 9: Global Attractiveness Analysis by By Application
  • Figure 10: Global Value (USD Billion) Share and BPS Analysis by Region, 2025 and 2035
  • Figure 11: Global Y-o-Y Growth Comparison by Region, 2025-2035
  • Figure 12: Global Attractiveness Analysis by Region
  • Figure 13: North America Incremental USD Opportunity, 2025-2035
  • Figure 14: Latin America Incremental USD Opportunity, 2025-2035
  • Figure 15: Western Europe Incremental USD Opportunity, 2025-2035
  • Figure 16: Eastern Europe Incremental USD Opportunity, 2025-2035
  • Figure 17: East Asia Incremental USD Opportunity, 2025-2035
  • Figure 18: South Asia & Pacific Incremental USD Opportunity, 2025-2035
  • Figure 19: Middle East and Africa Incremental USD Opportunity, 2025-2035
  • Figure 20: North America Value Share and BPS Analysis by Country, 2025 and 2035
  • Figure 21: North America Value Share and BPS Analysis by By Type, 2025 and 2035
  • Figure 22: North America Y-o-Y Growth Comparison by By Type, 2025-2035
  • Figure 23: North America Attractiveness Analysis by By Type
  • Figure 24: North America Value Share and BPS Analysis by By Application, 2025 and 2035
  • Figure 25: North America Y-o-Y Growth Comparison by By Application, 2025-2035
  • Figure 26: North America Attractiveness Analysis by By Application
  • Figure 27: Latin America Value Share and BPS Analysis by Country, 2025 and 2035
  • Figure 28: Latin America Value Share and BPS Analysis by By Type, 2025 and 2035
  • Figure 29: Latin America Y-o-Y Growth Comparison by By Type, 2025-2035
  • Figure 30: Latin America Attractiveness Analysis by By Type
  • Figure 31: Latin America Value Share and BPS Analysis by By Application, 2025 and 2035
  • Figure 32: Latin America Y-o-Y Growth Comparison by By Application, 2025-2035
  • Figure 33: Latin America Attractiveness Analysis by By Application
  • Figure 34: Western Europe Value Share and BPS Analysis by Country, 2025 and 2035
  • Figure 35: Western Europe Value Share and BPS Analysis by By Type, 2025 and 2035
  • Figure 36: Western Europe Y-o-Y Growth Comparison by By Type, 2025-2035
  • Figure 37: Western Europe Attractiveness Analysis by By Type
  • Figure 38: Western Europe Value Share and BPS Analysis by By Application, 2025 and 2035
  • Figure 39: Western Europe Y-o-Y Growth Comparison by By Application, 2025-2035
  • Figure 40: Western Europe Attractiveness Analysis by By Application
  • Figure 41: Eastern Europe Value Share and BPS Analysis by Country, 2025 and 2035
  • Figure 42: Eastern Europe Value Share and BPS Analysis by By Type, 2025 and 2035
  • Figure 43: Eastern Europe Y-o-Y Growth Comparison by By Type, 2025-2035
  • Figure 44: Eastern Europe Attractiveness Analysis by By Type
  • Figure 45: Eastern Europe Value Share and BPS Analysis by By Application, 2025 and 2035
  • Figure 46: Eastern Europe Y-o-Y Growth Comparison by By Application, 2025-2035
  • Figure 47: Eastern Europe Attractiveness Analysis by By Application
  • Figure 48: East Asia Value Share and BPS Analysis by Country, 2025 and 2035
  • Figure 49: East Asia Value Share and BPS Analysis by By Type, 2025 and 2035
  • Figure 50: East Asia Y-o-Y Growth Comparison by By Type, 2025-2035
  • Figure 51: East Asia Attractiveness Analysis by By Type
  • Figure 52: East Asia Value Share and BPS Analysis by By Application, 2025 and 2035
  • Figure 53: East Asia Y-o-Y Growth Comparison by By Application, 2025-2035
  • Figure 54: East Asia Attractiveness Analysis by By Application
  • Figure 55: South Asia & Pacific Value Share and BPS Analysis by Country, 2025 and 2035
  • Figure 56: South Asia & Pacific Value Share and BPS Analysis by By Type, 2025 and 2035
  • Figure 57: South Asia & Pacific Y-o-Y Growth Comparison by By Type, 2025-2035
  • Figure 58: South Asia & Pacific Attractiveness Analysis by By Type
  • Figure 59: South Asia & Pacific Value Share and BPS Analysis by By Application, 2025 and 2035
  • Figure 60: South Asia & Pacific Y-o-Y Growth Comparison by By Application, 2025-2035
  • Figure 61: South Asia & Pacific Attractiveness Analysis by By Application
  • Figure 62: Middle East and Africa Value Share and BPS Analysis by Country, 2025 and 2035
  • Figure 63: Middle East and Africa Value Share and BPS Analysis by By Type, 2025 and 2035
  • Figure 64: Middle East and Africa Y-o-Y Growth Comparison by By Type, 2025-2035
  • Figure 65: Middle East and Africa Attractiveness Analysis by By Type
  • Figure 66: Middle East and Africa Value Share and BPS Analysis by By Application, 2025 and 2035
  • Figure 67: Middle East and Africa Y-o-Y Growth Comparison by By Application, 2025-2035
  • Figure 68: Middle East and Africa Attractiveness Analysis by By Application
  • Figure 69: Global - Tier Structure Analysis
  • Figure 70: Global - Company Share Analysis

Frequently Asked Questions

What is the size of the motor generator set market in 2025?

The global market is valued at USD 3.1 billion in 2025.

What is the expected market value of motor generator sets by 2035?

By 2035, the motor generator set market is projected to reach USD 5.1 billion.

What is the CAGR of the motor generator set market from 2025 to 2035?

The market is anticipated to grow at a CAGR of 5.3% during the forecast period.

Which is the leading product in the motor generator set market?

DC to AC motor generator sets are expected to lead the market with a projected 62% share by 2035.

Who are the key players in the motor generator set industry?

Top players include Caterpillar Inc., Cummins Inc., ABB Ltd., General Electric, and Mitsubishi Heavy Industries.

Explore Similar Insights

Future Market Insights

Motor Generator Set Market