Hub Motor Market Size and Share Forecast Outlook From 2024 to 2034

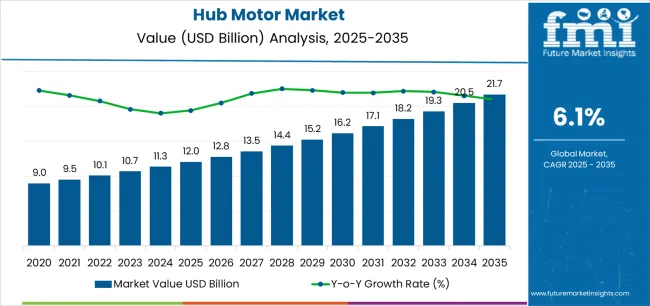
The Hub Motor Market value is estimated to be USD 11.3 billion in 2024. The popularity of electric vehicles (EVs) is rising steadily and is also encouraging the adoption of DIY hub motors for converting conventional bicycles into electric ones.

Sales of electric hub motors are predicted to grow at a CAGR of 6.4% during the forecast period. The global hub motor industry size is estimated to reach a value of USD 21 billion by 2034.

Hub Motor Market Trends & Analysis

  • In keeping with the growing need for convenient and sustainable urban transportation, motorized wheel hubs have become essential components of electric scooters, bicycles, and many other micro-mobility solutions.
  • The demand for portable and lightweight electric mobility is increasing, fueling sales of brushless hub motors, which are built into bicycle wheels and are considered a small and room-saving option.
  • The development of hub motor conversion kits, including linked and intelligent features, is expected to further popularize the market in the coming days.
Report Attribute Details
Hub Motor Market Size (2024) USD 11.3 billion
Anticipated Market Value (2034) USD 21 billion
Projected Growth Rate (2024 to 2034) 6.4% CAGR

Sales Trend Analysis from Historical Performance Compared to Market Outlook for 2024 to 2034

The hub motor market was valued at USD 7.7 billion in 2019. In the following five years, sales of hub motors increased at a CAGR of 8.1% annually.

EV incentives provided by governments in many developing economies also played a significant role in the development of the two-wheeler hub motor market during the historical period. By 2023, the net worth of total hub motors sold globally was USD 10.5 billion.

Attributes Details
Hub Motor Market Value (2019) USD 7.7 billion
Historical Market Revenue (2023) USD 10.5 billion
Historical CAGR (2019 to 2023) 8.1% CAGR

Key Growth Drivers for the Global Hub Motor Market

To fulfill the rising demand for electric mobility, automotive manufacturers are encouraged by national and international organizations. A significant share of this aid is earmarked to be invested in hub motor technology with supportive regulations and incentives in progressive countries.

Constant improvements in hub motor efficiency due to high power density battery technology are expected to popularize the in-hub electric propulsion systems. However, limited sources of lithium and the rising cost of lead-acid batteries are anticipated to be a possible hindrance in the coming days.

Analysis of Top Countries Producing, Regulating, and Utilizing Hub Motors

The table below lists five countries that are expected to be frontrunners in sales of hub motors for mobility scooters.

Regional Market Comparison CAGR (2024 to 2034)
United States 6.7%
Japan 7.9%
United Kingdom 7.5%
South Korea 8.5%
China 6.9%

Higher Research and Development Investments by Manufacturers of Hub Motors in the United States

The United States hub motor market is likely to advance at a rate of 6.7% from 2024 to 2034. The net worth of this regional market is forecasted to reach USD 3.7 billion by 2034.

Some of the prominent reasons that are expected to retain the dominance of the United States in the global market include:

  • Technological progress in geared hub motors and battery materials by market players.
  • Technological developments in the market have helped in the creation of more effective and long-range electric cars.
  • Powerful hub motors with smart features improve the entire user experience and are anticipated to meet the expectations of consumers in the United States.

Strong Environmental Laws Driving Hub Motor Sales in the United Kingdom

Sales of hub motors in the United Kingdom are likely to rise at a 7.5% CAGR from 2024 to 2034. The net worth of the United Kingdom market is expected to reach USD 835.8 million by 2034.

Key factors that are propelling sales of hub motors in the country include:

  • The popularity of e-scooters and e-bikes is growing rapidly in many European countries after the fuel price hike.
  • Environmental sustainability objectives incorporates and educational institute campuses have increased the adoption of hub motors for electric skateboards.
  • Growing demand for connected and intelligent electric personal mobility solutions drives hub motor e-scooter sales.

Expanding Electronics Sector Bolstering Motorcycle Hub Motor Market in China

The production of hub motors in China is expected to surge at a CAGR of 6.9% through 2034. The net worth of the hub motor industry in the country is forecasted to reach USD 3.3 billion by 2034.

Key reasons for the dominance of China in the Asian market include:

  • The quest for economical and efficient mobility is driving up the demand for electric scooter hub motors as average incomes are on the rise in China.
  • Financial incentives for the rural people from the government to buy electric mobility solutions.
  • Chinese manufacturers are focusing on the creation of hub motors with built-in electronics to improve communication and control.

Focus of Japanese Manufacturers on Reducing the Price of Hub Motors

The demand for e-bike hub motors in Japan is expected to rise at a CAGR of 7.9% over the forecast period. The market value is anticipated to reach USD 2.3 billion by 2034.

Prominent factors fueling hub motor sales and supply in Japan include:

  • A greater focus on electric hub motors and motorized wheel hub drive solutions for urban mobility.
  • High-torque hub motors are more popular as they require less maintenance with fewer moving gears.
  • By using innovative and lightweight materials, Japanese manufacturers are increasing the appeal of hub motors in the country.

Popularity of Hub Motors Designed for Noise Reduction in South Korea

The demand for hub motors in South Korea is expected to rise at a lucrative rate of 8.5% through 2034. This regional industry value is projected to reach USD 1.4 billion by 2034.

Key factors driving sales of in-wheel hub motors in South Korea include:

  • South Korean government is promoting greater personal mobility solutions like two-wheelers and three wheelers with hub motor systems.
  • Because of their high performance and compact design, hub motors are the favored alternative for many electric vehicle enthusiasts.
  • The increasing acceptance of micro-mobility solutions as a noise reduction method in Korean cities.

Hub Motor Industry Analysis by Top Investment Segments

Higher Demand for Pedelecs than Electric Scooters and Motorcycles

Attributes Details
Top Product Type Pedelecs
CAGR (2024 to 2034) 6.2%
CAGR (2019 to 2023) 7.9%

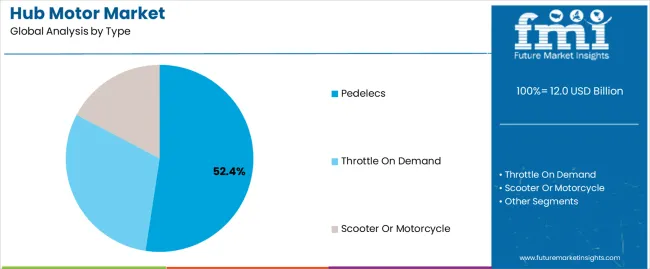
Based on the product type, the pedelecs segment is more popular than other types of direct-drive hub motors. This segment is likely to grow at a CAGR of 6.2% from 2024 to 2034. Key reasons driving the segment’s growth are:

  • The dominance of electric two-wheelers is driving sales of hub motors for bicycles or pedelecs.
  • Growing knowledge of practicality as well as the health advantages of hub motor-based pedelecs.

OEMs Drive Higher Sales of Hub Motors

Attributes Details
Top Sales Channel Type Original Equipment Manufacturer (OEM)
CAGR from 2024 to 2034 6%
CAGR from 2019 to 2023 7.7%

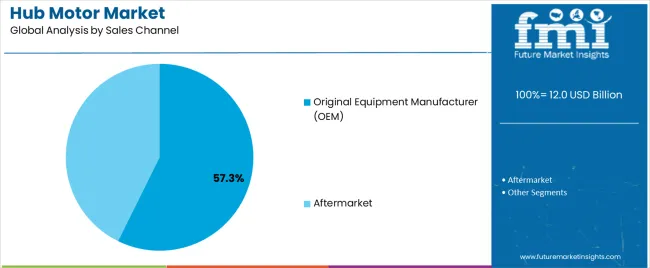
Based on the sales channel, original equipment manufacturers currently achieve more sales of in-wheel motors than other segments. Sales of in-wheel hub motors through OEMs are expected to register a CAGR of 6% from 2024 to 2034.

  • Customers mostly prefer original equipment manufacturers who concentrate on providing hub motor kits and warranty time periods.
  • E-bike companies that maintain the hub motor specifications and performance also go with OEMS to retain their competitiveness in the market.

Leading Suppliers in the Hub Motor Sector

The overall competition in the wheel hub motor market intensified only in the last few years. The rising number of industrial equipment manufacturers entering this sector can be attributed to the vital role that hub motors play in electric bikes and scooters.

On the other hand, exclusive hub motor manufacturers can benefit from partnerships with electric vehicle makers, having the potential for mass manufacturing and distribution.

Recent Developments
  • In February 2023, FLASH established a technological partnership with the European electric vehicle (EV) manufacturing company GEM Motors. Flash is a technology provider and producer of electronic components and aims to strengthen its electric vehicle production capabilities even further with this collaboration. The two firms also aim to produce hub motors for several categories of electric cars, and FLASH hopes to provide customization choices with a power range of 1 kW to 15 kW.
  • In August 2023, Biketec's FIT system and German car supplier Hirschvogel Holding GmbH, better known as Hirschvogel Automotive Group, collaborated to introduce hub motor technology. This partnership is anticipated to strengthen the European e-bike hub motor market through the forecast years.

Notable Players in the Business Landscape

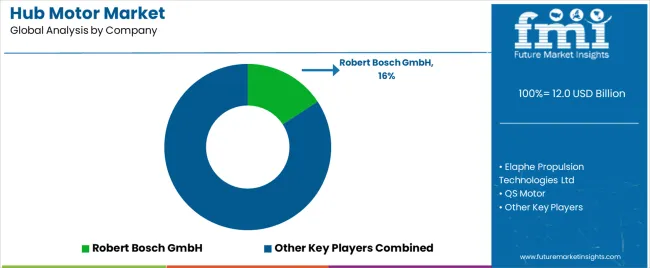
  • Elaphe Propulsion Technologies Ltd.
  • QS Motor
  • TDCM
  • Robert Bosch GmbH
  • MAC Shanghai Electric Motor Company Ltd.

Scope and Coverage of the Hub Motor Market Report

Attribute Details
Estimated Market Size (2024) USD 11.3 billion
Projected Market Size (2034) USD 21 billion
Anticipated Growth Rate (2024 to 2034) 6.4%
Forecast Period 2024 to 2034
Historical Data Available for 2019 to 2023
Market Analysis USD million or billion for Value and Units for Volume
Key Regions Covered North America; Latin America; Europe; Middle East & Africa (MEA); East Asia; South Asia and Oceania
Key Countries Covered United States, Canada, Brazil, Mexico, Germany, Spain, Italy, France, United Kingdom, Russia, China, India, Australia & New Zealand, GCC Countries, and South Africa
Key Segments Covered By Product Type, By Hub Position, By Sales Channel, and By Region
Key Companies Profiled

Elaphe Propulsion Technologies Ltd.; QS Motor; TDCM; Robert Bosch GmbH; MAC Shanghai Electric Motor Company Ltd.

Report Coverage Market Forecast, Company Share Analysis, Competition Intelligence, DROT Analysis, Market Dynamics and Challenges, and Strategic Growth Initiatives
Customization & Pricing Available upon Request

Top Segments Studied in the Hub Motor Market

By Product Type:

  • Pedelecs
  • Throttle on Demand
  • Scooter or Motorcycle

By Hub Position:

  • Front Hub Motor
  • Rear Hub Motor

By Sales Channel:

  • Original Equipment Manufacturer (OEM)
  • Aftermarket

By Region:

  • North America Market
  • Latin America Market
  • Europe Market
  • East Asia Market
  • South Asia and Pacific Market
  • Middle East and Africa (MEA) Market

Table of Content

  • 1. Executive Summary
  • 2. Market Overview
  • 3. Market Background
  • 4. Global Market Analysis 2019 to 2023 and Forecast, 2024 to 2034
  • 5. Global Market Analysis 2019 to 2023 and Forecast 2024 to 2034, By Product Type
    • 5.1. Pedelecs
    • 5.2. Throttle on Demand
    • 5.3. Scooter or Motorcycle
  • 6. Global Market Analysis 2019 to 2023 and Forecast 2024 to 2034, By Sales Channel
    • 6.1. Original equipment manufacturer (OEM)
    • 6.2. Aftermarket
  • 7. Global Market Analysis 2019 to 2023 and Forecast 2024 to 2034, By Position
    • 7.1. Front Hub Motor
    • 7.2. Rear Hub Motor
  • 8. Global Market Analysis 2019 to 2023 and Forecast 2024 to 2034, By Region
    • 8.1. North America
    • 8.2. Latin America
    • 8.3. Europe
    • 8.4. East Asia
    • 8.5. South Asia
    • 8.6. Oceania
    • 8.7. MEA
  • 9. North America Market Analysis 2019 to 2023 and Forecast 2024 to 2034, By Country
  • 10. Latin America Market Analysis 2019 to 2023 and Forecast 2024 to 2034, By Country
  • 11. Europe Market Analysis 2019 to 2023 and Forecast 2024 to 2034, By Country
  • 12. East Asia Market Analysis 2019 to 2023 and Forecast 2024 to 2034, By Country
  • 13. South Asia Market Analysis 2019 to 2023 and Forecast 2024 to 2034, By Country
  • 14. Oceania Market Analysis 2019 to 2023 and Forecast 2024 to 2034, By Country
  • 15. MEA Market Analysis 2019 to 2023 and Forecast 2024 to 2034, By Country
  • 16. Key Countries Market Analysis
  • 17. Market Structure Analysis
  • 18. Competition Analysis
    • 18.1. Elaphe Propulsion Technologies Ltd
    • 18.2. QS Motor
    • 18.3. TDCM
    • 18.4. Robert Bosch GmbH
    • 18.5. MAC Shanghai Electric Motor Company Ltd
    • 18.6. HYUNDAI MOBIS
    • 18.7. Schaeffler Technologies AG & CO. KG
    • 18.8. NTN Corporation
    • 18.9. Accell Group
    • 18.10. Siemens AG
  • 19. Assumptions & Acronyms Used
  • 20. Research Methodology

List of Tables

Table 1: Global Market Value (US$ Million) Forecast by Region, 2019 to 2034

Table 2: Global Market Volume (Units) Forecast by Region, 2019 to 2034

Table 3: Global Market Value (US$ Million) Forecast by Product Type, 2019 to 2034

Table 4: Global Market Volume (Units) Forecast by Product Type, 2019 to 2034

Table 5: Global Market Value (US$ Million) Forecast by Sales Channel, 2019 to 2034

Table 6: Global Market Volume (Units) Forecast by Sales Channel, 2019 to 2034

Table 7: Global Market Value (US$ Million) Forecast by Position, 2019 to 2034

Table 8: Global Market Volume (Units) Forecast by Position, 2019 to 2034

Table 9: North America Market Value (US$ Million) Forecast by Country, 2019 to 2034

Table 10: North America Market Volume (Units) Forecast by Country, 2019 to 2034

Table 11: North America Market Value (US$ Million) Forecast by Product Type, 2019 to 2034

Table 12: North America Market Volume (Units) Forecast by Product Type, 2019 to 2034

Table 13: North America Market Value (US$ Million) Forecast by Sales Channel, 2019 to 2034

Table 14: North America Market Volume (Units) Forecast by Sales Channel, 2019 to 2034

Table 15: North America Market Value (US$ Million) Forecast by Position, 2019 to 2034

Table 16: North America Market Volume (Units) Forecast by Position, 2019 to 2034

Table 17: Latin America Market Value (US$ Million) Forecast by Country, 2019 to 2034

Table 18: Latin America Market Volume (Units) Forecast by Country, 2019 to 2034

Table 19: Latin America Market Value (US$ Million) Forecast by Product Type, 2019 to 2034

Table 20: Latin America Market Volume (Units) Forecast by Product Type, 2019 to 2034

Table 21: Latin America Market Value (US$ Million) Forecast by Sales Channel, 2019 to 2034

Table 22: Latin America Market Volume (Units) Forecast by Sales Channel, 2019 to 2034

Table 23: Latin America Market Value (US$ Million) Forecast by Position, 2019 to 2034

Table 24: Latin America Market Volume (Units) Forecast by Position, 2019 to 2034

Table 25: Europe Market Value (US$ Million) Forecast by Country, 2019 to 2034

Table 26: Europe Market Volume (Units) Forecast by Country, 2019 to 2034

Table 27: Europe Market Value (US$ Million) Forecast by Product Type, 2019 to 2034

Table 28: Europe Market Volume (Units) Forecast by Product Type, 2019 to 2034

Table 29: Europe Market Value (US$ Million) Forecast by Sales Channel, 2019 to 2034

Table 30: Europe Market Volume (Units) Forecast by Sales Channel, 2019 to 2034

Table 31: Europe Market Value (US$ Million) Forecast by Position, 2019 to 2034

Table 32: Europe Market Volume (Units) Forecast by Position, 2019 to 2034

Table 33: East Asia Market Value (US$ Million) Forecast by Country, 2019 to 2034

Table 34: East Asia Market Volume (Units) Forecast by Country, 2019 to 2034

Table 35: East Asia Market Value (US$ Million) Forecast by Product Type, 2019 to 2034

Table 36: East Asia Market Volume (Units) Forecast by Product Type, 2019 to 2034

Table 37: East Asia Market Value (US$ Million) Forecast by Sales Channel, 2019 to 2034

Table 38: East Asia Market Volume (Units) Forecast by Sales Channel, 2019 to 2034

Table 39: East Asia Market Value (US$ Million) Forecast by Position, 2019 to 2034

Table 40: East Asia Market Volume (Units) Forecast by Position, 2019 to 2034

Table 41: South Asia Market Value (US$ Million) Forecast by Country, 2019 to 2034

Table 42: South Asia Market Volume (Units) Forecast by Country, 2019 to 2034

Table 43: South Asia Market Value (US$ Million) Forecast by Product Type, 2019 to 2034

Table 44: South Asia Market Volume (Units) Forecast by Product Type, 2019 to 2034

Table 45: South Asia Market Value (US$ Million) Forecast by Sales Channel, 2019 to 2034

Table 46: South Asia Market Volume (Units) Forecast by Sales Channel, 2019 to 2034

Table 47: South Asia Market Value (US$ Million) Forecast by Position, 2019 to 2034

Table 48: South Asia Market Volume (Units) Forecast by Position, 2019 to 2034

Table 49: Oceania Market Value (US$ Million) Forecast by Country, 2019 to 2034

Table 50: Oceania Market Volume (Units) Forecast by Country, 2019 to 2034

Table 51: Oceania Market Value (US$ Million) Forecast by Product Type, 2019 to 2034

Table 52: Oceania Market Volume (Units) Forecast by Product Type, 2019 to 2034

Table 53: Oceania Market Value (US$ Million) Forecast by Sales Channel, 2019 to 2034

Table 54: Oceania Market Volume (Units) Forecast by Sales Channel, 2019 to 2034

Table 55: Oceania Market Value (US$ Million) Forecast by Position, 2019 to 2034

Table 56: Oceania Market Volume (Units) Forecast by Position, 2019 to 2034

Table 57: MEA Market Value (US$ Million) Forecast by Country, 2019 to 2034

Table 58: MEA Market Volume (Units) Forecast by Country, 2019 to 2034

Table 59: MEA Market Value (US$ Million) Forecast by Product Type, 2019 to 2034

Table 60: MEA Market Volume (Units) Forecast by Product Type, 2019 to 2034

Table 61: MEA Market Value (US$ Million) Forecast by Sales Channel, 2019 to 2034

Table 62: MEA Market Volume (Units) Forecast by Sales Channel, 2019 to 2034

Table 63: MEA Market Value (US$ Million) Forecast by Position, 2019 to 2034

Table 64: MEA Market Volume (Units) Forecast by Position, 2019 to 2034

List of Figures

Figure 1: Global Market Value (US$ Million) by Product Type, 2024 to 2034

Figure 2: Global Market Value (US$ Million) by Sales Channel, 2024 to 2034

Figure 3: Global Market Value (US$ Million) by Position, 2024 to 2034

Figure 4: Global Market Value (US$ Million) by Region, 2024 to 2034

Figure 5: Global Market Value (US$ Million) Analysis by Region, 2019 to 2034

Figure 6: Global Market Volume (Units) Analysis by Region, 2019 to 2034

Figure 7: Global Market Value Share (%) and BPS Analysis by Region, 2024 to 2034

Figure 8: Global Market Y-o-Y Growth (%) Projections by Region, 2024 to 2034

Figure 9: Global Market Value (US$ Million) Analysis by Product Type, 2019 to 2034

Figure 10: Global Market Volume (Units) Analysis by Product Type, 2019 to 2034

Figure 11: Global Market Value Share (%) and BPS Analysis by Product Type, 2024 to 2034

Figure 12: Global Market Y-o-Y Growth (%) Projections by Product Type, 2024 to 2034

Figure 13: Global Market Value (US$ Million) Analysis by Sales Channel, 2019 to 2034

Figure 14: Global Market Volume (Units) Analysis by Sales Channel, 2019 to 2034

Figure 15: Global Market Value Share (%) and BPS Analysis by Sales Channel, 2024 to 2034

Figure 16: Global Market Y-o-Y Growth (%) Projections by Sales Channel, 2024 to 2034

Figure 17: Global Market Value (US$ Million) Analysis by Position, 2019 to 2034

Figure 18: Global Market Volume (Units) Analysis by Position, 2019 to 2034

Figure 19: Global Market Value Share (%) and BPS Analysis by Position, 2024 to 2034

Figure 20: Global Market Y-o-Y Growth (%) Projections by Position, 2024 to 2034

Figure 21: Global Market Attractiveness by Product Type, 2024 to 2034

Figure 22: Global Market Attractiveness by Sales Channel, 2024 to 2034

Figure 23: Global Market Attractiveness by Position, 2024 to 2034

Figure 24: Global Market Attractiveness by Region, 2024 to 2034

Figure 25: North America Market Value (US$ Million) by Product Type, 2024 to 2034

Figure 26: North America Market Value (US$ Million) by Sales Channel, 2024 to 2034

Figure 27: North America Market Value (US$ Million) by Position, 2024 to 2034

Figure 28: North America Market Value (US$ Million) by Country, 2024 to 2034

Figure 29: North America Market Value (US$ Million) Analysis by Country, 2019 to 2034

Figure 30: North America Market Volume (Units) Analysis by Country, 2019 to 2034

Figure 31: North America Market Value Share (%) and BPS Analysis by Country, 2024 to 2034

Figure 32: North America Market Y-o-Y Growth (%) Projections by Country, 2024 to 2034

Figure 33: North America Market Value (US$ Million) Analysis by Product Type, 2019 to 2034

Figure 34: North America Market Volume (Units) Analysis by Product Type, 2019 to 2034

Figure 35: North America Market Value Share (%) and BPS Analysis by Product Type, 2024 to 2034

Figure 36: North America Market Y-o-Y Growth (%) Projections by Product Type, 2024 to 2034

Figure 37: North America Market Value (US$ Million) Analysis by Sales Channel, 2019 to 2034

Figure 38: North America Market Volume (Units) Analysis by Sales Channel, 2019 to 2034

Figure 39: North America Market Value Share (%) and BPS Analysis by Sales Channel, 2024 to 2034

Figure 40: North America Market Y-o-Y Growth (%) Projections by Sales Channel, 2024 to 2034

Figure 41: North America Market Value (US$ Million) Analysis by Position, 2019 to 2034

Figure 42: North America Market Volume (Units) Analysis by Position, 2019 to 2034

Figure 43: North America Market Value Share (%) and BPS Analysis by Position, 2024 to 2034

Figure 44: North America Market Y-o-Y Growth (%) Projections by Position, 2024 to 2034

Figure 45: North America Market Attractiveness by Product Type, 2024 to 2034

Figure 46: North America Market Attractiveness by Sales Channel, 2024 to 2034

Figure 47: North America Market Attractiveness by Position, 2024 to 2034

Figure 48: North America Market Attractiveness by Country, 2024 to 2034

Figure 49: Latin America Market Value (US$ Million) by Product Type, 2024 to 2034

Figure 50: Latin America Market Value (US$ Million) by Sales Channel, 2024 to 2034

Figure 51: Latin America Market Value (US$ Million) by Position, 2024 to 2034

Figure 52: Latin America Market Value (US$ Million) by Country, 2024 to 2034

Figure 53: Latin America Market Value (US$ Million) Analysis by Country, 2019 to 2034

Figure 54: Latin America Market Volume (Units) Analysis by Country, 2019 to 2034

Figure 55: Latin America Market Value Share (%) and BPS Analysis by Country, 2024 to 2034

Figure 56: Latin America Market Y-o-Y Growth (%) Projections by Country, 2024 to 2034

Figure 57: Latin America Market Value (US$ Million) Analysis by Product Type, 2019 to 2034

Figure 58: Latin America Market Volume (Units) Analysis by Product Type, 2019 to 2034

Figure 59: Latin America Market Value Share (%) and BPS Analysis by Product Type, 2024 to 2034

Figure 60: Latin America Market Y-o-Y Growth (%) Projections by Product Type, 2024 to 2034

Figure 61: Latin America Market Value (US$ Million) Analysis by Sales Channel, 2019 to 2034

Figure 62: Latin America Market Volume (Units) Analysis by Sales Channel, 2019 to 2034

Figure 63: Latin America Market Value Share (%) and BPS Analysis by Sales Channel, 2024 to 2034

Figure 64: Latin America Market Y-o-Y Growth (%) Projections by Sales Channel, 2024 to 2034

Figure 65: Latin America Market Value (US$ Million) Analysis by Position, 2019 to 2034

Figure 66: Latin America Market Volume (Units) Analysis by Position, 2019 to 2034

Figure 67: Latin America Market Value Share (%) and BPS Analysis by Position, 2024 to 2034

Figure 68: Latin America Market Y-o-Y Growth (%) Projections by Position, 2024 to 2034

Figure 69: Latin America Market Attractiveness by Product Type, 2024 to 2034

Figure 70: Latin America Market Attractiveness by Sales Channel, 2024 to 2034

Figure 71: Latin America Market Attractiveness by Position, 2024 to 2034

Figure 72: Latin America Market Attractiveness by Country, 2024 to 2034

Figure 73: Europe Market Value (US$ Million) by Product Type, 2024 to 2034

Figure 74: Europe Market Value (US$ Million) by Sales Channel, 2024 to 2034

Figure 75: Europe Market Value (US$ Million) by Position, 2024 to 2034

Figure 76: Europe Market Value (US$ Million) by Country, 2024 to 2034

Figure 77: Europe Market Value (US$ Million) Analysis by Country, 2019 to 2034

Figure 78: Europe Market Volume (Units) Analysis by Country, 2019 to 2034

Figure 79: Europe Market Value Share (%) and BPS Analysis by Country, 2024 to 2034

Figure 80: Europe Market Y-o-Y Growth (%) Projections by Country, 2024 to 2034

Figure 81: Europe Market Value (US$ Million) Analysis by Product Type, 2019 to 2034

Figure 82: Europe Market Volume (Units) Analysis by Product Type, 2019 to 2034

Figure 83: Europe Market Value Share (%) and BPS Analysis by Product Type, 2024 to 2034

Figure 84: Europe Market Y-o-Y Growth (%) Projections by Product Type, 2024 to 2034

Figure 85: Europe Market Value (US$ Million) Analysis by Sales Channel, 2019 to 2034

Figure 86: Europe Market Volume (Units) Analysis by Sales Channel, 2019 to 2034

Figure 87: Europe Market Value Share (%) and BPS Analysis by Sales Channel, 2024 to 2034

Figure 88: Europe Market Y-o-Y Growth (%) Projections by Sales Channel, 2024 to 2034

Figure 89: Europe Market Value (US$ Million) Analysis by Position, 2019 to 2034

Figure 90: Europe Market Volume (Units) Analysis by Position, 2019 to 2034

Figure 91: Europe Market Value Share (%) and BPS Analysis by Position, 2024 to 2034

Figure 92: Europe Market Y-o-Y Growth (%) Projections by Position, 2024 to 2034

Figure 93: Europe Market Attractiveness by Product Type, 2024 to 2034

Figure 94: Europe Market Attractiveness by Sales Channel, 2024 to 2034

Figure 95: Europe Market Attractiveness by Position, 2024 to 2034

Figure 96: Europe Market Attractiveness by Country, 2024 to 2034

Figure 97: East Asia Market Value (US$ Million) by Product Type, 2024 to 2034

Figure 98: East Asia Market Value (US$ Million) by Sales Channel, 2024 to 2034

Figure 99: East Asia Market Value (US$ Million) by Position, 2024 to 2034

Figure 100: East Asia Market Value (US$ Million) by Country, 2024 to 2034

Figure 101: East Asia Market Value (US$ Million) Analysis by Country, 2019 to 2034

Figure 102: East Asia Market Volume (Units) Analysis by Country, 2019 to 2034

Figure 103: East Asia Market Value Share (%) and BPS Analysis by Country, 2024 to 2034

Figure 104: East Asia Market Y-o-Y Growth (%) Projections by Country, 2024 to 2034

Figure 105: East Asia Market Value (US$ Million) Analysis by Product Type, 2019 to 2034

Figure 106: East Asia Market Volume (Units) Analysis by Product Type, 2019 to 2034

Figure 107: East Asia Market Value Share (%) and BPS Analysis by Product Type, 2024 to 2034

Figure 108: East Asia Market Y-o-Y Growth (%) Projections by Product Type, 2024 to 2034

Figure 109: East Asia Market Value (US$ Million) Analysis by Sales Channel, 2019 to 2034

Figure 110: East Asia Market Volume (Units) Analysis by Sales Channel, 2019 to 2034

Figure 111: East Asia Market Value Share (%) and BPS Analysis by Sales Channel, 2024 to 2034

Figure 112: East Asia Market Y-o-Y Growth (%) Projections by Sales Channel, 2024 to 2034

Figure 113: East Asia Market Value (US$ Million) Analysis by Position, 2019 to 2034

Figure 114: East Asia Market Volume (Units) Analysis by Position, 2019 to 2034

Figure 115: East Asia Market Value Share (%) and BPS Analysis by Position, 2024 to 2034

Figure 116: East Asia Market Y-o-Y Growth (%) Projections by Position, 2024 to 2034

Figure 117: East Asia Market Attractiveness by Product Type, 2024 to 2034

Figure 118: East Asia Market Attractiveness by Sales Channel, 2024 to 2034

Figure 119: East Asia Market Attractiveness by Position, 2024 to 2034

Figure 120: East Asia Market Attractiveness by Country, 2024 to 2034

Figure 121: South Asia Market Value (US$ Million) by Product Type, 2024 to 2034

Figure 122: South Asia Market Value (US$ Million) by Sales Channel, 2024 to 2034

Figure 123: South Asia Market Value (US$ Million) by Position, 2024 to 2034

Figure 124: South Asia Market Value (US$ Million) by Country, 2024 to 2034

Figure 125: South Asia Market Value (US$ Million) Analysis by Country, 2019 to 2034

Figure 126: South Asia Market Volume (Units) Analysis by Country, 2019 to 2034

Figure 127: South Asia Market Value Share (%) and BPS Analysis by Country, 2024 to 2034

Figure 128: South Asia Market Y-o-Y Growth (%) Projections by Country, 2024 to 2034

Figure 129: South Asia Market Value (US$ Million) Analysis by Product Type, 2019 to 2034

Figure 130: South Asia Market Volume (Units) Analysis by Product Type, 2019 to 2034

Figure 131: South Asia Market Value Share (%) and BPS Analysis by Product Type, 2024 to 2034

Figure 132: South Asia Market Y-o-Y Growth (%) Projections by Product Type, 2024 to 2034

Figure 133: South Asia Market Value (US$ Million) Analysis by Sales Channel, 2019 to 2034

Figure 134: South Asia Market Volume (Units) Analysis by Sales Channel, 2019 to 2034

Figure 135: South Asia Market Value Share (%) and BPS Analysis by Sales Channel, 2024 to 2034

Figure 136: South Asia Market Y-o-Y Growth (%) Projections by Sales Channel, 2024 to 2034

Figure 137: South Asia Market Value (US$ Million) Analysis by Position, 2019 to 2034

Figure 138: South Asia Market Volume (Units) Analysis by Position, 2019 to 2034

Figure 139: South Asia Market Value Share (%) and BPS Analysis by Position, 2024 to 2034

Figure 140: South Asia Market Y-o-Y Growth (%) Projections by Position, 2024 to 2034

Figure 141: South Asia Market Attractiveness by Product Type, 2024 to 2034

Figure 142: South Asia Market Attractiveness by Sales Channel, 2024 to 2034

Figure 143: South Asia Market Attractiveness by Position, 2024 to 2034

Figure 144: South Asia Market Attractiveness by Country, 2024 to 2034

Figure 145: Oceania Market Value (US$ Million) by Product Type, 2024 to 2034

Figure 146: Oceania Market Value (US$ Million) by Sales Channel, 2024 to 2034

Figure 147: Oceania Market Value (US$ Million) by Position, 2024 to 2034

Figure 148: Oceania Market Value (US$ Million) by Country, 2024 to 2034

Figure 149: Oceania Market Value (US$ Million) Analysis by Country, 2019 to 2034

Figure 150: Oceania Market Volume (Units) Analysis by Country, 2019 to 2034

Figure 151: Oceania Market Value Share (%) and BPS Analysis by Country, 2024 to 2034

Figure 152: Oceania Market Y-o-Y Growth (%) Projections by Country, 2024 to 2034

Figure 153: Oceania Market Value (US$ Million) Analysis by Product Type, 2019 to 2034

Figure 154: Oceania Market Volume (Units) Analysis by Product Type, 2019 to 2034

Figure 155: Oceania Market Value Share (%) and BPS Analysis by Product Type, 2024 to 2034

Figure 156: Oceania Market Y-o-Y Growth (%) Projections by Product Type, 2024 to 2034

Figure 157: Oceania Market Value (US$ Million) Analysis by Sales Channel, 2019 to 2034

Figure 158: Oceania Market Volume (Units) Analysis by Sales Channel, 2019 to 2034

Figure 159: Oceania Market Value Share (%) and BPS Analysis by Sales Channel, 2024 to 2034

Figure 160: Oceania Market Y-o-Y Growth (%) Projections by Sales Channel, 2024 to 2034

Figure 161: Oceania Market Value (US$ Million) Analysis by Position, 2019 to 2034

Figure 162: Oceania Market Volume (Units) Analysis by Position, 2019 to 2034

Figure 163: Oceania Market Value Share (%) and BPS Analysis by Position, 2024 to 2034

Figure 164: Oceania Market Y-o-Y Growth (%) Projections by Position, 2024 to 2034

Figure 165: Oceania Market Attractiveness by Product Type, 2024 to 2034

Figure 166: Oceania Market Attractiveness by Sales Channel, 2024 to 2034

Figure 167: Oceania Market Attractiveness by Position, 2024 to 2034

Figure 168: Oceania Market Attractiveness by Country, 2024 to 2034

Figure 169: MEA Market Value (US$ Million) by Product Type, 2024 to 2034

Figure 170: MEA Market Value (US$ Million) by Sales Channel, 2024 to 2034

Figure 171: MEA Market Value (US$ Million) by Position, 2024 to 2034

Figure 172: MEA Market Value (US$ Million) by Country, 2024 to 2034

Figure 173: MEA Market Value (US$ Million) Analysis by Country, 2019 to 2034

Figure 174: MEA Market Volume (Units) Analysis by Country, 2019 to 2034

Figure 175: MEA Market Value Share (%) and BPS Analysis by Country, 2024 to 2034

Figure 176: MEA Market Y-o-Y Growth (%) Projections by Country, 2024 to 2034

Figure 177: MEA Market Value (US$ Million) Analysis by Product Type, 2019 to 2034

Figure 178: MEA Market Volume (Units) Analysis by Product Type, 2019 to 2034

Figure 179: MEA Market Value Share (%) and BPS Analysis by Product Type, 2024 to 2034

Figure 180: MEA Market Y-o-Y Growth (%) Projections by Product Type, 2024 to 2034

Figure 181: MEA Market Value (US$ Million) Analysis by Sales Channel, 2019 to 2034

Figure 182: MEA Market Volume (Units) Analysis by Sales Channel, 2019 to 2034

Figure 183: MEA Market Value Share (%) and BPS Analysis by Sales Channel, 2024 to 2034

Figure 184: MEA Market Y-o-Y Growth (%) Projections by Sales Channel, 2024 to 2034

Figure 185: MEA Market Value (US$ Million) Analysis by Position, 2019 to 2034

Figure 186: MEA Market Volume (Units) Analysis by Position, 2019 to 2034

Figure 187: MEA Market Value Share (%) and BPS Analysis by Position, 2024 to 2034

Figure 188: MEA Market Y-o-Y Growth (%) Projections by Position, 2024 to 2034

Figure 189: MEA Market Attractiveness by Product Type, 2024 to 2034

Figure 190: MEA Market Attractiveness by Sales Channel, 2024 to 2034

Figure 191: MEA Market Attractiveness by Position, 2024 to 2034

Figure 192: MEA Market Attractiveness by Country, 2024 to 2034

Frequently Asked Questions

How Big is the Hub Motor Market in 2024?

The hub motor market is estimated to be around USD 11.3 billion in 2024.

What is the Growth Outlook of the Market?

The market is set to grow at a 6.4% CAGR over the forecast period.

What is the Projected Value of the Market by 2033?

The market is predicted to be valued at USD 21 billion by 2034.

What was the Historical Size of the Market?

The market was valued at USD 7.7 billion in 2019.

Which Country Dominates the Global Hub Motor Market?

The United States accounts for nearly 18% of the revenue share of the global market.

Which Regional Market is Expected to Lead Over the Forecast Period?

South Korea is predicted to witness a CAGR of 8.5% through 2034.

Explore Similar Insights

Future Market Insights

Hub Motor Market