The global motor winding repair service market will grow steadily from 2025 through 2035 due to the necessity to prolong the life of industrial motors, reduce unplanned downtime, and reduce capital spend on motor replacement. Motor winding repair is rewinding or refurbishment of the electric motor coils, a mission-critical process for manufacturing, utilities, mining, HVAC, and oil & gas industries.
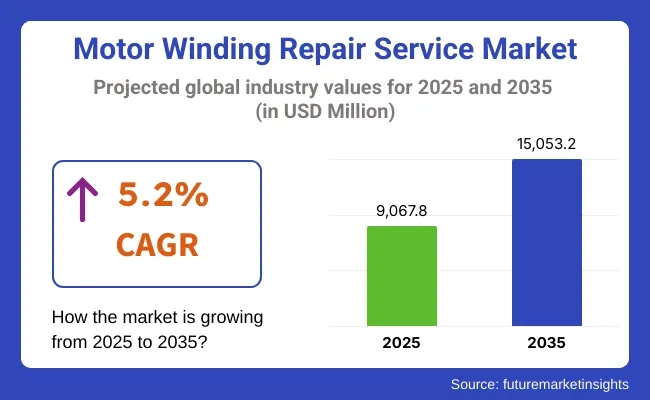
As older equipment becomes dominant in most sectors and there is significantly more pressure on cost-effective maintenance, high-quality motor winding service is in higher demand. The market is projected to be USD 9,067.8 million in 2025 and will expand to USD 15,053.2 million by 2035 with a CAGR of 5.2%.

| Metric | Value |
|---|---|
| Market Size in 2025 | USD 9,067.8 million |
| Projected Market Size in 2035 | USD 15,053.2 million |
| CAGR (2025 to 2035) | 5.2% |
Technological innovations in insulating materials, automated testing equipment, and thermal imaging diagnostics are leading to improved service reliability and response time. Furthermore, with increasing energy costs and carbon reduction initiatives, companies are emphasizing motor efficiency, with periodic rewinding and refurbishing becoming an economical option compared to outright replacement.

| Type | Market Share (2025) |
|---|---|
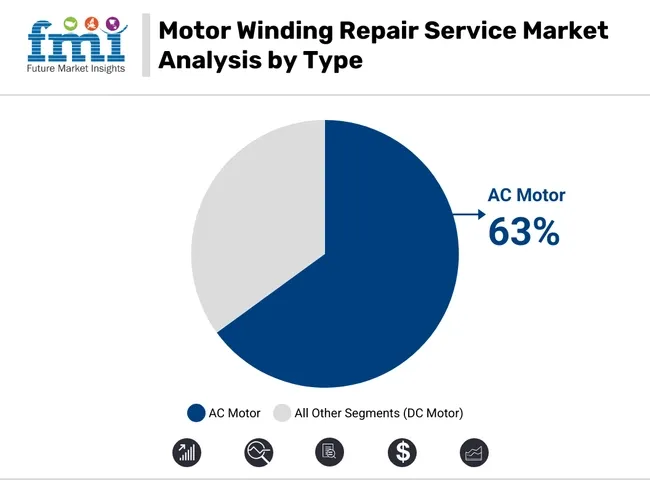
| AC Motor | 63% |
AC motors will continue to be the largest customer base for motor rewind repair services in 2025 with 63% market share since they are extensively utilized within HVAC machinery, industrial equipment, and household appliances. Motors form a crucial element of diverse activities such as regulating temperature levels within structures to powering bulky heavy machinery within manufacturing facilities.
AC motors, over time, experience wear and tear in the form of breakdown of insulation, over-heating, and winding faults that need professional refurbishment and rewinding work. Major service outlets, even a few belonging to the likes of Siemens and ABB, perform substantial volumes of AC motor repairs in industries like manufacturing and power.
The recurring requirement of such repairs guarantees constant demand for winding services to sustain the market growth as industries continue to depend on AC motors for routine operations.
| Application | Market Share (2025) |
|---|---|
| Power Generation Industry | 34% |
The industry of power generation is going to be the market leader in the motor winding repair service business in 2025, with heavy emphasis on nuclear, fossil, and hydroelectric power plants holding 34% of the market share. Such power plants rely on the seamless operation of motors driving critical applications like feedwater pumps and cooling systems. Preventing expensive downtime, maintenance activities such as rewinding motors become imperative.
Large induction motors powering feedwater pumps in fossil power plants, for instance, are typically subjected to routine rewinding for efficiency and reliability. Organizations such as Sulzer and Integrated Power Services are engaged in offering such basic repair services to power plants that enable them to achieve operating continuity and compliance with performance levels. With the increasing need for continuous, efficient power generation, motor winding repair services in the power generation sector will continue to prosper.
Challenges: Shortage of Skilled Labor, Variability in Quality, and Service Downtime
The industry is plagued with a lack of experienced technicians and mixed service quality with small providers. Ineffective rewinding can decrease motor efficiency or reduce lifespan, causing distrust. Furthermore, prolonged repair downtime has the potential to discourage industries from choosing off-site servicing.
Opportunities: Energy Efficiency Compliance, Condition Monitoring, and Remote Diagnostics
Chances exist to provide energy-efficient rewinding following IEC and NEMA guidelines to enable clients to achieve regulatory objectives. Condition monitoring equipment, remote diagnosis, and thermal profiling facilitate the examination of winding deterioration prior to failure for active service applications. OEM collaborations and equipment-as-a-service suppliers are generating new pools of revenue.

In the USA, the market is growing due to aging motor fleets across manufacturing and water treatment facilities. Service providers are partnering with utilities to implement certified rewinding standards that reduce core losses and improve motor energy ratings. Demand for UL-approved motor repair and testing is rising across municipal and utility sectors.
| Country | CAGR (2025 to 2035) |
|---|---|
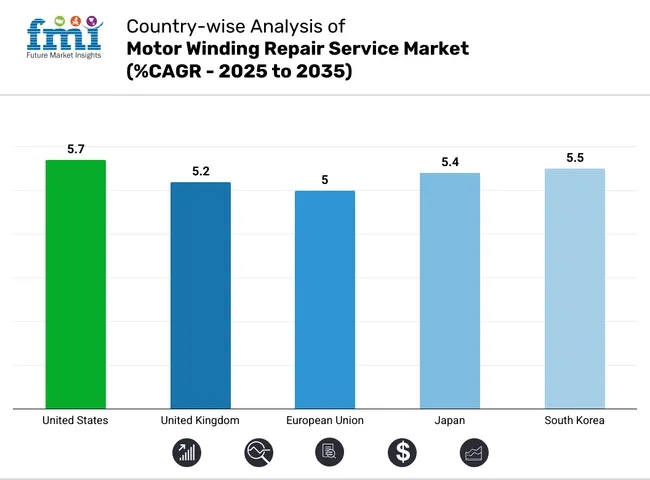
| USA | 5.7% |
UK-based industrial clients are relying more on rewind services as part of carbon reduction strategies. Food, rail, and utilities sectors are adopting energy-efficient rewind protocols to extend motor life while complying with ESOS (Energy Savings Opportunity Scheme). Tier-2 cities are fueling demand for emergency repair contracts and mobile rewind units.
| Country | CAGR (2025 to 2035) |
|---|---|
| UK | 5.2% |
Across the EU, strict energy performance mandates under the Eco design directive are compelling industrial operators to ensure rewound motors meet or exceed IE2/IE3 standards. Germany and France are leading in motor repair automation, while Eastern European countries are expanding outsourced rewinding networks for small and medium enterprises.
| Region | CAGR (2025 to 2035) |
|---|---|
| European Union (EU) | 5.0% |
Japan’s demand for precision rewind services is driven by its automation-heavy industries. Electric motor repair in robotics, elevator systems, and high-speed machinery involves advanced coil profiling and non-contact thermal diagnostics. Service providers are integrating with OEMs to offer warranty-aligned rewinding for high-speed synchronous motors.
| Country | CAGR (2025 to 2035) |
|---|---|
| Japan | 5.4% |
South Korea is expanding its motor winding service sector in tandem with growth in EV component manufacturing and semiconductor plant operations. The market benefits from government incentives for sustainable repair over replacement. Motor rewind services with rapid core loss testing and automated rebalancing are being adopted by Tier-1 industrial players.
| Country | CAGR (2025 to 2035) |
|---|---|
| South Korea | 5.5% |
The motor winding repair service market is increasing steadily due to the increasing reliance on electric motors in industries such as oil & gas, automotive, power generation, and manufacturing. Emphasis on preventive maintenance, energy efficiency, and prolongation of equipment life in service has also fueled demand for motor winding repair services.

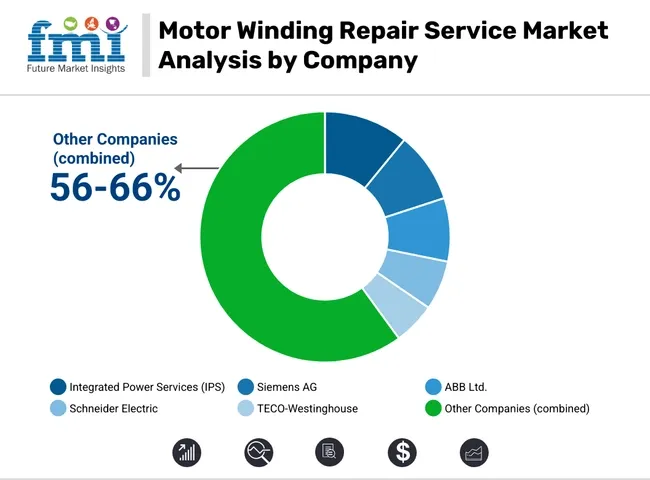
Integrated Power Services (IPS) (10-12%)
IPS leads the pack with its extensive service facility presence and emphasis on quick response. Its AI diagnostics investment renders it the industry leader in predictive maintenance solutions.
Siemens AG (8-10%)
Siemens employs its technical expertise to provide green solutions and remote monitoring with emphasis on efficiency and sustainability in the repair service of motors.
ABB Ltd. (7-9%)
ABB embeds data analysis and IoT into repair solutions and offers customers real-time insights and full training to enable in-house maintenance capabilities.
Schneider Electric (5-7%)
Schneider Electric emphasizes modular solutions and long-term partnerships, especially in the renewable energy market, to respond to changing market needs.
TECO-Westinghouse (4-6%)
TECO-Westinghouse is strong in heavy industry solutions with quality material and on-site solutions to reduce downtime and optimize motor performance.
Other Key Players (56-66% Combined)
The motor winding repair service market was valued at approximately USD 9,067.8 million in 2025.
The market is projected to reach around USD 15,053.2 million by 2035.
Key drivers include the increasing importance of preventive maintenance, growing energy efficiency concerns, longer motor lifespans, and the rising trend of automation and industrial modernization.
The leading countries in this market are the United States, China, Germany, Japan, and India.
The industrial segment, particularly in power generation, holds a significant share in the market.
Table 1: Global Market Value (US$ Million) Forecast by Region, 2017 to 2032
Table 2: Global Market Value (US$ Million) Forecast by Type, 2017 to 2032
Table 3: Global Market Value (US$ Million) Forecast by Power Output, 2017 to 2032
Table 4: Global Market Value (US$ Million) Forecast by End-User, 2017 to 2032
Table 5: North America Market Value (US$ Million) Forecast by Country, 2017 to 2032
Table 6: North America Market Value (US$ Million) Forecast by Type, 2017 to 2032
Table 7: North America Market Value (US$ Million) Forecast by Power Output, 2017 to 2032
Table 8: North America Market Value (US$ Million) Forecast by End-User, 2017 to 2032
Table 9: Latin America Market Value (US$ Million) Forecast by Country, 2017 to 2032
Table 10: Latin America Market Value (US$ Million) Forecast by Type, 2017 to 2032
Table 11: Latin America Market Value (US$ Million) Forecast by Power Output, 2017 to 2032
Table 12: Latin America Market Value (US$ Million) Forecast by End-User, 2017 to 2032
Table 13: Europe Market Value (US$ Million) Forecast by Country, 2017 to 2032
Table 14: Europe Market Value (US$ Million) Forecast by Type, 2017 to 2032
Table 15: Europe Market Value (US$ Million) Forecast by Power Output, 2017 to 2032
Table 16: Europe Market Value (US$ Million) Forecast by End-User, 2017 to 2032
Table 17: Asia Pacific Market Value (US$ Million) Forecast by Country, 2017 to 2032
Table 18: Asia Pacific Market Value (US$ Million) Forecast by Type, 2017 to 2032
Table 19: Asia Pacific Market Value (US$ Million) Forecast by Power Output, 2017 to 2032
Table 20: Asia Pacific Market Value (US$ Million) Forecast by End-User, 2017 to 2032
Table 21: MEA Market Value (US$ Million) Forecast by Country, 2017 to 2032
Table 22: MEA Market Value (US$ Million) Forecast by Type, 2017 to 2032
Table 23: MEA Market Value (US$ Million) Forecast by Power Output, 2017 to 2032
Table 24: MEA Market Value (US$ Million) Forecast by End-User, 2017 to 2032
Figure 1: Global Market Value (US$ Million) by Type, 2022 to 2032
Figure 2: Global Market Value (US$ Million) by Power Output, 2022 to 2032
Figure 3: Global Market Value (US$ Million) by End-User, 2022 to 2032
Figure 4: Global Market Value (US$ Million) by Region, 2022 to 2032
Figure 5: Global Market Value (US$ Million) Analysis by Region, 2017 to 2032
Figure 6: Global Market Value Share (%) and BPS Analysis by Region, 2022 to 2032
Figure 7: Global Market Y-o-Y Growth (%) Projections by Region, 2022 to 2032
Figure 8: Global Market Value (US$ Million) Analysis by Type, 2017 to 2032
Figure 9: Global Market Value Share (%) and BPS Analysis by Type, 2022 to 2032
Figure 10: Global Market Y-o-Y Growth (%) Projections by Type, 2022 to 2032
Figure 11: Global Market Value (US$ Million) Analysis by Power Output, 2017 to 2032
Figure 12: Global Market Value Share (%) and BPS Analysis by Power Output, 2022 to 2032
Figure 13: Global Market Y-o-Y Growth (%) Projections by Power Output, 2022 to 2032
Figure 14: Global Market Value (US$ Million) Analysis by End-User, 2017 to 2032
Figure 15: Global Market Value Share (%) and BPS Analysis by End-User, 2022 to 2032
Figure 16: Global Market Y-o-Y Growth (%) Projections by End-User, 2022 to 2032
Figure 17: Global Market Attractiveness by Type, 2022 to 2032
Figure 18: Global Market Attractiveness by Power Output, 2022 to 2032
Figure 19: Global Market Attractiveness by End-User, 2022 to 2032
Figure 20: Global Market Attractiveness by Region, 2022 to 2032
Figure 21: North America Market Value (US$ Million) by Type, 2022 to 2032
Figure 22: North America Market Value (US$ Million) by Power Output, 2022 to 2032
Figure 23: North America Market Value (US$ Million) by End-User, 2022 to 2032
Figure 24: North America Market Value (US$ Million) by Country, 2022 to 2032
Figure 25: North America Market Value (US$ Million) Analysis by Country, 2017 to 2032
Figure 26: North America Market Value Share (%) and BPS Analysis by Country, 2022 to 2032
Figure 27: North America Market Y-o-Y Growth (%) Projections by Country, 2022 to 2032
Figure 28: North America Market Value (US$ Million) Analysis by Type, 2017 to 2032
Figure 29: North America Market Value Share (%) and BPS Analysis by Type, 2022 to 2032
Figure 30: North America Market Y-o-Y Growth (%) Projections by Type, 2022 to 2032
Figure 31: North America Market Value (US$ Million) Analysis by Power Output, 2017 to 2032
Figure 32: North America Market Value Share (%) and BPS Analysis by Power Output, 2022 to 2032
Figure 33: North America Market Y-o-Y Growth (%) Projections by Power Output, 2022 to 2032
Figure 34: North America Market Value (US$ Million) Analysis by End-User, 2017 to 2032
Figure 35: North America Market Value Share (%) and BPS Analysis by End-User, 2022 to 2032
Figure 36: North America Market Y-o-Y Growth (%) Projections by End-User, 2022 to 2032
Figure 37: North America Market Attractiveness by Type, 2022 to 2032
Figure 38: North America Market Attractiveness by Power Output, 2022 to 2032
Figure 39: North America Market Attractiveness by End-User, 2022 to 2032
Figure 40: North America Market Attractiveness by Country, 2022 to 2032
Figure 41: Latin America Market Value (US$ Million) by Type, 2022 to 2032
Figure 42: Latin America Market Value (US$ Million) by Power Output, 2022 to 2032
Figure 43: Latin America Market Value (US$ Million) by End-User, 2022 to 2032
Figure 44: Latin America Market Value (US$ Million) by Country, 2022 to 2032
Figure 45: Latin America Market Value (US$ Million) Analysis by Country, 2017 to 2032
Figure 46: Latin America Market Value Share (%) and BPS Analysis by Country, 2022 to 2032
Figure 47: Latin America Market Y-o-Y Growth (%) Projections by Country, 2022 to 2032
Figure 48: Latin America Market Value (US$ Million) Analysis by Type, 2017 to 2032
Figure 49: Latin America Market Value Share (%) and BPS Analysis by Type, 2022 to 2032
Figure 50: Latin America Market Y-o-Y Growth (%) Projections by Type, 2022 to 2032
Figure 51: Latin America Market Value (US$ Million) Analysis by Power Output, 2017 to 2032
Figure 52: Latin America Market Value Share (%) and BPS Analysis by Power Output, 2022 to 2032
Figure 53: Latin America Market Y-o-Y Growth (%) Projections by Power Output, 2022 to 2032
Figure 54: Latin America Market Value (US$ Million) Analysis by End-User, 2017 to 2032
Figure 55: Latin America Market Value Share (%) and BPS Analysis by End-User, 2022 to 2032
Figure 56: Latin America Market Y-o-Y Growth (%) Projections by End-User, 2022 to 2032
Figure 57: Latin America Market Attractiveness by Type, 2022 to 2032
Figure 58: Latin America Market Attractiveness by Power Output, 2022 to 2032
Figure 59: Latin America Market Attractiveness by End-User, 2022 to 2032
Figure 60: Latin America Market Attractiveness by Country, 2022 to 2032
Figure 61: Europe Market Value (US$ Million) by Type, 2022 to 2032
Figure 62: Europe Market Value (US$ Million) by Power Output, 2022 to 2032
Figure 63: Europe Market Value (US$ Million) by End-User, 2022 to 2032
Figure 64: Europe Market Value (US$ Million) by Country, 2022 to 2032
Figure 65: Europe Market Value (US$ Million) Analysis by Country, 2017 to 2032
Figure 66: Europe Market Value Share (%) and BPS Analysis by Country, 2022 to 2032
Figure 67: Europe Market Y-o-Y Growth (%) Projections by Country, 2022 to 2032
Figure 68: Europe Market Value (US$ Million) Analysis by Type, 2017 to 2032
Figure 69: Europe Market Value Share (%) and BPS Analysis by Type, 2022 to 2032
Figure 70: Europe Market Y-o-Y Growth (%) Projections by Type, 2022 to 2032
Figure 71: Europe Market Value (US$ Million) Analysis by Power Output, 2017 to 2032
Figure 72: Europe Market Value Share (%) and BPS Analysis by Power Output, 2022 to 2032
Figure 73: Europe Market Y-o-Y Growth (%) Projections by Power Output, 2022 to 2032
Figure 74: Europe Market Value (US$ Million) Analysis by End-User, 2017 to 2032
Figure 75: Europe Market Value Share (%) and BPS Analysis by End-User, 2022 to 2032
Figure 76: Europe Market Y-o-Y Growth (%) Projections by End-User, 2022 to 2032
Figure 77: Europe Market Attractiveness by Type, 2022 to 2032
Figure 78: Europe Market Attractiveness by Power Output, 2022 to 2032
Figure 79: Europe Market Attractiveness by End-User, 2022 to 2032
Figure 80: Europe Market Attractiveness by Country, 2022 to 2032
Figure 81: Asia Pacific Market Value (US$ Million) by Type, 2022 to 2032
Figure 82: Asia Pacific Market Value (US$ Million) by Power Output, 2022 to 2032
Figure 83: Asia Pacific Market Value (US$ Million) by End-User, 2022 to 2032
Figure 84: Asia Pacific Market Value (US$ Million) by Country, 2022 to 2032
Figure 85: Asia Pacific Market Value (US$ Million) Analysis by Country, 2017 to 2032
Figure 86: Asia Pacific Market Value Share (%) and BPS Analysis by Country, 2022 to 2032
Figure 87: Asia Pacific Market Y-o-Y Growth (%) Projections by Country, 2022 to 2032
Figure 88: Asia Pacific Market Value (US$ Million) Analysis by Type, 2017 to 2032
Figure 89: Asia Pacific Market Value Share (%) and BPS Analysis by Type, 2022 to 2032
Figure 90: Asia Pacific Market Y-o-Y Growth (%) Projections by Type, 2022 to 2032
Figure 91: Asia Pacific Market Value (US$ Million) Analysis by Power Output, 2017 to 2032
Figure 92: Asia Pacific Market Value Share (%) and BPS Analysis by Power Output, 2022 to 2032
Figure 93: Asia Pacific Market Y-o-Y Growth (%) Projections by Power Output, 2022 to 2032
Figure 94: Asia Pacific Market Value (US$ Million) Analysis by End-User, 2017 to 2032
Figure 95: Asia Pacific Market Value Share (%) and BPS Analysis by End-User, 2022 to 2032
Figure 96: Asia Pacific Market Y-o-Y Growth (%) Projections by End-User, 2022 to 2032
Figure 97: Asia Pacific Market Attractiveness by Type, 2022 to 2032
Figure 98: Asia Pacific Market Attractiveness by Power Output, 2022 to 2032
Figure 99: Asia Pacific Market Attractiveness by End-User, 2022 to 2032
Figure 100: Asia Pacific Market Attractiveness by Country, 2022 to 2032
Figure 101: MEA Market Value (US$ Million) by Type, 2022 to 2032
Figure 102: MEA Market Value (US$ Million) by Power Output, 2022 to 2032
Figure 103: MEA Market Value (US$ Million) by End-User, 2022 to 2032
Figure 104: MEA Market Value (US$ Million) by Country, 2022 to 2032
Figure 105: MEA Market Value (US$ Million) Analysis by Country, 2017 to 2032
Figure 106: MEA Market Value Share (%) and BPS Analysis by Country, 2022 to 2032
Figure 107: MEA Market Y-o-Y Growth (%) Projections by Country, 2022 to 2032
Figure 108: MEA Market Value (US$ Million) Analysis by Type, 2017 to 2032
Figure 109: MEA Market Value Share (%) and BPS Analysis by Type, 2022 to 2032
Figure 110: MEA Market Y-o-Y Growth (%) Projections by Type, 2022 to 2032
Figure 111: MEA Market Value (US$ Million) Analysis by Power Output, 2017 to 2032
Figure 112: MEA Market Value Share (%) and BPS Analysis by Power Output, 2022 to 2032
Figure 113: MEA Market Y-o-Y Growth (%) Projections by Power Output, 2022 to 2032
Figure 114: MEA Market Value (US$ Million) Analysis by End-User, 2017 to 2032
Figure 115: MEA Market Value Share (%) and BPS Analysis by End-User, 2022 to 2032
Figure 116: MEA Market Y-o-Y Growth (%) Projections by End-User, 2022 to 2032
Figure 117: MEA Market Attractiveness by Type, 2022 to 2032
Figure 118: MEA Market Attractiveness by Power Output, 2022 to 2032
Figure 119: MEA Market Attractiveness by End-User, 2022 to 2032
Figure 120: MEA Market Attractiveness by Country, 2022 to 2032


Full Research Suite comprises of:
Market outlook & trends analysis
Interviews & case studies
Strategic recommendations
Vendor profiles & capabilities analysis
5-year forecasts
8 regions and 60+ country-level data splits
Market segment data splits
12 months of continuous data updates
DELIVERED AS:
PDF EXCEL ONLINE
Motor Bearing Market Size and Share Forecast Outlook 2025 to 2035
Motorcycle Fuel Hoses Market Size and Share Forecast Outlook 2025 to 2035
Motorcycle Drive Chain Market Size and Share Forecast Outlook 2025 to 2035
Motorcycle Wheels Market Size and Share Forecast Outlook 2025 to 2035
Motorized Ring Main Unit Market Size and Share Forecast Outlook 2025 to 2035
Motorhome Market Size and Share Forecast Outlook 2025 to 2035
Motor Monitoring Market Size and Share Forecast Outlook 2025 to 2035
Motorcycle Airbag Jacket Market Size and Share Forecast Outlook 2025 to 2035
Motorcycle Helmet Market Size and Share Forecast Outlook 2025 to 2035
Motorcycle Diagnostic Scan Tools Market Size and Share Forecast Outlook 2025 to 2035
Motorized Prosthesis Market Size and Share Forecast Outlook 2025 to 2035
Motorized Pool Tube Market Size and Share Forecast Outlook 2025 to 2035
Motor Generator Set Market Size, Growth, and Forecast 2025 to 2035
Motorized Decoiler Machine Market Growth - Trends & Forecast 2025 to 2035
Motorcycle Chain Market Analysis - Size, Share, and Forecast 2025 to 2035
Motor Protector Market Size, Growth, and Forecast for 2025 to 2035
Motorcycle Suspension System Market Growth - Trends & Forecast 2025 to 2035
Motor Control IC Market by Type, Industry, and Region – Growth, Trends, and Forecast through 2025 to 2035
Motorcycle Lead Acid Battery Market - Trends & Forecast 2025 to 2035
Motor Testing Equipment Market - Growth & Demand 2025 to 2035

Thank you!
You will receive an email from our Business Development Manager. Please be sure to check your SPAM/JUNK folder too.
Chat With
MaRIA