Blood Flow Restriction Bands Market Size and Share Forecast Outlook 2025 to 2035

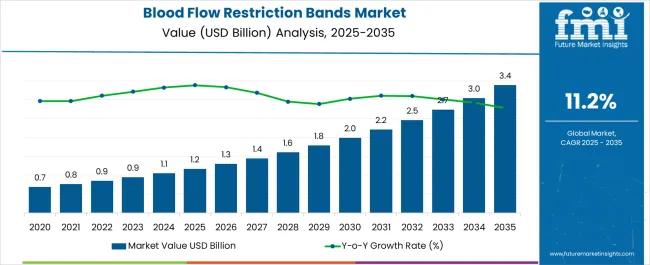
The Blood Flow Restriction Bands Market is estimated to be valued at USD 1.2 billion in 2025 and is projected to reach USD 3.4 billion by 2035, registering a compound annual growth rate (CAGR) of 11.2% over the forecast period.
Quick Stats for Blood Flow Restriction Bands Market

  • Blood Flow Restriction Bands Market Value (2025): USD 1.2 billion
  • Blood Flow Restriction Bands Market Forecast Value (2035): USD 3.4 billion
  • Blood Flow Restriction Bands Market Forecast CAGR: 11.2%
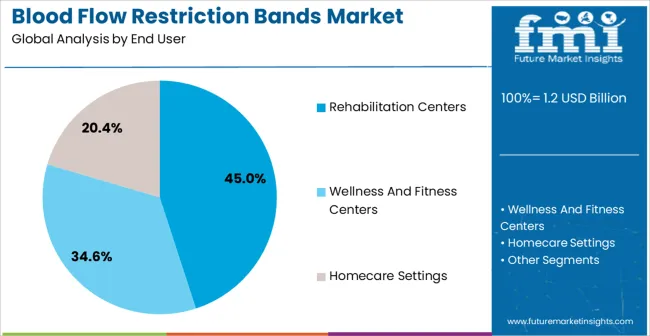
  • Leading Segment in Blood Flow Restriction Bands Market in 2025: Rehabilitation Centers (45.0%)
  • Key Growth Regions in Blood Flow Restriction Bands Market: North America, Asia-Pacific, Europe
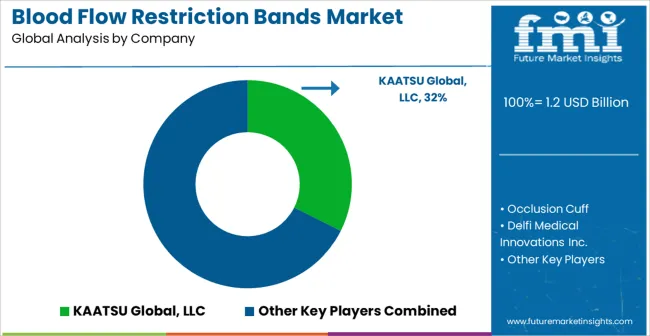
  • Top Key Players in Blood Flow Restriction Bands Market: KAATSU Global, LLC, Occlusion Cuff, Delfi Medical Innovations Inc., Saga Fitness, SmartTools Plus, Fit Cuffs, The X Bands, B Strong

Blood Flow Restriction Bands Market Market Value Analysis

Blood Flow Restriction Bands Market Key Takeaways

Metric Value
Blood Flow Restriction Bands Market Estimated Value in (2025 E) USD 1.2 billion
Blood Flow Restriction Bands Market Forecast Value in (2035 F) USD 3.4 billion
Forecast CAGR (2025 to 2035) 11.2%

Why is the Blood Flow Restriction Bands Market Growing?

The Blood Flow Restriction Bands market is experiencing notable growth due to the increasing adoption of innovative rehabilitation and physiotherapy practices in both clinical and fitness environments. The current market landscape reflects a growing preference for non-invasive, low-intensity training methods that enable muscle strengthening while minimizing risk of injury.

Rising awareness about the effectiveness of blood flow restriction techniques in accelerating recovery, improving strength, and supporting injury prevention has expanded the demand across rehabilitation centers, sports facilities, and clinical therapy settings. Technological advancements in adjustable and safe blood flow restriction bands, combined with increased acceptance by healthcare professionals, are further facilitating market growth.

The focus on personalized recovery programs and the integration of these bands into physiotherapy protocols are also shaping the future market outlook With aging populations and the rising prevalence of musculoskeletal injuries, the market is expected to witness sustained expansion as both rehabilitation professionals and fitness enthusiasts increasingly adopt these bands for safe, effective, and targeted muscle conditioning.

Segmental Analysis

The blood flow restriction bands market is segmented by end user, and geographic regions. By end user, blood flow restriction bands market is divided into Rehabilitation Centers, Wellness And Fitness Centers, and Homecare Settings. Regionally, the blood flow restriction bands industry is classified into North America, Latin America, Western Europe, Eastern Europe, Balkan & Baltic Countries, Russia & Belarus, Central Asia, East Asia, South Asia & Pacific, and the Middle East & Africa.
Insights into the Rehabilitation Centers Segment

Blood Flow Restriction Bands Market Analysis By End User

The Rehabilitation Centers end-use segment is projected to account for 45.00% of the Blood Flow Restriction Bands market revenue in 2025, establishing it as the leading segment. This dominance is being attributed to the widespread adoption of blood flow restriction techniques as part of structured recovery programs for post-surgical patients, injury rehabilitation, and chronic condition management. The growth of this segment has been reinforced by the efficacy of these bands in accelerating muscle hypertrophy, enhancing functional strength, and improving circulation with minimal strain, making them highly suitable for clinical environments.

Rehabilitation professionals increasingly prefer bands that offer precise pressure control and patient safety, facilitating customized therapy regimens. The rising integration of these bands into physiotherapy protocols for both short-term recovery and long-term strength maintenance has also supported market expansion.

Additionally, the segment benefits from institutional investments in modern rehabilitation equipment and the growing emphasis on patient-centered therapy, which allows continuous monitoring and adjustment of blood flow restriction intensity As awareness of the benefits of blood flow restriction continues to spread, the Rehabilitation Centers segment is expected to maintain its leadership position in the market.

Market Overview

Blood Flow Restriction Bands Market Overview

Blood flow restriction bands are devices which are used by the patients who have undergone surgery or any other condition which led to weakened physical strength of limbs to lift the body weight. The use of blood flow restriction bands for is evidence based approach for more benefit to patient with lesser intense physical activity.

Blood flow restriction bands limits the blood flow through the veins but at the same time do not affect the blood flow through arteries. The blood flow restriction bands is tied along waist, or leg or arm depending on the part of body being affected more.

These bands are often used for the blood flow restriction training to increase strength and size of limbs in the athletes as well as in rehabilitating patients. The training or physical activity with blood flow restriction bands as intense as 60% to 80% is equivalent to physical activity without blood flow restriction bands with same benefits.
Analysis of Blood Flow Restriction Bands Market By Key Countries

Blood Flow Restriction Bands Market Cagr Analysis By Country

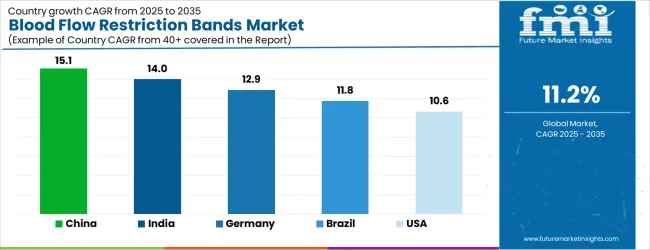
Country CAGR
China 15.1%
India 14.0%
Germany 12.9%
Brazil 11.8%
USA 10.6%
UK 9.5%
Japan 8.4%

Country-wise Analysis

The Blood Flow Restriction Bands Market is expected to register a CAGR of 11.2% during the forecast period, exhibiting varied country level momentum. China leads with the highest CAGR of 15.1%, followed by India at 14.0%. Developed markets such as Germany, France, and the UK continue to expand steadily, while the USA is likely to grow at consistent rates. Japan posts the lowest CAGR at 8.4%, yet still underscores a broadly positive trajectory for the global Blood Flow Restriction Bands Market. In 2024, Germany held a dominant revenue in the Western Europe market and is expected to grow with a CAGR of 12.9%. The USA Blood Flow Restriction Bands Market is estimated to be valued at USD 431.3 million in 2025 and is anticipated to reach a valuation of USD 431.3 million by 2035. Sales are projected to rise at a CAGR of 0.0% over the forecast period between 2025 and 2035. While Japan and South Korea markets are estimated to be valued at USD 55.0 million and USD 36.9 million respectively in 2025.
Key Players in the Blood Flow Restriction Bands Market

Blood Flow Restriction Bands Market Analysis By Company

  • KAATSU Global, LLC
  • Occlusion Cuff
  • Delfi Medical Innovations Inc.
  • Saga Fitness
  • SmartTools Plus
  • Fit Cuffs
  • The X Bands
  • B Strong

Scope of the Report

Item Value
Quantitative Units USD 1.2 Billion
End User Rehabilitation Centers, Wellness And Fitness Centers, and Homecare Settings
Regions Covered North America, Europe, Asia-Pacific, Latin America, Middle East & Africa
Country Covered United States, Canada, Germany, France, United Kingdom, China, Japan, India, Brazil, South Africa
Key Companies Profiled KAATSU Global, LLC, Occlusion Cuff, Delfi Medical Innovations Inc., Saga Fitness, SmartTools Plus, Fit Cuffs, The X Bands, and B Strong

Blood Flow Restriction Bands Market by Segments

End User:

  • Rehabilitation Centers
  • Wellness And Fitness Centers
  • Homecare Settings

Region:

  • North America
    • USA
    • Canada
    • Mexico
  • Latin America
    • Brazil
    • Chile
    • Rest of Latin America
  • Western Europe
    • Germany
    • UK
    • Italy
    • Spain
    • France
    • Nordic
    • BENELUX
    • Rest of Western Europe
  • Eastern Europe
    • Russia
    • Poland
    • Hungary
    • Balkan & Baltic
    • Rest of Eastern Europe
  • East Asia
    • China
    • Japan
    • South Korea
  • South Asia and Pacific
    • India
    • ASEAN
    • Australia & New Zealand
    • Rest of South Asia and Pacific
  • Middle East & Africa
    • Kingdom of Saudi Arabia
    • Other GCC Countries
    • Turkiye
    • South Africa
    • Other African Union
    • Rest of Middle East & Africa

Table of Content

  1. Executive Summary
    • Global Market Outlook
    • Demand-side Trends
    • Supply-side Trends
    • Technology Roadmap Analysis
    • Analysis and Recommendations
  2. Market Overview
    • Market Coverage / Taxonomy
    • Market Definition / Scope / Limitations
  3. Market Background
    • Market Dynamics
      • Drivers
      • Restraints
      • Opportunity
      • Trends
    • Scenario Forecast
      • Demand in Optimistic Scenario
      • Demand in Likely Scenario
      • Demand in Conservative Scenario
    • Opportunity Map Analysis
    • Product Life Cycle Analysis
    • Supply Chain Analysis
    • Investment Feasibility Matrix
    • Value Chain Analysis
    • PESTLE and Porter’s Analysis
    • Regulatory Landscape
    • Regional Parent Market Outlook
    • Production and Consumption Statistics
    • Import and Export Statistics
  4. Global Market Analysis 2020 to 2024 and Forecast, 2025 to 2035
    • Historical Market Size Value (USD Million) Analysis, 2020 to 2024
    • Current and Future Market Size Value (USD Million) Projections, 2025 to 2035
      • Y-o-Y Growth Trend Analysis
      • Absolute $ Opportunity Analysis
  5. Global Market Pricing Analysis 2020 to 2024 and Forecast 2025 to 2035
  6. Global Market Analysis 2020 to 2024 and Forecast 2025 to 2035, By End User
    • Introduction / Key Findings
    • Historical Market Size Value (USD Million) Analysis By End User , 2020 to 2024
    • Current and Future Market Size Value (USD Million) Analysis and Forecast By End User , 2025 to 2035
      • Rehabilitation Centers
      • Wellness And Fitness Centers
      • Homecare Settings
    • Y-o-Y Growth Trend Analysis By End User , 2020 to 2024
    • Absolute $ Opportunity Analysis By End User , 2025 to 2035
  7. Global Market Analysis 2020 to 2024 and Forecast 2025 to 2035, By Region
    • Introduction
    • Historical Market Size Value (USD Million) Analysis By Region, 2020 to 2024
    • Current Market Size Value (USD Million) Analysis and Forecast By Region, 2025 to 2035
      • North America
      • Latin America
      • Western Europe
      • Eastern Europe
      • East Asia
      • South Asia and Pacific
      • Middle East & Africa
    • Market Attractiveness Analysis By Region
  8. North America Market Analysis 2020 to 2024 and Forecast 2025 to 2035, By Country
    • Historical Market Size Value (USD Million) Trend Analysis By Market Taxonomy, 2020 to 2024
    • Market Size Value (USD Million) Forecast By Market Taxonomy, 2025 to 2035
      • By Country
        • USA
        • Canada
        • Mexico
      • By End User
    • Market Attractiveness Analysis
      • By Country
      • By End User
    • Key Takeaways
  9. Latin America Market Analysis 2020 to 2024 and Forecast 2025 to 2035, By Country
    • Historical Market Size Value (USD Million) Trend Analysis By Market Taxonomy, 2020 to 2024
    • Market Size Value (USD Million) Forecast By Market Taxonomy, 2025 to 2035
      • By Country
        • Brazil
        • Chile
        • Rest of Latin America
      • By End User
    • Market Attractiveness Analysis
      • By Country
      • By End User
    • Key Takeaways
  10. Western Europe Market Analysis 2020 to 2024 and Forecast 2025 to 2035, By Country
    • Historical Market Size Value (USD Million) Trend Analysis By Market Taxonomy, 2020 to 2024
    • Market Size Value (USD Million) Forecast By Market Taxonomy, 2025 to 2035
      • By Country
        • Germany
        • UK
        • Italy
        • Spain
        • France
        • Nordic
        • BENELUX
        • Rest of Western Europe
      • By End User
    • Market Attractiveness Analysis
      • By Country
      • By End User
    • Key Takeaways
  11. Eastern Europe Market Analysis 2020 to 2024 and Forecast 2025 to 2035, By Country
    • Historical Market Size Value (USD Million) Trend Analysis By Market Taxonomy, 2020 to 2024
    • Market Size Value (USD Million) Forecast By Market Taxonomy, 2025 to 2035
      • By Country
        • Russia
        • Poland
        • Hungary
        • Balkan & Baltic
        • Rest of Eastern Europe
      • By End User
    • Market Attractiveness Analysis
      • By Country
      • By End User
    • Key Takeaways
  12. East Asia Market Analysis 2020 to 2024 and Forecast 2025 to 2035, By Country
    • Historical Market Size Value (USD Million) Trend Analysis By Market Taxonomy, 2020 to 2024
    • Market Size Value (USD Million) Forecast By Market Taxonomy, 2025 to 2035
      • By Country
        • China
        • Japan
        • South Korea
      • By End User
    • Market Attractiveness Analysis
      • By Country
      • By End User
    • Key Takeaways
  13. South Asia and Pacific Market Analysis 2020 to 2024 and Forecast 2025 to 2035, By Country
    • Historical Market Size Value (USD Million) Trend Analysis By Market Taxonomy, 2020 to 2024
    • Market Size Value (USD Million) Forecast By Market Taxonomy, 2025 to 2035
      • By Country
        • India
        • ASEAN
        • Australia & New Zealand
        • Rest of South Asia and Pacific
      • By End User
    • Market Attractiveness Analysis
      • By Country
      • By End User
    • Key Takeaways
  14. Middle East & Africa Market Analysis 2020 to 2024 and Forecast 2025 to 2035, By Country
    • Historical Market Size Value (USD Million) Trend Analysis By Market Taxonomy, 2020 to 2024
    • Market Size Value (USD Million) Forecast By Market Taxonomy, 2025 to 2035
      • By Country
        • Kingdom of Saudi Arabia
        • Other GCC Countries
        • Turkiye
        • South Africa
        • Other African Union
        • Rest of Middle East & Africa
      • By End User
    • Market Attractiveness Analysis
      • By Country
      • By End User
    • Key Takeaways
  15. Key Countries Market Analysis
    • USA
      • Pricing Analysis
      • Market Share Analysis, 2024
        • By End User
    • Canada
      • Pricing Analysis
      • Market Share Analysis, 2024
        • By End User
    • Mexico
      • Pricing Analysis
      • Market Share Analysis, 2024
        • By End User
    • Brazil
      • Pricing Analysis
      • Market Share Analysis, 2024
        • By End User
    • Chile
      • Pricing Analysis
      • Market Share Analysis, 2024
        • By End User
    • Germany
      • Pricing Analysis
      • Market Share Analysis, 2024
        • By End User
    • UK
      • Pricing Analysis
      • Market Share Analysis, 2024
        • By End User
    • Italy
      • Pricing Analysis
      • Market Share Analysis, 2024
        • By End User
    • Spain
      • Pricing Analysis
      • Market Share Analysis, 2024
        • By End User
    • France
      • Pricing Analysis
      • Market Share Analysis, 2024
        • By End User
    • India
      • Pricing Analysis
      • Market Share Analysis, 2024
        • By End User
    • ASEAN
      • Pricing Analysis
      • Market Share Analysis, 2024
        • By End User
    • Australia & New Zealand
      • Pricing Analysis
      • Market Share Analysis, 2024
        • By End User
    • China
      • Pricing Analysis
      • Market Share Analysis, 2024
        • By End User
    • Japan
      • Pricing Analysis
      • Market Share Analysis, 2024
        • By End User
    • South Korea
      • Pricing Analysis
      • Market Share Analysis, 2024
        • By End User
    • Russia
      • Pricing Analysis
      • Market Share Analysis, 2024
        • By End User
    • Poland
      • Pricing Analysis
      • Market Share Analysis, 2024
        • By End User
    • Hungary
      • Pricing Analysis
      • Market Share Analysis, 2024
        • By End User
    • Kingdom of Saudi Arabia
      • Pricing Analysis
      • Market Share Analysis, 2024
        • By End User
    • Turkiye
      • Pricing Analysis
      • Market Share Analysis, 2024
        • By End User
    • South Africa
      • Pricing Analysis
      • Market Share Analysis, 2024
        • By End User
  16. Market Structure Analysis
    • Competition Dashboard
    • Competition Benchmarking
    • Market Share Analysis of Top Players
      • By Regional
      • By End User
  17. Competition Analysis
    • Competition Deep Dive
      • KAATSU Global, LLC
        • Overview
        • Product Portfolio
        • Profitability by Market Segments (Product/Age /Sales Channel/Region)
        • Sales Footprint
        • Strategy Overview
          • Marketing Strategy
          • Product Strategy
          • Channel Strategy
      • Occlusion Cuff
      • Delfi Medical Innovations Inc.
      • Saga Fitness
      • SmartTools Plus
      • Fit Cuffs
      • The X Bands
      • B Strong
  18. Assumptions & Acronyms Used
  19. Research Methodology

List of Tables

  • Table 1: Global Market Value (USD Million) Forecast by Region, 2020-2035
  • Table 2: Global Market Value (USD Million) Forecast by End User , 2020-2035
  • Table 3: North America Market Value (USD Million) Forecast by Country, 2020-2035
  • Table 4: North America Market Value (USD Million) Forecast by End User , 2020-2035
  • Table 5: Latin America Market Value (USD Million) Forecast by Country, 2020-2035
  • Table 6: Latin America Market Value (USD Million) Forecast by End User , 2020-2035
  • Table 7: Western Europe Market Value (USD Million) Forecast by Country, 2020-2035
  • Table 8: Western Europe Market Value (USD Million) Forecast by End User , 2020-2035
  • Table 9: Eastern Europe Market Value (USD Million) Forecast by Country, 2020-2035
  • Table 10: Eastern Europe Market Value (USD Million) Forecast by End User , 2020-2035
  • Table 11: East Asia Market Value (USD Million) Forecast by Country, 2020-2035
  • Table 12: East Asia Market Value (USD Million) Forecast by End User , 2020-2035
  • Table 13: South Asia and Pacific Market Value (USD Million) Forecast by Country, 2020-2035
  • Table 14: South Asia and Pacific Market Value (USD Million) Forecast by End User , 2020-2035
  • Table 15: Middle East & Africa Market Value (USD Million) Forecast by Country, 2020-2035
  • Table 16: Middle East & Africa Market Value (USD Million) Forecast by End User , 2020-2035

List of Figures

  • Figure 1: Global Market Pricing Analysis
  • Figure 2: Global Market Value (USD Million) Forecast 2020-2035
  • Figure 3: Global Market Value Share and BPS Analysis by End User , 2025 and 2035
  • Figure 4: Global Market Y-o-Y Growth Comparison by End User , 2025-2035
  • Figure 5: Global Market Attractiveness Analysis by End User
  • Figure 6: Global Market Value (USD Million) Share and BPS Analysis by Region, 2025 and 2035
  • Figure 7: Global Market Y-o-Y Growth Comparison by Region, 2025-2035
  • Figure 8: Global Market Attractiveness Analysis by Region
  • Figure 9: North America Market Incremental Dollar Opportunity, 2025-2035
  • Figure 10: Latin America Market Incremental Dollar Opportunity, 2025-2035
  • Figure 11: Western Europe Market Incremental Dollar Opportunity, 2025-2035
  • Figure 12: Eastern Europe Market Incremental Dollar Opportunity, 2025-2035
  • Figure 13: East Asia Market Incremental Dollar Opportunity, 2025-2035
  • Figure 14: South Asia and Pacific Market Incremental Dollar Opportunity, 2025-2035
  • Figure 15: Middle East & Africa Market Incremental Dollar Opportunity, 2025-2035
  • Figure 16: North America Market Value Share and BPS Analysis by Country, 2025 and 2035
  • Figure 17: North America Market Value Share and BPS Analysis by End User , 2025 and 2035
  • Figure 18: North America Market Y-o-Y Growth Comparison by End User , 2025-2035
  • Figure 19: North America Market Attractiveness Analysis by End User
  • Figure 20: Latin America Market Value Share and BPS Analysis by Country, 2025 and 2035
  • Figure 21: Latin America Market Value Share and BPS Analysis by End User , 2025 and 2035
  • Figure 22: Latin America Market Y-o-Y Growth Comparison by End User , 2025-2035
  • Figure 23: Latin America Market Attractiveness Analysis by End User
  • Figure 24: Western Europe Market Value Share and BPS Analysis by Country, 2025 and 2035
  • Figure 25: Western Europe Market Value Share and BPS Analysis by End User , 2025 and 2035
  • Figure 26: Western Europe Market Y-o-Y Growth Comparison by End User , 2025-2035
  • Figure 27: Western Europe Market Attractiveness Analysis by End User
  • Figure 28: Eastern Europe Market Value Share and BPS Analysis by Country, 2025 and 2035
  • Figure 29: Eastern Europe Market Value Share and BPS Analysis by End User , 2025 and 2035
  • Figure 30: Eastern Europe Market Y-o-Y Growth Comparison by End User , 2025-2035
  • Figure 31: Eastern Europe Market Attractiveness Analysis by End User
  • Figure 32: East Asia Market Value Share and BPS Analysis by Country, 2025 and 2035
  • Figure 33: East Asia Market Value Share and BPS Analysis by End User , 2025 and 2035
  • Figure 34: East Asia Market Y-o-Y Growth Comparison by End User , 2025-2035
  • Figure 35: East Asia Market Attractiveness Analysis by End User
  • Figure 36: South Asia and Pacific Market Value Share and BPS Analysis by Country, 2025 and 2035
  • Figure 37: South Asia and Pacific Market Value Share and BPS Analysis by End User , 2025 and 2035
  • Figure 38: South Asia and Pacific Market Y-o-Y Growth Comparison by End User , 2025-2035
  • Figure 39: South Asia and Pacific Market Attractiveness Analysis by End User
  • Figure 40: Middle East & Africa Market Value Share and BPS Analysis by Country, 2025 and 2035
  • Figure 41: Middle East & Africa Market Value Share and BPS Analysis by End User , 2025 and 2035
  • Figure 42: Middle East & Africa Market Y-o-Y Growth Comparison by End User , 2025-2035
  • Figure 43: Middle East & Africa Market Attractiveness Analysis by End User
  • Figure 44: Global Market - Tier Structure Analysis
  • Figure 45: Global Market - Company Share Analysis

Frequently Asked Questions

How big is the blood flow restriction bands market in 2025?

The global blood flow restriction bands market is estimated to be valued at USD 1.2 billion in 2025.

What will be the size of blood flow restriction bands market in 2035?

The market size for the blood flow restriction bands market is projected to reach USD 3.4 billion by 2035.

How much will be the blood flow restriction bands market growth between 2025 and 2035?

The blood flow restriction bands market is expected to grow at a 11.2% CAGR between 2025 and 2035.

What are the key product types in the blood flow restriction bands market?

The key product types in blood flow restriction bands market are rehabilitation centers, wellness and fitness centers and homecare settings.

Which segment to contribute significant share in the blood flow restriction bands market in 2025?

In terms of , segment to command 0.0% share in the blood flow restriction bands market in 2025.

Explore Similar Insights

Future Market Insights

Blood Flow Restriction Bands Market

Chat With MaRIA

Chat With

MaRIA

Hi There, I am MaRIA, Your Market Research Intelligence Assistant. How may I help you?