The Flow Indicator Market is estimated to be valued at USD 0.8 billion in 2025 and is projected to reach USD 1.2 billion by 2035, registering a compound annual growth rate (CAGR) of 4.1% over the forecast period.
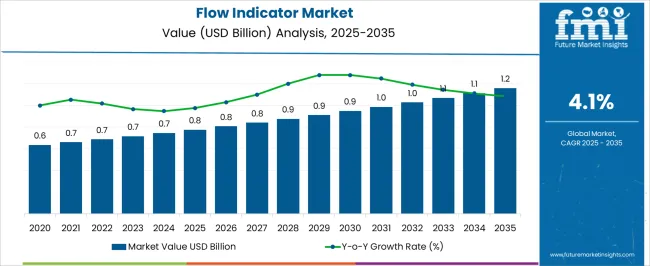
| Metric | Value |
|---|---|
| Flow Indicator Market Estimated Value in (2025 E) | USD 0.8 billion |
| Flow Indicator Market Forecast Value in (2035 F) | USD 1.2 billion |
| Forecast CAGR (2025 to 2035) | 4.1% |
The flow indicator market is expanding steadily as industries emphasize operational safety, process monitoring, and equipment efficiency. Current dynamics are being shaped by increasing demand for reliable visual and automated flow monitoring devices across power generation, chemical, oil and gas, and water treatment sectors. Growth is supported by the rising need for early detection of flow irregularities to prevent downtime and optimize performance.
Manufacturers are enhancing product durability, integrating advanced materials, and adopting digital compatibility to align with evolving industrial requirements. Market adoption is also being influenced by regulatory frameworks promoting process safety and energy efficiency. Future growth is expected to be driven by industrial modernization, expansion of high-capacity plants, and technological innovation in smart monitoring solutions.
The growth rationale is centered on the critical role of flow indicators in safeguarding processes, reducing operational risks, and supporting preventive maintenance strategies These factors are collectively positioning the market for consistent revenue expansion and deeper penetration across both mature and emerging industrial economies.
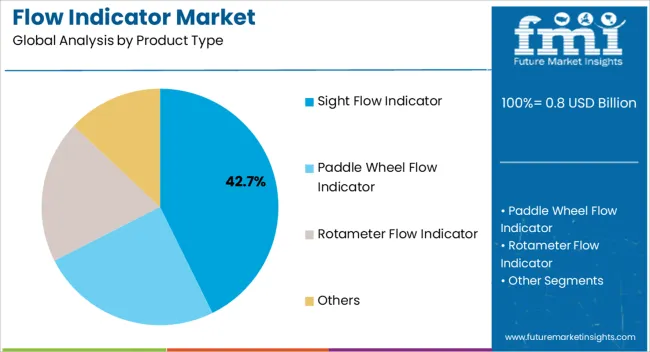
The sight flow indicator segment, holding 42.70% of the product type category, has established its dominance due to its reliability in providing immediate visual confirmation of flow within pipelines. Adoption has been supported by its simple design, cost-effectiveness, and ease of installation across a wide range of applications.
Industries have preferred this segment for critical processes where quick identification of blockages or irregularities is essential. Durability improvements and the use of corrosion-resistant materials have enhanced performance in challenging environments.
Continuous product enhancements aimed at improving visibility and integrating compatibility with digital monitoring systems are further reinforcing demand As industries place stronger emphasis on safety and operational efficiency, the sight flow indicator segment is expected to maintain its leadership and drive substantial growth in the overall market.
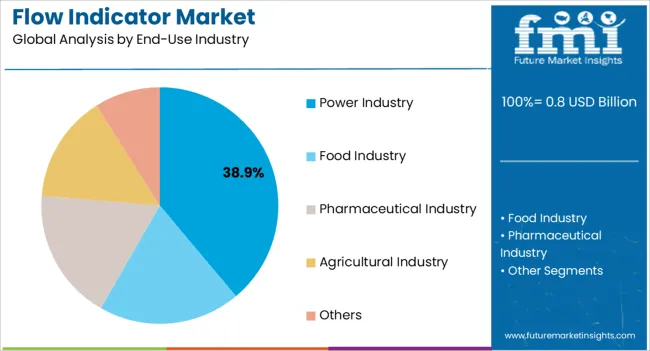
The power industry segment, accounting for 38.90% of the end-use industry category, has maintained its leading position due to the essential role of flow indicators in monitoring cooling systems, boilers, and auxiliary processes within power plants. Reliable monitoring of fluid movement is critical for maintaining operational efficiency and preventing costly system failures.
The segment’s prominence has been reinforced by the ongoing expansion of power generation capacity and the modernization of existing infrastructure. Flow indicators are being increasingly integrated into preventive maintenance programs, ensuring long-term operational stability.
The shift toward more energy-efficient and sustainable power generation practices is further stimulating adoption With rising global electricity demand and the continued construction of new plants, the power industry segment is expected to sustain its leadership and provide consistent growth momentum for the flow indicator market.
The flow indicator market was valued at USD 0.6.0 million in 2020. Over the historical period from 2020 to 2025, the market grew at a CAGR of 3.6%.
Sales of flow indicators continued to rise during the historical period. However, the pandemic resulted in several industrial units shutting down. Due to the pandemic, the rate of new industrial units opening slowed down, resulting in fewer piping systems being installed. By the end of the historical period in 2025, the value of the market reached USD 714.2 million.
| Market Valuation (2020) | USD 0.6.0 million |
|---|---|
| Historical CAGR (2020 to 2025) | 3.6% |
| Historical Market Valuation (2025) | USD 714.2 million |
Long-term Analysis of the Flow Indicator Market
For 2025, the value of the flow indicator market is estimated to be USD 0.8 million. During the period from 2025 to 2035, the market is expected to progress at a CAGR of 4.3%.
Compared to the historical period, the progress of the market is expected to be faster over the forecast period. With rising industrial production, post-pandemic, the number of piping systems being installed is also rising. A rise in the number of piping systems is conducive to the growth of the flow indicator market, which is expected to drive the market during the forecast period.
Several people are becoming conscious of the need for proper flow of liquids and gases in pipes. They are also concerned about the leakage from pipes disrupting normal flow in industries and buildings. There is also a growing consciousness of the severe effects of leaking gases and liquids in the surroundings, for example, contamination of water bodies or the release of harmful gases into the atmosphere. Thus, there is an increasing acceptance of the use of flow indicators to regulate pipe systems. The market is projected to reach USD 1,058.1 million by the end of the forecast period.
The demand for flow sight indicators is rising and is estimated to hold a share of 32.0% of the market by product type.
The flow sight indicators not only indicate the flow rate of liquids and gases but also provide a visual component. In addition to answering the question of flow happening, the color of the water can also be checked for contamination. Thus, flow sight indicators are witnessing an increasing adoption in industries.
| Attributes | Details |
|---|---|
| Top Product Type | Flow Sight Indicator |
| Market Share in 2025 | 32.0% |
The power industry widely utilizes flow indicators. In 2025, the power industry is expected to hold 19.0% of the market share by the end-use industry.
Industrial power units feature an intricate series of pipes through which water flows. To make sure of the flow of water through the maze of pipes, flow indicators are being rapidly accepted into the power industry.
| Attributes | Details |
|---|---|
| Top End-use Industry | Power Industry |
| Market Share in 2025 | 19.0% |
The Asia Pacific region is experiencing an increasing need for flow indicators. The rise of industries in the region is helpful to the growth of the market. The rapidly increasing population of the region is also in constant need of power, and thus, the power industry is expanding, paving the way for growth.
Europe is another region that represents an opportunity for market growth. Rapid technological development in the region is aiding the adoption of technologies like flow indicators to be accepted into European factories.
| Countries | CAGR (2025 to 2035) |
|---|---|
| United States | 3.9% |
| Australia | 4.0% |
| United Kingdom | 3.9% |
| India | 5.0% |
| China | 4.8% |
India is one of the most promising countries in the market. The CAGR for the market in India is expected to be 5.0% from 2025 to 2035.
In India, government initiatives promote small and medium-scale industrial production. As the requirement of small and medium-scale production is not large, manufacturers are adjusting to requirements. Thus, sales of small-sized flow indicators are increasing in India.
The CAGR for the market in China is pegged at 4.8% over the forecast period.
Chinese manufacturers are striving to meet the increasing need for flow indicators in Chinese industries. Thus, new product launches are common in China. The rising focus on innovation in China is stimulating the demand for flow indicators.
The CAGR for the market in Australia is predicted to be 4.0% over the forecast period. Australia is seeing increased production, import, and consumption of gas. The demand for flow indicators is increasing in the natural gas industry due to rising sustainability concerns. Flow indicators are used to monitor the extensive piping systems involved in the gas industry.
The United Kingdom is one of the leading countries in Europe with potential for market growth. Over the forecast period, the CAGR for the United Kingdom market is predicted to be 3.9%.
The United Kingdom is home to a number of companies with storied histories in making flow indicators. Brands like Rhodes and Arkon have earned the trust of industrialists.
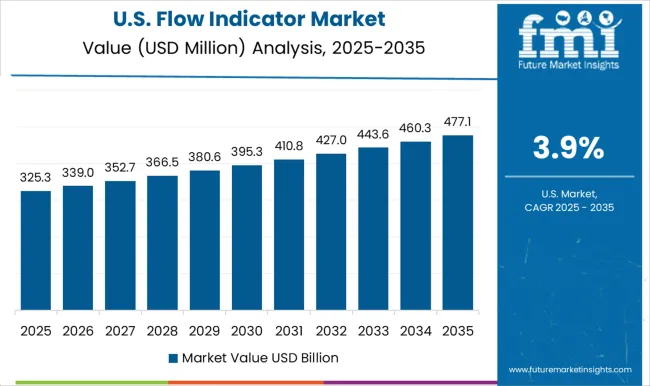
In the United States, industry players prefer flow indicators that have been customized to specific needs. There is a drive to maximize the efficiency of flow indicators due to ongoing trend of customized products in the market. The CAGR for the United States market is projected to be 3.9% over the forecast period.
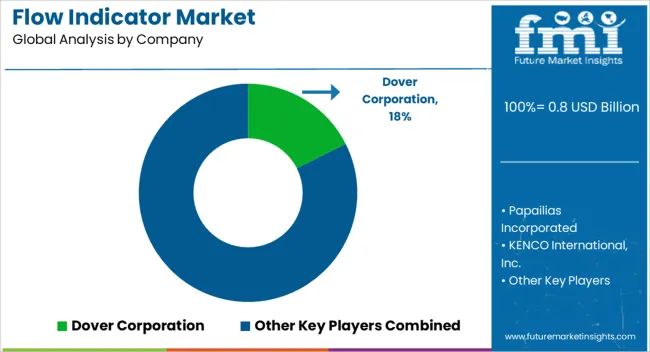
Market players are intensely focused on innovations that account for the varying needs of a diverse range of industries. Market players are paying attention to customization and the increasing pressure-handling capabilities of flow indicators.
Companies are focusing on advertising to differentiate their products from other products like flow meters. They are also focusing on innovations and are adopting strategies to remain competitive in the market.
Recent Developments in the Flow Indicator Market
The global flow indicator market is estimated to be valued at USD 0.8 billion in 2025.
The market size for the flow indicator market is projected to reach USD 1.2 billion by 2035.
The flow indicator market is expected to grow at a 4.1% CAGR between 2025 and 2035.
The key product types in flow indicator market are sight flow indicator, paddle wheel flow indicator, rotameter flow indicator and others.
In terms of end-use industry, power industry segment to command 38.9% share in the flow indicator market in 2025.


Our Research Products

The "Full Research Suite" delivers actionable market intel, deep dives on markets or technologies, so clients act faster, cut risk, and unlock growth.

The Leaderboard benchmarks and ranks top vendors, classifying them as Established Leaders, Leading Challengers, or Disruptors & Challengers.

Locates where complements amplify value and substitutes erode it, forecasting net impact by horizon

We deliver granular, decision-grade intel: market sizing, 5-year forecasts, pricing, adoption, usage, revenue, and operational KPIs—plus competitor tracking, regulation, and value chains—across 60 countries broadly.

Spot the shifts before they hit your P&L. We track inflection points, adoption curves, pricing moves, and ecosystem plays to show where demand is heading, why it is changing, and what to do next across high-growth markets and disruptive tech

Real-time reads of user behavior. We track shifting priorities, perceptions of today’s and next-gen services, and provider experience, then pace how fast tech moves from trial to adoption, blending buyer, consumer, and channel inputs with social signals (#WhySwitch, #UX).

Partner with our analyst team to build a custom report designed around your business priorities. From analysing market trends to assessing competitors or crafting bespoke datasets, we tailor insights to your needs.
Supplier Intelligence
Discovery & Profiling
Capacity & Footprint
Performance & Risk
Compliance & Governance
Commercial Readiness
Who Supplies Whom
Scorecards & Shortlists
Playbooks & Docs
Category Intelligence
Definition & Scope
Demand & Use Cases
Cost Drivers
Market Structure
Supply Chain Map
Trade & Policy
Operating Norms
Deliverables
Buyer Intelligence
Account Basics
Spend & Scope
Procurement Model
Vendor Requirements
Terms & Policies
Entry Strategy
Pain Points & Triggers
Outputs
Pricing Analysis
Benchmarks
Trends
Should-Cost
Indexation
Landed Cost
Commercial Terms
Deliverables
Brand Analysis
Positioning & Value Prop
Share & Presence
Customer Evidence
Go-to-Market
Digital & Reputation
Compliance & Trust
KPIs & Gaps
Outputs
Full Research Suite comprises of:
Market outlook & trends analysis
Interviews & case studies
Strategic recommendations
Vendor profiles & capabilities analysis
5-year forecasts
8 regions and 60+ country-level data splits
Market segment data splits
12 months of continuous data updates
DELIVERED AS:
PDF EXCEL ONLINE
Flower Box Market Size and Share Forecast Outlook 2025 to 2035
Flow Pack Films Market Size and Share Forecast Outlook 2025 to 2035
Flow Pack Machine Market Size and Share Forecast Outlook 2025 to 2035
Flow Chemistry Market Size and Share Forecast Outlook 2025 to 2035
Flow Wrappers Market Size and Share Forecast Outlook 2025 to 2035
Flow Computer Market Size and Share Forecast Outlook 2025 to 2035
Flow Meter Devices Market Size, Share, and Forecast 2025 to 2035
Flow Cytometry Market - Trends & Growth Forecast 2025 to 2035
Flow Wrap Machines Market by Horizontal & Vertical Systems Through 2025 to 2035
Flow Wrap Packaging Market Growth from 2025 to 2035
Flower Extract Market Analysis by Type, Application and Form Through 2035
Flow Meters Market Growth - Trends & Forecast 2025 to 2035
Flow Wrap Machines Market Analysis – Size, Share & Industry Trends 2025-2035
Flow Diverter Market Analysis – Size, Trends & Forecast 2024-2034
Flow Wrap Market from 2024 to 2034
Flowback Tank Market Growth – Trends & Forecast 2024-2034
Flowpack Paper Packaging Market
Flow Cytometer Market
Inflow Pressure Screen Market Analysis - Size, Share, and Forecast Outlook 2025 to 2035
Inflow Control Devices Market Analysis - Size, Growth, and Forecast 2025 to 2035

Thank you!
You will receive an email from our Business Development Manager. Please be sure to check your SPAM/JUNK folder too.
Chat With
MaRIA