Reports

- Global Locations -

Headquarters

Future Market Insights, Inc.

Christiana Corporate, 200
Continental Drive, Suite 401,
Newark, Delaware - 19713,
United States

T: +1-845-579-5705

Americas

Future Market Insights, Inc.

616 Corporate Way, Suite 2-9018,
Valley Cottage, NY 10989, United States

T: +1-347-918-3531

MEA

Future Market Insights

1602-6 Jumeirah Bay X2 Tower, Plot No: JLT-PH2-X2A,
Jumeirah Lakes Towers, Dubai,
United Arab Emirates

Europe

Future Market Insights

3rd Floor, 207 Regent Street,
W1B 3HH London
United Kingdom

T: + 44 (0) 20 8123 9659
D: +44 (0) 20 3287 4268

Asia Pacific

Future Market Insights

IndiaLand Global Tech Park, Unit UG-1, Behind Grand HighStreet, Phase 1, Hinjawadi, MH, Pune – 411057, India

Flow Meters Market Outlook (2023 to 2033)

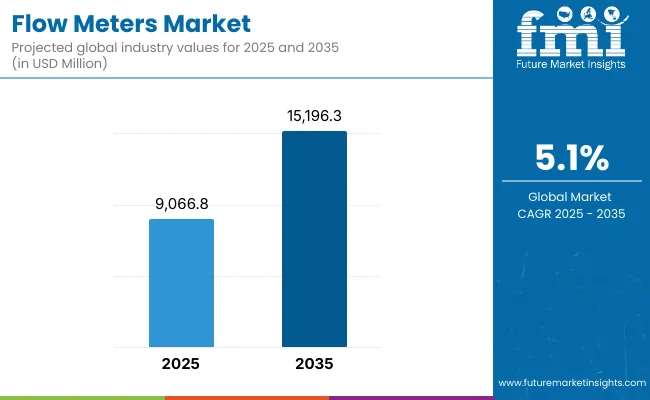
FMI projects that the flow meters market size could reach a valuation of US$ 8.1 billion by 2023. The demand for high-performance flow meters is expected to increase given a recovery in key industries and their reliance on these devices. Therefore, looking forward to the future, the market revenue is estimated to surpass US$ 13.2 billion by 2033, exhibiting a CAGR of 5.0%.

Flow measurement infrastructure has a vital role in measuring the water that flows through wastewater treatment systems. Key industries including water & wastewater, oil & gas, chemical, power generation, and pulp & paper have a huge demand for flow meters. The usage of flow meters in these industries for wastewater treatment has contributed significantly to the market growth.

The rise in initiatives to build safe water management infrastructure has positively impacted the demand for flow meters. Accurate measurement and monitoring of water and wastewater flows are critical for effective treatment and management. This, in turn, is leading to an increase in demand for flow meters for water and wastewater treatment plants.

Flow meters are highly preferred in process industries. Governments in various regions are making the use of flow meters mandatory given their benefits. Many organizations are focused on reducing the total cost of ownership of flow meters. This is driving the demand for flow meters that require less maintenance and have a long lifespan.

A significant contributor has been the rise in industrial output and the requirement for energy. The requirement for energy-efficient flow meters is also driving the market. Energy-efficient flow meters can help reduce energy consumption and costs. This can help reduce the overall carbon footprint of an organization.

The challenge of managing the operational processes of smart systems could limit market expansion. This challenge is related to labor skills and expertise. The market is currently constrained in its ability to manufacture flow meters on a personalized basis. Another factor that could impede growth is the high initial costs associated with advanced flow meter products.

The working range and construction material affect flow meters' price. Among other materials, flow meters are constructed of metal, plastics, and alloys. The flow meter cost has increased even more. Original equipment manufacturers (OEMs) are having a hard time getting high-quality raw materials. Suppliers are imposing supply timelines given the fluctuating pricing of these components.

Key trends in this market include the growing adoption of digital flow meters and the increasing use of ultrasonic flow meters. These flow meters offer high accuracy and reliability in flow measurement. Another significant development in the market is the growing adoption of digital flow meters.

The demand for intelligent flow meters is expected to thrive given the integration of the Internet of Things. This has led to the introduction of smart measurement solutions. The demand for the Coriolis flowmeter is also projected to grow because of its advanced smart capabilities that enable more precise rate measurement.

The increasing adoption of smart flow meters and the development of new technologies are expected to create new opportunities for market players. Process automation is also a recent trend in the peak flow meters market. This is driven by the need for accurate flow-measuring tools to support efficient manufacturing processes. Therefore, an increase in industrial production worldwide is projected to open up market opportunities.

Attributes Details
Base Year Value (2022) US$ 7.7 billion
Current Year Value (2023) US$ 8.1 billion
Expected Forecast Value (2033) US$ 13.2 billion
Historical CAGR (2018 to 2022) 5.8%
Projected CAGR (2023 to 2033) 5.0%

Don't pay for what you don't need

Customize your report by selecting specific countries or regions and save 30%!

2023 to 2033 Flow Meters Sales Outlook in Comparison to Sales Registered from 2018 to 2022

FMI’s new flow meters market report shows that market revenue could grow from 7.7 billion in 2022 to 13.2 billion by 2033. The global market has shown steady growth during the historical period. Factors behind this growth include increasing demand from different industries and the adoption of advanced technologies in flow meter manufacturing.

The COVID-19 pandemic disrupted the global supply chain. This disruption has had an impact on the cost of raw commodities. As a result, it's challenging to fulfill agreements, and manufacturers are suffering significant losses.

The anticipated increase in demand for flow meters is projected to be fueled by the establishment of new manufacturing units. These units are prioritizing automation to reduce lead times, unnecessary wastage, and unplanned downtime. The growing focus on energy efficiency and sustainability is also expected to drive the adoption of flow meters in various applications.

Asia Pacific provides a low-cost labor force, a large population base, and improved living standards. This has motivated flow meter manufacturers to establish their facilities in the region to satisfy the growing demand. Notable industrialization in the region has played a crucial role in driving up the demand for flow meters.

The trend toward predictive maintenance is also driving the demand for flow meters that can detect and diagnose potential issues before they occur. The wireless and smart flow meters market is expected to boom during the forecast period. These flow meters offer several benefits, such as remote monitoring, real-time data analysis, and reduced maintenance costs. The growing trend toward Industry 4.0 is likely to increase the adoption of smart flow meters.

Market players are focusing their efforts on the oil & gas sector. They are investing significantly in the development of innovative products and solutions. The aim is to measure the flow rate of liquids, gases, and vapors accurately. Additionally, custody transfer in the oil & gas industry is one of the key applications that present key opportunities for ultrasonic and Coriolis flowmeters.

Comparative Analysis of the Adjacent Flow Meters Market

Flow Meters Market:

Differentiating Aspects Flow Meters Market
CAGR (2023 to 2033) 5.0%
Market Valuation in 2023 US$ 8.1 billion
Projected Market Value in 2033 US$ 13.2 billion
Growth Factors Increasing demand for accurate flow measurement.
Opportunities Development of low-cost and portable flow meters.
Key Trends Increasing demand for ultrasonic flow meters.

Intelligent Flow Meters Market:

Differentiating Aspects Intelligent Flow Meters Market
CAGR (2023 to 2033) 5.9%
Market Valuation in 2023 US$ 8.2 billion
Projected Market Value in 2033 US$ 14.5 billion
Growth Factors Growing adoption of automation in industrial processes.
Opportunities Increased adoption of Coriolis flow meters for custody transfer.
Key Trends Shift toward wireless flow metering systems.

Flow Sensor Market:

Differentiating Aspects Flow Sensor Market
CAGR (2023 to 2033) 7.1%
Market Valuation in 2023 US$ 9.8 billion
Projected Market Value in 2033 US$ 19.4 billion
Growth Factors Increasing need for precise measurement of fluid flows.
Opportunities Rising demand for miniaturized flow sensors.
Key Trends Adoption of wireless and non-invasive flow sensors.
Nikhil Kaitwade
Nikhil Kaitwade

Principal Consultant

Talk to Analyst

Find your sweet spots for generating winning opportunities in this market.

Exploring the Regional Patterns of the Flow Meters Market: An In-depth Examination at the Country Level

Country The United States
Historical CAGR (2018 to 2022) 4.3%
Forecasted CAGR (2023 to 2033) 3.9%
Projected Market Value (2033) 4.1 billion
Country The United Kingdom
Historical CAGR (2018 to 2022) 4.6%
Forecasted CAGR (2023 to 2033) 4.2%
Projected Market Value (2033) 612.9 million
Country China
Historical CAGR (2018 to 2022) 7.2%
Forecasted CAGR (2023 to 2033) 5.9%
Projected Market Value (2033) 1.1 billion
Country Japan
Historical CAGR (2018 to 2022) 5.0%
Forecasted CAGR (2023 to 2033) 4.5%
Projected Market Value (2033) 1.0 billion
Country South Korea
Historical CAGR (2018 to 2022) 6.5%
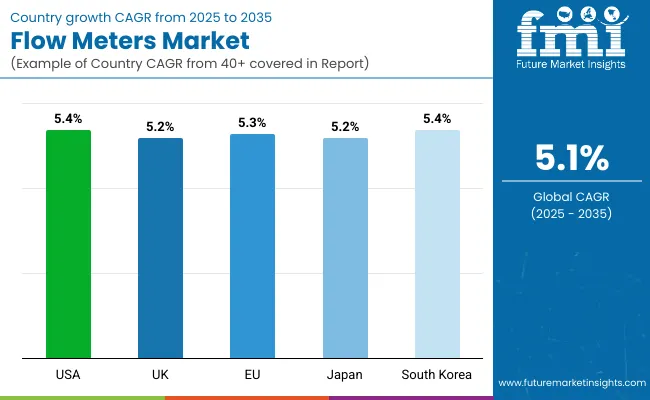
Forecasted CAGR (2023 to 2033) 5.4%
Projected Market Value (2033) 532.5 million

Flow Meters Take the Center Stage in Industrial Operations across the United States

The United States has a well-established flow meters industry given its significant industrial activities. The growing demand for reliable flow measurement devices and increasing investment in infrastructure development are the key drivers for the United States flow meters market growth.

The government is investing in infrastructure development projects which are likely to drive the demand for flow meters. For instance, the United States Environmental Protection Agency has set regulations for the measurement and monitoring of wastewater. The agency supports local wastewater treatment facilities and participates in pollution control initiatives. These initiatives aim to safeguard watersheds and drinking water sources. Additionally, the agency implements federal safe drinking water regulations.

Key players are investing in research and development to launch innovative products and gain a competitive edge in the market. For instance, Badger Meter introduced the Dynasonics TFX-5000 in September 2019. It is a flexible ultrasonic flow and energy meter. The device is made for non-invasive, ultrasonic transit time measurement. This technology is recognized to be perfect for oil & gas, HVAC, and water and wastewater treatment applications.

Government Initiatives Boost Flow Meter Adoption in the United Kingdom

The United Kingdom flow meters market expansion is attributed to the increasing demand for accurate and reliable flow measurement devices in various industries. The increasing adoption of automation in various industries in the country has led to the demand for flow meters. The government has introduced several initiatives that meanderingly encourage the adoption of flow meters in various industries. For instance,

  • The government announced in May 2022 its Water Industry National Environment Programme (WINEP). It is likely to increase the adoption of flow meters in the water and wastewater treatment industries to monitor water usage.

Multiple suppliers and producers of the flow rate measuring goods and services are based in the United Kingdom. Sentronics, a sensor company located in the United Kingdom, announced in June 2022 that it has partnered with testing system provider Horiba, the United Kingdom.

The partnership aims to introduce their next-generation ultrasonic fuel flow meter called Horiba RealFlow. Powered by Sentronics, the new flow meter is designed for the automotive sector.

Flow Meter Usage is on the Rise in Water Management Systems in China

China flow meters market growth is primarily driven by the increasing adoption of advanced technologies in manufacturing and processing industries. The government has been taking several initiatives to conserve water and improve water quality. To encourage the use of flow meters across different industries, the government has been launching several programs.

State Council released the "Water Pollution Prevention and Control Action Plan" (often referred to as the "Water Ten Plan") in April 2015. The strategy outlines how to improve management and guarantee the security of the water environment. This is likely to increase the adoption of flow meters in the water & wastewater industry.

Companies in China have been focusing on product innovation to strengthen their market position. In March 2023, a manufacturer in China, ATO Flow Meter introduced two new devices into the company's inventory. The devices are a magnetic flow meter and an ultrasonic flow meter. The new devices provide dependable technology for measuring liquids, gases, or steam in various industries. The devices also enable customers to get customized solutions that meet their specific needs.

Flow Meter Applications Proliferate in Japan and South Korea across Diverse Industries

Key drivers of Japan’s flow meters market include increasing government initiatives for water resource management and the growing demand for flow meters in the automotive industry. Flow meters are widely used in Japan’s automotive industry for measuring fuel consumption and optimizing engine performance. The growing demand for fuel-efficient vehicles is expected to drive the demand for flow meters in the automotive industry across the country.

Rising demand for oil and gas is expected to drive South Korea’s flow meters market growth. Demand for flow meters in water and wastewater treatment plants is increasing given the increasing population and urbanization. The implementation of strict environmental regulations by the government is also anticipated to boost the demand during the forecast period.

Exploring the Flow Meters Market: An In-depth Segment Analysis

Segment End-use Industry
Top Sub-segment Water & Wastewater
Historical CAGR (2018 to 2022) 5.7%
Forecasted CAGR (2023 to 2033) 4.9%
Segment Type
Top Sub-segment Coriolis
Historical CAGR (2018 to 2022) 5.6%
Forecasted CAGR (2023 to 2033) 4.8%

The Water and Wastewater Industry Emerges as the Dominant Force in the Market

The water and wastewater industry segment dominates the global market for several reasons. The water and wastewater industry is a significant consumer of flow meters. This is because accurate measurement and monitoring of water and wastewater flow rates is critical.

Given the rising demand from the water sectors in North America and Europe, the leading end-use industry for flow meters is expected to be water & wastewater. Strict laws imposed by governments in these regions facilitate the necessity for the clean discharge of effluents from manufacturing facilities. They aim to support sustainability and zero carbon emission aims.

Multinational corporations are investing heavily in foreign manufacturing facilities in various nations. These facilities must treat their effluents before releasing them due to the strict regulations imposed by several nations.

Flow meters have wide-ranging applications within the water and wastewater industry. The extensive use of flow meters creates a substantial market for these devices. It also drives innovation in the industry to create specialized flow meter solutions tailored to specific applications and requirements.

Coriolis Flow Meters are Ruling the Market with Accurate Flow Measurement

Based on flow meter types, the Coriolis segment leads the global market. Coriolis meters are highly accurate and can measure mass flow directly, regardless of the fluid's viscosity or density. Coriolis meters have no moving parts in the flow stream, making them less susceptible to wear and tear. This results in low maintenance requirements and long service life. Coriolis flow meters are also applied in hygienic settings. Coriolis meters are easy to install and require minimal upstream and downstream piping.

The ultrasonic flow meters market is expected to see noteworthy growth during the forecast period. This growth is particularly expected in applications where pipe size is large or where measurement infrastructure flow is limited. Given their outstanding accuracy, little maintenance requirements, and non-invasive design, ultrasonic flow meters are growing in popularity. They are ideal for measuring the flow of liquids and gases in a wide range of applications.

The differential pressure segment is also anticipated to witness significant growth prospects. Electromagnetic differential pressure flow meters use the principle of pressure drop across an obstruction to measure flow rates. Electromagnetic flow meters, on the other hand, measure flow rates based on the voltage generated by a moving conductive fluid in a magnetic field.

Get the data you need at a Fraction of the cost

Personalize your report by choosing insights you need
and save 40%!

Flow Meters Market: Analyzing Key Players, Strategies, and Market Share in the Global Landscape

Manufacturers in the market are constantly developing new technologies and improving existing ones to meet the needs of various industries. They are also focusing on reducing flow meters' cost and offering competitive prices to stay ahead in the market. In addition, manufacturers are also implementing innovative technologies like ultrasonic flow meters.

Manufacturers are offering a wide range of flow meters at competitive prices to cater to different budgets and requirements. They are also providing customized solutions for specific applications, which involve modifications to the flow meter design or installation. Manufacturers are also focusing on developing flow meters that are eco-friendly and have a minimal impact on the environment.

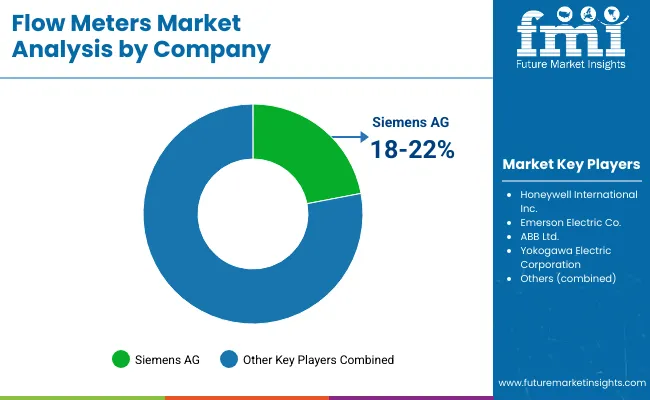
Key Players Operating in the Flow Meters Market

  • Emerson Electric Co.
  • Honeywell International Inc.
  • Siemens Group
  • ABB Ltd.
  • Yokogawa Electric Corporation
  • Krohne Messtechnik GmbH

Recent Developments by Key Market Players

  • Emerson disclosed the ASCO™ Series 209 proportional flow control valves in December 2022. The valves are built in a compact and purpose-built architecture. This makes them ideal for applications that demand precise performance. These valves are particularly well-suited for use in medical equipment, food and beverage, and heating, ventilation, and air conditioning (HVAC) systems.
  • Yokogawa unveiled its latest offering, the OpreX CA Series Magnetic Flowmeter, in September 2022. This advanced product is capable of measuring the flow of conductive fluids from a safe distance. The series boasts enhanced operational efficiency and ease of maintenance. This makes it a valuable addition to any industrial or utility service operation.
  • ABB launched a revolutionary product in December 2021 named the AquaMaster4 Mobile Comms flowmeter. This electromagnetic flowmeter is the first of its kind to offer bidirectional connectivity. This makes it an ideal tool for intelligent water loss management. Its connectivity on 4G-LTE and NB-IoT networks sets it apart from competitors. It can identify leaks ten times faster than current industry standards.
  • Krohne Messtechnik GmbH introduced an electromagnetic flow meter designed for industrial automation in April 2021. This flow meter is specifically engineered to fit into compact spaces. These include cooling systems, bending machines, robots, and chemical dosing skids.

How can Flow Meter Manufacturers Grow Their Businesses?

  • Diversify product portfolio for different industries and applications.
  • Invest in research and development to improve existing products and develop new technologies.
  • Collaborate with distributors and sellers to expand the global footprint.
  • Create a strong online presence through websites, social media, and e-commerce marketplaces.
  • Participate in trade shows and exhibitions to showcase products and network with potential customers.
  • Deliver excellent customer service and technical support to ensure customer satisfaction.
  • Adopt sustainable practices to appeal to eco-conscious customers and meet regulatory requirements.

Flow Meters Market Segmentation

By Type:

  • Differential Pressure
  • Positive Displacement
  • Ultrasonic
  • Turbine
  • Magnetic
  • Coriolis
  • Vortex
  • Others

By End-use Industry:

  • Water & Wastewater
  • Refining & Petrochemical
  • Oil & Gas
  • Chemical
  • Power Generation
  • Pulp & Paper
  • Food & Beverage
  • Pharmaceutical
  • Metals & Mining
  • Others

By Region:

  • North America
  • Latin America
  • Europe
  • Asia Pacific
  • The Middle East and Africa(MEA)

Frequently Asked Questions

What is the Current Flow Meters Market Valuation?

The flow meters market is valued at US$ 8.1 billion in 2023.

What is the Projected Size of the Flow Meters Market by 2033?

The flow meters market is projected to attain a value of US$ 13.2 billion by 2033.

What is the Estimated CAGR for the Flow Meters Market?

Sales of flow meters are anticipated to surge at a robust 5.0% CAGR through 2033.

Which Country Demonstrates Significant Profit Potential for Flow Meters?

The United States flow meters market exhibits substantial profit potential, set to exceed US$ 4.1 billion in revenue by 2033.

Which is the Key Segment in the Flow Meters Market by Product Type?

The Coriolis flow meters segment is poised to dominate the market, registering a 4.8% CAGR through 2033.

Table of Content

1. Executive Summary | Flow Meters Market

    1.1. Global Market Outlook

    1.2. Demand-side Trends

    1.3. Supply-side Trends

    1.4. Technology Roadmap Analysis

    1.5. Analysis and Recommendations

2. Market Overview

    2.1. Market Coverage / Taxonomy

    2.2. Market Definition / Scope / Limitations

3. Market Background

    3.1. Market Dynamics

        3.1.1. Drivers

        3.1.2. Restraints

        3.1.3. Opportunity

        3.1.4. Trends

    3.2. Scenario Forecast

        3.2.1. Demand in Optimistic Scenario

        3.2.2. Demand in Likely Scenario

        3.2.3. Demand in Conservative Scenario

    3.3. Opportunity Map Analysis

    3.4. Product Life Cycle Analysis

    3.5. Supply Chain Analysis

        3.5.1. Supply Side Participants and their Roles

            3.5.1.1. Producers

            3.5.1.2. Mid-Level Participants (Traders/ Agents/ Brokers)

            3.5.1.3. Wholesalers and Distributors

        3.5.2. Value Added and Value Created at Node in the Supply Chain

        3.5.3. List of Raw Material Suppliers

        3.5.4. List of Existing and Potential Buyer’s

    3.6. Investment Feasibility Matrix

    3.7. Value Chain Analysis

        3.7.1. Profit Margin Analysis

        3.7.2. Wholesalers and Distributors

        3.7.3. Retailers

    3.8. PESTLE and Porter’s Analysis

    3.9. Regulatory Landscape

        3.9.1. By Key Regions

        3.9.2. By Key Countries

    3.10. Regional Parent Market Outlook

    3.11. Production and Consumption Statistics

    3.12. Import and Export Statistics

4. Global Market Analysis 2018 to 2022 and Forecast, 2023 to 2033

    4.1. Historical Market Size Value (US$ Million) & Volume (Unit) Analysis, 2018 to 2022

    4.2. Current and Future Market Size Value (US$ Million) & Volume (Unit) Projections, 2023 to 2033

        4.2.1. Y-o-Y Growth Trend Analysis

        4.2.2. Absolute $ Opportunity Analysis

5. Global Market Analysis 2018 to 2022 and Forecast 2023 to 2033, By Type

    5.1. Introduction / Key Findings

    5.2. Historical Market Size Value (US$ Million) & Volume (Unit) Analysis By Type, 2018 to 2022

    5.3. Current and Future Market Size Value (US$ Million) & Volume (Unit) Analysis and Forecast By Type, 2023 to 2033

        5.3.1. Differential Pressure

        5.3.2. Positive Displacement

        5.3.3. Ultrasonic

        5.3.4. Turbine

        5.3.5. Magnetic

        5.3.6. Coriolis

        5.3.7. Vortex

        5.3.8. Others

    5.4. Y-o-Y Growth Trend Analysis By Type, 2018 to 2022

    5.5. Absolute $ Opportunity Analysis By Type, 2023 to 2033

6. Global Market Analysis 2018 to 2022 and Forecast 2023 to 2033, By End-use Industry

    6.1. Introduction / Key Findings

    6.2. Historical Market Size Value (US$ Million) & Volume (Unit) Analysis By End-use Industry, 2018 to 2022

    6.3. Current and Future Market Size Value (US$ Million) & Volume (Unit) Analysis and Forecast By End-use Industry, 2023 to 2033

        6.3.1. Water & Wastewater

        6.3.2. Refining & Petrochemical

        6.3.3. Oil & Gas

        6.3.4. Chemical

        6.3.5. Power Generation

        6.3.6. Pulp & Paper

        6.3.7. Food & Beverage

        6.3.8. Pharmaceutical

        6.3.9. Metals & Mining

        6.3.10. Others

    6.4. Y-o-Y Growth Trend Analysis By End-use Industry, 2018 to 2022

    6.5. Absolute $ Opportunity Analysis By End-use Industry, 2023 to 2033

7. Global Market Analysis 2018 to 2022 and Forecast 2023 to 2033, By Region

    7.1. Introduction

    7.2. Historical Market Size Value (US$ Million) & Volume (Unit) Analysis By Region, 2018 to 2022

    7.3. Current Market Size Value (US$ Million) & Volume (Unit) Analysis and Forecast By Region, 2023 to 2033

        7.3.1. North America

        7.3.2. Latin America

        7.3.3. Europe

        7.3.4. Asia Pacific

        7.3.5. MEA

    7.4. Market Attractiveness Analysis By Region

8. North America Market Analysis 2018 to 2022 and Forecast 2023 to 2033, By Country

    8.1. Historical Market Size Value (US$ Million) & Volume (Unit) Trend Analysis By Market Taxonomy, 2018 to 2022

    8.2. Market Size Value (US$ Million) & Volume (Unit) Forecast By Market Taxonomy, 2023 to 2033

        8.2.1. By Country

            8.2.1.1. The USA

            8.2.1.2. Canada

        8.2.2. By Type

        8.2.3. By End-use Industry

    8.3. Market Attractiveness Analysis

        8.3.1. By Country

        8.3.2. By Type

        8.3.3. By End-use Industry

    8.4. Key Takeaways

9. Latin America Market Analysis 2018 to 2022 and Forecast 2023 to 2033, By Country

    9.1. Historical Market Size Value (US$ Million) & Volume (Unit) Trend Analysis By Market Taxonomy, 2018 to 2022

    9.2. Market Size Value (US$ Million) & Volume (Unit) Forecast By Market Taxonomy, 2023 to 2033

        9.2.1. By Country

            9.2.1.1. Brazil

            9.2.1.2. Mexico

            9.2.1.3. Rest of Latin America

        9.2.2. By Type

        9.2.3. By End-use Industry

    9.3. Market Attractiveness Analysis

        9.3.1. By Country

        9.3.2. By Type

        9.3.3. By End-use Industry

    9.4. Key Takeaways

10. Europe Market Analysis 2018 to 2022 and Forecast 2023 to 2033, By Country

    10.1. Historical Market Size Value (US$ Million) & Volume (Unit) Trend Analysis By Market Taxonomy, 2018 to 2022

    10.2. Market Size Value (US$ Million) & Volume (Unit) Forecast By Market Taxonomy, 2023 to 2033

        10.2.1. By Country

            10.2.1.1. Germany

            10.2.1.2. United Kingdom

            10.2.1.3. France

            10.2.1.4. Spain

            10.2.1.5. Italy

            10.2.1.6. Rest of Europe

        10.2.2. By Type

        10.2.3. By End-use Industry

    10.3. Market Attractiveness Analysis

        10.3.1. By Country

        10.3.2. By Type

        10.3.3. By End-use Industry

    10.4. Key Takeaways

11. Asia Pacific Market Analysis 2018 to 2022 and Forecast 2023 to 2033, By Country

    11.1. Historical Market Size Value (US$ Million) & Volume (Unit) Trend Analysis By Market Taxonomy, 2018 to 2022

    11.2. Market Size Value (US$ Million) & Volume (Unit) Forecast By Market Taxonomy, 2023 to 2033

        11.2.1. By Country

            11.2.1.1. China

            11.2.1.2. Japan

            11.2.1.3. South Korea

            11.2.1.4. Malaysia

            11.2.1.5. Singapore

            11.2.1.6. Australia

            11.2.1.7. New Zealand

            11.2.1.8. Rest of APAC

        11.2.2. By Type

        11.2.3. By End-use Industry

    11.3. Market Attractiveness Analysis

        11.3.1. By Country

        11.3.2. By Type

        11.3.3. By End-use Industry

    11.4. Key Takeaways

12. MEA Market Analysis 2018 to 2022 and Forecast 2023 to 2033, By Country

    12.1. Historical Market Size Value (US$ Million) & Volume (Unit) Trend Analysis By Market Taxonomy, 2018 to 2022

    12.2. Market Size Value (US$ Million) & Volume (Unit) Forecast By Market Taxonomy, 2023 to 2033

        12.2.1. By Country

            12.2.1.1. GCC Countries

            12.2.1.2. South Africa

            12.2.1.3. Israel

            12.2.1.4. Rest of MEA

        12.2.2. By Type

        12.2.3. By End-use Industry

    12.3. Market Attractiveness Analysis

        12.3.1. By Country

        12.3.2. By Type

        12.3.3. By End-use Industry

    12.4. Key Takeaways

13. Key Countries Market Analysis

    13.1. USA

        13.1.1. Pricing Analysis

        13.1.2. Market Share Analysis, 2022

            13.1.2.1. By Type

            13.1.2.2. By End-use Industry

    13.2. Canada

        13.2.1. Pricing Analysis

        13.2.2. Market Share Analysis, 2022

            13.2.2.1. By Type

            13.2.2.2. By End-use Industry

    13.3. Brazil

        13.3.1. Pricing Analysis

        13.3.2. Market Share Analysis, 2022

            13.3.2.1. By Type

            13.3.2.2. By End-use Industry

    13.4. Mexico

        13.4.1. Pricing Analysis

        13.4.2. Market Share Analysis, 2022

            13.4.2.1. By Type

            13.4.2.2. By End-use Industry

    13.5. Germany

        13.5.1. Pricing Analysis

        13.5.2. Market Share Analysis, 2022

            13.5.2.1. By Type

            13.5.2.2. By End-use Industry

    13.6. United Kingdom

        13.6.1. Pricing Analysis

        13.6.2. Market Share Analysis, 2022

            13.6.2.1. By Type

            13.6.2.2. By End-use Industry

    13.7. France

        13.7.1. Pricing Analysis

        13.7.2. Market Share Analysis, 2022

            13.7.2.1. By Type

            13.7.2.2. By End-use Industry

    13.8. Spain

        13.8.1. Pricing Analysis

        13.8.2. Market Share Analysis, 2022

            13.8.2.1. By Type

            13.8.2.2. By End-use Industry

    13.9. Italy

        13.9.1. Pricing Analysis

        13.9.2. Market Share Analysis, 2022

            13.9.2.1. By Type

            13.9.2.2. By End-use Industry

    13.10. China

        13.10.1. Pricing Analysis

        13.10.2. Market Share Analysis, 2022

            13.10.2.1. By Type

            13.10.2.2. By End-use Industry

    13.11. Japan

        13.11.1. Pricing Analysis

        13.11.2. Market Share Analysis, 2022

            13.11.2.1. By Type

            13.11.2.2. By End-use Industry

    13.12. South Korea

        13.12.1. Pricing Analysis

        13.12.2. Market Share Analysis, 2022

            13.12.2.1. By Type

            13.12.2.2. By End-use Industry

    13.13. Malaysia

        13.13.1. Pricing Analysis

        13.13.2. Market Share Analysis, 2022

            13.13.2.1. By Type

            13.13.2.2. By End-use Industry

    13.14. Singapore

        13.14.1. Pricing Analysis

        13.14.2. Market Share Analysis, 2022

            13.14.2.1. By Type

            13.14.2.2. By End-use Industry

    13.15. Australia

        13.15.1. Pricing Analysis

        13.15.2. Market Share Analysis, 2022

            13.15.2.1. By Type

            13.15.2.2. By End-use Industry

    13.16. New Zealand

        13.16.1. Pricing Analysis

        13.16.2. Market Share Analysis, 2022

            13.16.2.1. By Type

            13.16.2.2. By End-use Industry

    13.17. GCC Countries

        13.17.1. Pricing Analysis

        13.17.2. Market Share Analysis, 2022

            13.17.2.1. By Type

            13.17.2.2. By End-use Industry

    13.18. South Africa

        13.18.1. Pricing Analysis

        13.18.2. Market Share Analysis, 2022

            13.18.2.1. By Type

            13.18.2.2. By End-use Industry

    13.19. Israel

        13.19.1. Pricing Analysis

        13.19.2. Market Share Analysis, 2022

            13.19.2.1. By Type

            13.19.2.2. By End-use Industry

14. Market Structure Analysis

    14.1. Competition Dashboard

    14.2. Competition Benchmarking

    14.3. Market Share Analysis of Top Players

        14.3.1. By Regional

        14.3.2. By Type

        14.3.3. By End-use Industry

15. Competition Analysis

    15.1. Competition Deep Dive

        15.1.1. Honeywell International Inc.

            15.1.1.1. Overview

            15.1.1.2. Product Portfolio

            15.1.1.3. Profitability by Market Segments

            15.1.1.4. Sales Footprint

            15.1.1.5. Strategy Overview

                15.1.1.5.1. Marketing Strategy

                15.1.1.5.2. Product Strategy

                15.1.1.5.3. Channel Strategy

        15.1.2. Siemens Group

            15.1.2.1. Overview

            15.1.2.2. Product Portfolio

            15.1.2.3. Profitability by Market Segments

            15.1.2.4. Sales Footprint

            15.1.2.5. Strategy Overview

                15.1.2.5.1. Marketing Strategy

                15.1.2.5.2. Product Strategy

                15.1.2.5.3. Channel Strategy

        15.1.3. Emerson Electric Co

            15.1.3.1. Overview

            15.1.3.2. Product Portfolio

            15.1.3.3. Profitability by Market Segments

            15.1.3.4. Sales Footprint

            15.1.3.5. Strategy Overview

                15.1.3.5.1. Marketing Strategy

                15.1.3.5.2. Product Strategy

                15.1.3.5.3. Channel Strategy

        15.1.4. ABB Ltd

            15.1.4.1. Overview

            15.1.4.2. Product Portfolio

            15.1.4.3. Profitability by Market Segments

            15.1.4.4. Sales Footprint

            15.1.4.5. Strategy Overview

                15.1.4.5.1. Marketing Strategy

                15.1.4.5.2. Product Strategy

                15.1.4.5.3. Channel Strategy

        15.1.5. Yokogawa Electric Corporation

            15.1.5.1. Overview

            15.1.5.2. Product Portfolio

            15.1.5.3. Profitability by Market Segments

            15.1.5.4. Sales Footprint

            15.1.5.5. Strategy Overview

                15.1.5.5.1. Marketing Strategy

                15.1.5.5.2. Product Strategy

                15.1.5.5.3. Channel Strategy

        15.1.6. Azbil Corporation

            15.1.6.1. Overview

            15.1.6.2. Product Portfolio

            15.1.6.3. Profitability by Market Segments

            15.1.6.4. Sales Footprint

            15.1.6.5. Strategy Overview

                15.1.6.5.1. Marketing Strategy

                15.1.6.5.2. Product Strategy

                15.1.6.5.3. Channel Strategy

        15.1.7. Badger Meter, Inc

            15.1.7.1. Overview

            15.1.7.2. Product Portfolio

            15.1.7.3. Profitability by Market Segments

            15.1.7.4. Sales Footprint

            15.1.7.5. Strategy Overview

                15.1.7.5.1. Marketing Strategy

                15.1.7.5.2. Product Strategy

                15.1.7.5.3. Channel Strategy

        15.1.8. Endress+Hauser Management AG

            15.1.8.1. Overview

            15.1.8.2. Product Portfolio

            15.1.8.3. Profitability by Market Segments

            15.1.8.4. Sales Footprint

            15.1.8.5. Strategy Overview

                15.1.8.5.1. Marketing Strategy

                15.1.8.5.2. Product Strategy

                15.1.8.5.3. Channel Strategy

        15.1.9. Krohne Messtechnik GmbH

            15.1.9.1. Overview

            15.1.9.2. Product Portfolio

            15.1.9.3. Profitability by Market Segments

            15.1.9.4. Sales Footprint

            15.1.9.5. Strategy Overview

                15.1.9.5.1. Marketing Strategy

                15.1.9.5.2. Product Strategy

                15.1.9.5.3. Channel Strategy

        15.1.10. Schneider Electric

            15.1.10.1. Overview

            15.1.10.2. Product Portfolio

            15.1.10.3. Profitability by Market Segments

            15.1.10.4. Sales Footprint

            15.1.10.5. Strategy Overview

                15.1.10.5.1. Marketing Strategy

                15.1.10.5.2. Product Strategy

                15.1.10.5.3. Channel Strategy

16. Assumptions & Acronyms Used

17. Research Methodology

List of Tables

Table 1: Global Market Value (US$ Million) Forecast by Region, 2018 to 2033

Table 2: Global Market Volume (Unit) Forecast by Region, 2018 to 2033

Table 3: Global Market Value (US$ Million) Forecast by Type, 2018 to 2033

Table 4: Global Market Volume (Unit) Forecast by Type, 2018 to 2033

Table 5: Global Market Value (US$ Million) Forecast by End-use Industry, 2018 to 2033

Table 6: Global Market Volume (Unit) Forecast by End-use Industry, 2018 to 2033

Table 7: North America Market Value (US$ Million) Forecast by Country, 2018 to 2033

Table 8: North America Market Volume (Unit) Forecast by Country, 2018 to 2033

Table 9: North America Market Value (US$ Million) Forecast by Type, 2018 to 2033

Table 10: North America Market Volume (Unit) Forecast by Type, 2018 to 2033

Table 11: North America Market Value (US$ Million) Forecast by End-use Industry, 2018 to 2033

Table 12: North America Market Volume (Unit) Forecast by End-use Industry, 2018 to 2033

Table 13: Latin America Market Value (US$ Million) Forecast by Country, 2018 to 2033

Table 14: Latin America Market Volume (Unit) Forecast by Country, 2018 to 2033

Table 15: Latin America Market Value (US$ Million) Forecast by Type, 2018 to 2033

Table 16: Latin America Market Volume (Unit) Forecast by Type, 2018 to 2033

Table 17: Latin America Market Value (US$ Million) Forecast by End-use Industry, 2018 to 2033

Table 18: Latin America Market Volume (Unit) Forecast by End-use Industry, 2018 to 2033

Table 19: Europe Market Value (US$ Million) Forecast by Country, 2018 to 2033

Table 20: Europe Market Volume (Unit) Forecast by Country, 2018 to 2033

Table 21: Europe Market Value (US$ Million) Forecast by Type, 2018 to 2033

Table 22: Europe Market Volume (Unit) Forecast by Type, 2018 to 2033

Table 23: Europe Market Value (US$ Million) Forecast by End-use Industry, 2018 to 2033

Table 24: Europe Market Volume (Unit) Forecast by End-use Industry, 2018 to 2033

Table 25: Asia Pacific Market Value (US$ Million) Forecast by Country, 2018 to 2033

Table 26: Asia Pacific Market Volume (Unit) Forecast by Country, 2018 to 2033

Table 27: Asia Pacific Market Value (US$ Million) Forecast by Type, 2018 to 2033

Table 28: Asia Pacific Market Volume (Unit) Forecast by Type, 2018 to 2033

Table 29: Asia Pacific Market Value (US$ Million) Forecast by End-use Industry, 2018 to 2033

Table 30: Asia Pacific Market Volume (Unit) Forecast by End-use Industry, 2018 to 2033

Table 31: MEA Market Value (US$ Million) Forecast by Country, 2018 to 2033

Table 32: MEA Market Volume (Unit) Forecast by Country, 2018 to 2033

Table 33: MEA Market Value (US$ Million) Forecast by Type, 2018 to 2033

Table 34: MEA Market Volume (Unit) Forecast by Type, 2018 to 2033

Table 35: MEA Market Value (US$ Million) Forecast by End-use Industry, 2018 to 2033

Table 36: MEA Market Volume (Unit) Forecast by End-use Industry, 2018 to 2033

List of Charts

Figure 1: Global Market Value (US$ Million) by Type, 2023 to 2033

Figure 2: Global Market Value (US$ Million) by End-use Industry, 2023 to 2033

Figure 3: Global Market Value (US$ Million) by Region, 2023 to 2033

Figure 4: Global Market Value (US$ Million) Analysis by Region, 2018 to 2033

Figure 5: Global Market Volume (Unit) Analysis by Region, 2018 to 2033

Figure 6: Global Market Value Share (%) and BPS Analysis by Region, 2023 to 2033

Figure 7: Global Market Y-o-Y Growth (%) Projections by Region, 2023 to 2033

Figure 8: Global Market Value (US$ Million) Analysis by Type, 2018 to 2033

Figure 9: Global Market Volume (Unit) Analysis by Type, 2018 to 2033

Figure 10: Global Market Value Share (%) and BPS Analysis by Type, 2023 to 2033

Figure 11: Global Market Y-o-Y Growth (%) Projections by Type, 2023 to 2033

Figure 12: Global Market Value (US$ Million) Analysis by End-use Industry, 2018 to 2033

Figure 13: Global Market Volume (Unit) Analysis by End-use Industry, 2018 to 2033

Figure 14: Global Market Value Share (%) and BPS Analysis by End-use Industry, 2023 to 2033

Figure 15: Global Market Y-o-Y Growth (%) Projections by End-use Industry, 2023 to 2033

Figure 16: Global Market Attractiveness by Type, 2023 to 2033

Figure 17: Global Market Attractiveness by End-use Industry, 2023 to 2033

Figure 18: Global Market Attractiveness by Region, 2023 to 2033

Figure 19: North America Market Value (US$ Million) by Type, 2023 to 2033

Figure 20: North America Market Value (US$ Million) by End-use Industry, 2023 to 2033

Figure 21: North America Market Value (US$ Million) by Country, 2023 to 2033

Figure 22: North America Market Value (US$ Million) Analysis by Country, 2018 to 2033

Figure 23: North America Market Volume (Unit) Analysis by Country, 2018 to 2033

Figure 24: North America Market Value Share (%) and BPS Analysis by Country, 2023 to 2033

Figure 25: North America Market Y-o-Y Growth (%) Projections by Country, 2023 to 2033

Figure 26: North America Market Value (US$ Million) Analysis by Type, 2018 to 2033

Figure 27: North America Market Volume (Unit) Analysis by Type, 2018 to 2033

Figure 28: North America Market Value Share (%) and BPS Analysis by Type, 2023 to 2033

Figure 29: North America Market Y-o-Y Growth (%) Projections by Type, 2023 to 2033

Figure 30: North America Market Value (US$ Million) Analysis by End-use Industry, 2018 to 2033

Figure 31: North America Market Volume (Unit) Analysis by End-use Industry, 2018 to 2033

Figure 32: North America Market Value Share (%) and BPS Analysis by End-use Industry, 2023 to 2033

Figure 33: North America Market Y-o-Y Growth (%) Projections by End-use Industry, 2023 to 2033

Figure 34: North America Market Attractiveness by Type, 2023 to 2033

Figure 35: North America Market Attractiveness by End-use Industry, 2023 to 2033

Figure 36: North America Market Attractiveness by Country, 2023 to 2033

Figure 37: Latin America Market Value (US$ Million) by Type, 2023 to 2033

Figure 38: Latin America Market Value (US$ Million) by End-use Industry, 2023 to 2033

Figure 39: Latin America Market Value (US$ Million) by Country, 2023 to 2033

Figure 40: Latin America Market Value (US$ Million) Analysis by Country, 2018 to 2033

Figure 41: Latin America Market Volume (Unit) Analysis by Country, 2018 to 2033

Figure 42: Latin America Market Value Share (%) and BPS Analysis by Country, 2023 to 2033

Figure 43: Latin America Market Y-o-Y Growth (%) Projections by Country, 2023 to 2033

Figure 44: Latin America Market Value (US$ Million) Analysis by Type, 2018 to 2033

Figure 45: Latin America Market Volume (Unit) Analysis by Type, 2018 to 2033

Figure 46: Latin America Market Value Share (%) and BPS Analysis by Type, 2023 to 2033

Figure 47: Latin America Market Y-o-Y Growth (%) Projections by Type, 2023 to 2033

Figure 48: Latin America Market Value (US$ Million) Analysis by End-use Industry, 2018 to 2033

Figure 49: Latin America Market Volume (Unit) Analysis by End-use Industry, 2018 to 2033

Figure 50: Latin America Market Value Share (%) and BPS Analysis by End-use Industry, 2023 to 2033

Figure 51: Latin America Market Y-o-Y Growth (%) Projections by End-use Industry, 2023 to 2033

Figure 52: Latin America Market Attractiveness by Type, 2023 to 2033

Figure 53: Latin America Market Attractiveness by End-use Industry, 2023 to 2033

Figure 54: Latin America Market Attractiveness by Country, 2023 to 2033

Figure 55: Europe Market Value (US$ Million) by Type, 2023 to 2033

Figure 56: Europe Market Value (US$ Million) by End-use Industry, 2023 to 2033

Figure 57: Europe Market Value (US$ Million) by Country, 2023 to 2033

Figure 58: Europe Market Value (US$ Million) Analysis by Country, 2018 to 2033

Figure 59: Europe Market Volume (Unit) Analysis by Country, 2018 to 2033

Figure 60: Europe Market Value Share (%) and BPS Analysis by Country, 2023 to 2033

Figure 61: Europe Market Y-o-Y Growth (%) Projections by Country, 2023 to 2033

Figure 62: Europe Market Value (US$ Million) Analysis by Type, 2018 to 2033

Figure 63: Europe Market Volume (Unit) Analysis by Type, 2018 to 2033

Figure 64: Europe Market Value Share (%) and BPS Analysis by Type, 2023 to 2033

Figure 65: Europe Market Y-o-Y Growth (%) Projections by Type, 2023 to 2033

Figure 66: Europe Market Value (US$ Million) Analysis by End-use Industry, 2018 to 2033

Figure 67: Europe Market Volume (Unit) Analysis by End-use Industry, 2018 to 2033

Figure 68: Europe Market Value Share (%) and BPS Analysis by End-use Industry, 2023 to 2033

Figure 69: Europe Market Y-o-Y Growth (%) Projections by End-use Industry, 2023 to 2033

Figure 70: Europe Market Attractiveness by Type, 2023 to 2033

Figure 71: Europe Market Attractiveness by End-use Industry, 2023 to 2033

Figure 72: Europe Market Attractiveness by Country, 2023 to 2033

Figure 73: Asia Pacific Market Value (US$ Million) by Type, 2023 to 2033

Figure 74: Asia Pacific Market Value (US$ Million) by End-use Industry, 2023 to 2033

Figure 75: Asia Pacific Market Value (US$ Million) by Country, 2023 to 2033

Figure 76: Asia Pacific Market Value (US$ Million) Analysis by Country, 2018 to 2033

Figure 77: Asia Pacific Market Volume (Unit) Analysis by Country, 2018 to 2033

Figure 78: Asia Pacific Market Value Share (%) and BPS Analysis by Country, 2023 to 2033

Figure 79: Asia Pacific Market Y-o-Y Growth (%) Projections by Country, 2023 to 2033

Figure 80: Asia Pacific Market Value (US$ Million) Analysis by Type, 2018 to 2033

Figure 81: Asia Pacific Market Volume (Unit) Analysis by Type, 2018 to 2033

Figure 82: Asia Pacific Market Value Share (%) and BPS Analysis by Type, 2023 to 2033

Figure 83: Asia Pacific Market Y-o-Y Growth (%) Projections by Type, 2023 to 2033

Figure 84: Asia Pacific Market Value (US$ Million) Analysis by End-use Industry, 2018 to 2033

Figure 85: Asia Pacific Market Volume (Unit) Analysis by End-use Industry, 2018 to 2033

Figure 86: Asia Pacific Market Value Share (%) and BPS Analysis by End-use Industry, 2023 to 2033

Figure 87: Asia Pacific Market Y-o-Y Growth (%) Projections by End-use Industry, 2023 to 2033

Figure 88: Asia Pacific Market Attractiveness by Type, 2023 to 2033

Figure 89: Asia Pacific Market Attractiveness by End-use Industry, 2023 to 2033

Figure 90: Asia Pacific Market Attractiveness by Country, 2023 to 2033

Figure 91: MEA Market Value (US$ Million) by Type, 2023 to 2033

Figure 92: MEA Market Value (US$ Million) by End-use Industry, 2023 to 2033

Figure 93: MEA Market Value (US$ Million) by Country, 2023 to 2033

Figure 94: MEA Market Value (US$ Million) Analysis by Country, 2018 to 2033

Figure 95: MEA Market Volume (Unit) Analysis by Country, 2018 to 2033

Figure 96: MEA Market Value Share (%) and BPS Analysis by Country, 2023 to 2033

Figure 97: MEA Market Y-o-Y Growth (%) Projections by Country, 2023 to 2033

Figure 98: MEA Market Value (US$ Million) Analysis by Type, 2018 to 2033

Figure 99: MEA Market Volume (Unit) Analysis by Type, 2018 to 2033

Figure 100: MEA Market Value Share (%) and BPS Analysis by Type, 2023 to 2033

Figure 101: MEA Market Y-o-Y Growth (%) Projections by Type, 2023 to 2033

Figure 102: MEA Market Value (US$ Million) Analysis by End-use Industry, 2018 to 2033

Figure 103: MEA Market Volume (Unit) Analysis by End-use Industry, 2018 to 2033

Figure 104: MEA Market Value Share (%) and BPS Analysis by End-use Industry, 2023 to 2033

Figure 105: MEA Market Y-o-Y Growth (%) Projections by End-use Industry, 2023 to 2033

Figure 106: MEA Market Attractiveness by Type, 2023 to 2033

Figure 107: MEA Market Attractiveness by End-use Industry, 2023 to 2033

Figure 108: MEA Market Attractiveness by Country, 2023 to 2033

Recommendations

Industrial Automation

Air Flow Sensors Market

Published : July 2023

Industrial Automation

Intelligent Flow Meter Market

Published : November 2022

Explore Industrial Automation Insights

View Reports