Inflow Pressure Screen Market Size and Share Forecast Outlook 2025 to 2035

The global inflow pressure screen market is projected to grow from USD 911.1 million in 2025 to approximately USD 1,310.2 million by 2035, recording an absolute increase of USD 401.6 million over the forecast period. This translates into a total growth of 44.1%, with the market forecast to expand at a compound annual growth rate (CAGR) of 3.7% between 2025 and 2035. The overall market size is expected to grow by nearly 1.44X during the same period, supported by the rising adoption of advanced screening technologies and increasing demand for efficient filtration solutions across industrial applications.
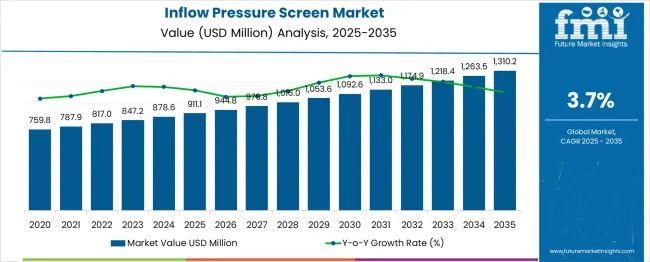
Quick Stats for Inflow Pressure Screen Market

  • Inflow Pressure Screen Market Value (2025): USD 911.1 million
  • Inflow Pressure Screen Market Forecast Value (2035): USD 1,310.2 million
  • Inflow Pressure Screen Market Forecast CAGR: 3.7%
  • Leading Product Construction in Inflow Pressure Screen Market: Standard-Duty (40.0%)
  • Key Growth Regions in Inflow Pressure Screen Market: North America, Asia Pacific, and Europe
  • Key Players in Inflow Pressure Screen Market: AFT (Aikawa Fiber Technologies), ANDRITZ, Bellmer, GL&V (Valmet legacy), Kadant Fiber Processing, Leizhan Machinery, PAPCEL, Parason Machinery, Valmet, Voith

Inflow Pressure Screen Market Market Value Analysis

Between 2025 and 2030, the inflow pressure screen market is projected to expand from USD 911.1 million to USD 1,090.5 million, resulting in a value increase of USD 179.4 million, which represents 44.7% of the total forecast growth for the decade. This phase of growth will be shaped by rising demand for efficient screening solutions in pulp and paper industries, increasing water treatment requirements, and growing awareness among industrial operators about the importance of proper filtration systems. Manufacturers are expanding their production capabilities to address the growing complexity of modern industrial screening requirements.

Inflow Pressure Screen Market Key Takeaways

Metric Value
Estimated Value in (2025E) USD 911.1 million
Forecast Value in (2035F) USD 1,310.2 million
Forecast CAGR (2025 to 2035) 3.7%

From 2030 to 2035, the market is forecast to grow from USD 1,090.5 million to USD 1,310.2 million, adding another USD 222.2 million, which constitutes 55.3% of the overall ten-year expansion. This period is expected to be characterized by expansion of hygienic and cleanroom screening solutions, integration of advanced materials technology, and development of standardized screening protocols across different industrial applications. The growing adoption of sustainable manufacturing processes will drive demand for more sophisticated screening systems and specialized technical expertise.

Between 2020 and 2025, the inflow pressure screen market experienced steady expansion, driven by increasing industrialization rates and growing awareness of screening requirements in various manufacturing processes. The market developed as industrial facilities recognized the need for specialized equipment and maintenance to properly operate screening systems. Environmental regulations and industrial manufacturers began emphasizing proper screening procedures to maintain process efficiency and regulatory compliance.

Why the Inflow Pressure Screen Market is Growing?

Market expansion is being supported by the rapid increase in industrial manufacturing worldwide and the corresponding need for specialized screening solutions in processing, filtration, and separation applications. Modern industrial facilities rely on precise screening and filtration to ensure proper functioning of production systems including pulp processing, chemical separation, and water treatment. Even minor efficiency improvements in screening can result in significant cost savings and enhanced product quality for industrial operators.

The growing complexity of industrial processes and increasing environmental compliance requirements are driving demand for professional screening solutions from certified providers with appropriate equipment and expertise. Regulatory agencies are increasingly requiring proper screening documentation and efficiency standards to maintain environmental compliance and ensure operational safety. Industrial specifications and manufacturer requirements are establishing standardized screening procedures that require specialized equipment and trained technicians.

Segmental Analysis

The market is segmented by product construction, capacity/size class, end-use sector, compliance/standard, and region. By product construction, the market is divided into standard-duty, heavy-duty/corrosion-resistant, and hygienic/cleanroom configurations. Based on capacity/size class, the market is categorized into small, medium, and large capacity systems. In terms of end-use sector, the market spans across food & beverage processing, chemicals & petrochemicals, power generation & utilities, and other industrial applications. By compliance/standard, the market is classified into ISO/EN, ANSI/ASME, and customer/other specifications. Regionally, the market includes major industrial regions with India, China, Australia, France, and the United States leading growth.
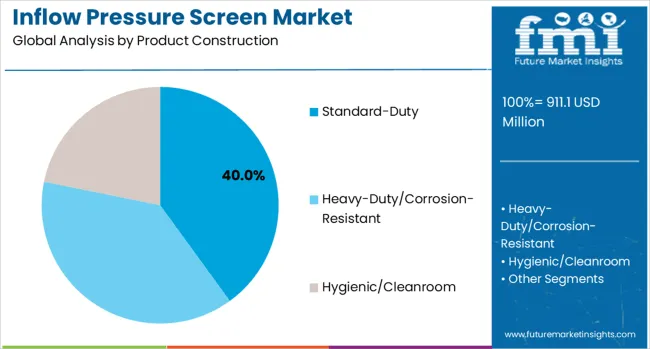
By Product Construction, Standard-Duty Segment Accounts for 40% Market Share

Inflow Pressure Screen Market Analysis By Product Construction

The standard-duty construction segment is projected to account for 40% of the inflow pressure screen market in 2025, establishing itself as the leading product class. Standard-duty screens are widely used across industries where general-purpose screening is sufficient, such as pulp and paper, municipal water treatment, and light industrial processing. Their appeal lies in reliable performance under normal operating conditions, supported by the use of proven materials and long-standing manufacturing processes.

This segment benefits from cost-effectiveness, broad product availability, and established supplier networks that streamline procurement and maintenance. Facilities often prefer standard-duty configurations as they balance performance and affordability without over-engineering. Their durability and compatibility with common screening systems make them the default choice for conventional applications, ensuring strong adoption across both developing and mature industrial markets.

By Capacity/Size Class, Medium Segment Accounts for 45% Market Share

Medium-capacity inflow pressure screens are expected to represent 45% of demand in 2025, making them the most dominant size class. These systems provide an optimal mix of processing capability and operational flexibility, allowing them to serve the needs of most industrial operations. Medium-capacity models are increasingly favored for their scalability, offering solutions that can adapt to both mid-sized and expanding production facilities.

The segment also benefits from the integration of advanced controls that optimize performance under variable loads, ensuring efficiency across a range of operating conditions. Medium-sized screens strike a balance between investment cost and throughput capacity, making them attractive for facilities seeking operational efficiency. With industries demanding reliable and flexible solutions, medium-capacity screens remain the most practical option for broad industrial adoption.
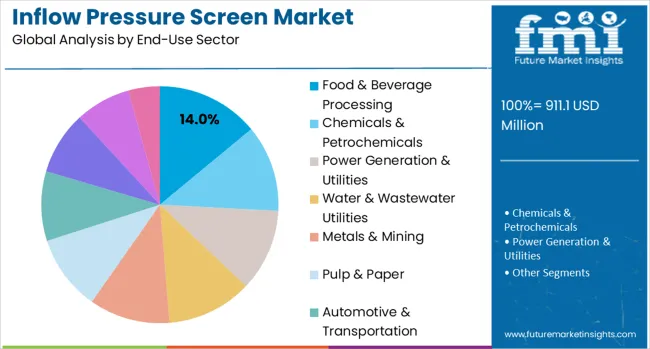
By End-Use Sector, Food & Beverage Processing Segment Accounts for 14% Market Share

Inflow Pressure Screen Market Analysis By End Use Sector

The food and beverage processing sector is projected to contribute 14% of the inflow pressure screen market in 2025, making it the single largest end-use application. Facilities in this sector require hygienic design, stainless steel materials, and strict compliance with international food safety standards. Multiple screening stages are often deployed to ensure product purity, consistent quality, and protection of downstream equipment.

This segment benefits from the rising demand for processed foods, dairy products, and beverages worldwide, as well as increasing automation in food production. Inflow pressure screens are vital for maintaining cleanliness and efficiency in high-volume operations. The emphasis on regulatory compliance, traceability, and sanitation ensures that food and beverage processors continue to be a primary driver of demand for specialized industrial screening solutions.

By Compliance/Standard, ISO/EN Segment Accounts for 40% Market Share

The ISO/EN compliance segment is estimated to hold 40% of the inflow pressure screen market in 2025, reflecting its strong global acceptance. ISO/EN frameworks set widely recognized benchmarks for quality, safety, and design consistency, making them the preferred standards for both equipment manufacturers and end users.

Adherence to these standards facilitates international trade and equipment interoperability, allowing manufacturers to serve global markets with confidence. Industrial facilities also benefit from reduced regulatory risks and easier integration when using ISO/EN-compliant equipment. As globalization accelerates, ISO/EN standards provide the framework for standardized processes, documentation, and service requirements, ensuring consistency across diverse industrial screening applications.

What are the Drivers, Restraints, and Key Trends of the Inflow Pressure Screen Market?

The inflow pressure screen market is advancing steadily due to increasing industrial automation and growing recognition of screening efficiency importance. However, the market faces challenges including high equipment costs, need for continuous maintenance training on new screening technologies, and varying performance requirements across different industrial applications. Standardization efforts and certification programs continue to influence equipment quality and market development patterns.

Expansion of Hygienic and Cleanroom Screening Solutions

The growing deployment of hygienic and cleanroom screening systems is enabling specialized applications in pharmaceutical, food processing, and semiconductor manufacturing facilities. Advanced screening systems equipped with specialized materials and surface treatments provide contamination control and reduced maintenance requirements for customers while expanding application possibilities. These systems are particularly valuable for high-purity applications and regulated industries that require validated cleaning and sterilization procedures.

Integration of Advanced Materials and Coating Technologies

Modern screening system manufacturers are incorporating advanced materials and surface coating technologies that improve corrosion resistance and extend service life. Integration of specialty alloys, ceramic coatings, and polymer-based screening elements enables more precise screening performance and comprehensive operational documentation. Advanced materials also support screening of aggressive chemicals and high-temperature applications including specialized industrial processes and demanding operational environments.
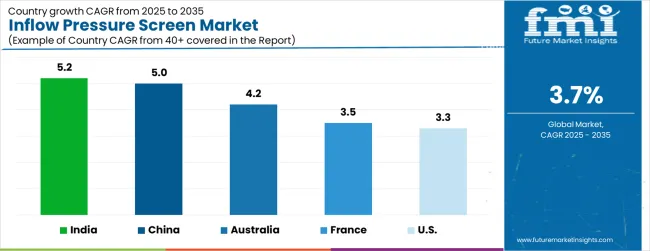
Analysis of Inflow Pressure Screen Market by Key Country

Inflow Pressure Screen Market Cagr Analysis By Country

Country CAGR (2025 to 2035)
India 5.2%
China 5.0%
Australia 4.2%
France 3.5%
United States 3.3%

The inflow pressure screen market is growing rapidly, with India leading at a 5.2% CAGR through 2035, driven by strong industrial expansion, government infrastructure initiatives, and expanding manufacturing networks. China follows at 5.0%, supported by massive industrial production capacity and increasing environmental compliance requirements in manufacturing facilities. Australia grows steadily at 4.2%, integrating screening technology into its established mining and processing industries. France records 3.5%, emphasizing precision engineering, quality standards, and advanced industrial expertise. The USA shows steady growth at 3.3%, focusing on technological innovation, operational efficiency, and compliance-driven upgrades. Overall, India and China emerge as the leading drivers of global inflow pressure screen market expansion.

The report covers an in-depth analysis of 40+ countries; five top-performing countries are highlighted below.

India Leads Global Market Growth with Industrial Expansion

Revenue from inflow pressure screens in India is projected to exhibit the highest growth rate with a CAGR of 5.2% through 2035, driven by rapid industrial development and increasing demand for efficient processing equipment. The country's expanding manufacturing sector and growing pulp and paper industry are creating significant demand for screening solutions. Major industrial manufacturers and equipment suppliers are establishing comprehensive distribution networks to support the growing population of industrial facilities across urban and rural markets.

  • Government industrial development policies are supporting modernization of manufacturing facilities and screening equipment requirements, driving demand for certified screening solution providers throughout major industrial regions.
  • Manufacturing industry expansion programs are supporting development of specialized screening facilities and training programs that enhance service capability and technical expertise across industrial networks.

China Demonstrates Strong Market Potential with Manufacturing Growth

Revenue from inflow pressure screens in China is expanding at a CAGR of 5.0%, supported by massive industrial production capacity and increasing environmental compliance requirements in manufacturing facilities. The country's established manufacturing sector and increasing focus on process efficiency are driving demand for professional screening solutions. Industrial facilities and specialized equipment suppliers are establishing capabilities to serve the growing demand for advanced screening systems.

  • Industrial modernization programs and environmental compliance requirements are creating opportunities for specialized screening equipment providers that can support diverse industrial applications and regulatory requirements.
  • Professional training and certification programs are developing technical expertise among equipment operators, enabling comprehensive screening system operation that meets international quality and environmental standards nationwide.

Australia Maintains Steady Growth with Resource Industry Development

Revenue from inflow pressure screens in Australia is growing at a CAGR of 4.2%, driven by the country's established mining and mineral processing industries and growing recognition of screening efficiency importance in resource extraction. The country's advanced industrial sector is integrating screening capabilities to serve modern processing technologies. Mining operations and processing facilities are investing in screening equipment upgrades to address growing operational demands.

  • Mining industry modernization is facilitating adoption of advanced screening technologies that support comprehensive processing capabilities across major mining and industrial regions.
  • Professional service development programs are enhancing technical capabilities among industrial operators, enabling specialized screening system operation that meets evolving processing technology requirements and operational expectations.

France Focuses on Precision Engineering and Technical Excellence

Demand for inflow pressure screens in France is projected to grow at a CAGR of 3.5%, supported by the country's emphasis on industrial technology innovation and precision equipment manufacturing. French industrial equipment providers are implementing comprehensive screening capabilities that meet stringent quality standards and regulatory specifications. The market is characterized by focus on technical excellence, advanced materials integration, and compliance with comprehensive industrial safety and environmental regulations.

  • Industrial equipment industry investments are prioritizing advanced screening technologies that demonstrate superior performance and reliability while meeting French industrial quality and environmental standards.
  • Professional certification programs are ensuring comprehensive technical expertise among equipment operators, enabling specialized screening system operation that supports diverse industrial applications and regulatory requirements.

United States Emphasizes Technology Innovation and Operational Efficiency

Demand for inflow pressure screens in the USA is expanding at a CAGR of 3.3%, driven by industrial modernization initiatives and growing emphasis on operational efficiency improvements. Large industrial facilities and specialized equipment providers are establishing comprehensive screening capabilities to serve diverse processing needs. The market benefits from environmental regulatory requirements for proper screening system operation and manufacturer compliance following equipment installation and maintenance activities.
  • Industrial facility consolidation is enabling standardized screening system implementation across multiple locations, providing consistent operational performance and comprehensive coverage throughout regional markets.
  • Professional training and certification programs are developing specialized technical expertise among equipment operators, enabling comprehensive screening system capabilities that support evolving industrial processing requirements.

Europe Market Split by Country

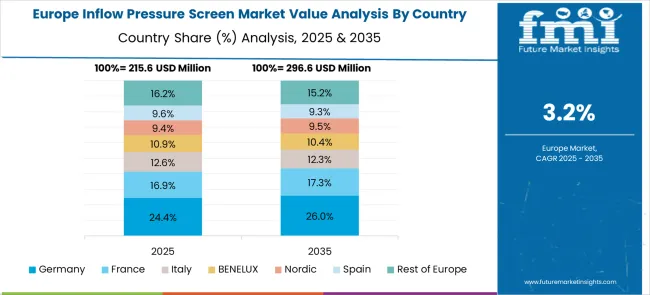
Inflow Pressure Screen Market Europe Country Market Share Analysis, 2025 & 2035

The inflow pressure screen market in Europe is projected to grow steadily, with France representing a significant portion of the regional market. France is expected to maintain strong growth supported by its established industrial manufacturing sector and advanced process industries. The country benefits from comprehensive environmental regulations that drive demand for efficient screening technologies and established supplier networks that provide comprehensive service coverage.

Other major European markets including Germany, UK, and Nordic countries contribute significantly to regional demand through their advanced manufacturing sectors and stringent environmental compliance requirements. These markets emphasize technological innovation, operational efficiency, and compliance with comprehensive industrial safety and environmental standards.
Competitive Landscape of Inflow Pressure Screen Market

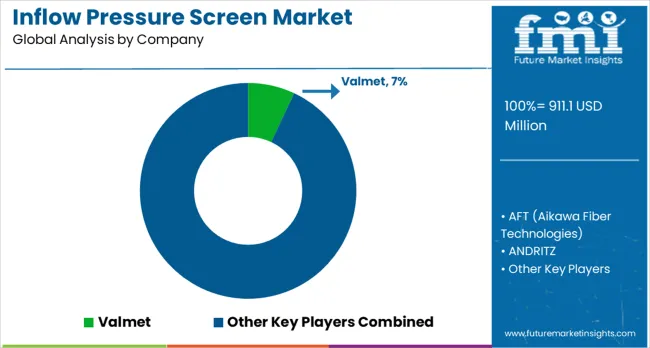
Inflow Pressure Screen Market Analysis By Company

The inflow pressure screen market is defined by competition among specialized equipment manufacturers, industrial equipment suppliers, and process technology companies. Companies are investing in advanced screening technologies, comprehensive service capabilities, standardized manufacturing processes, and technical support programs to deliver precise, reliable, and cost-effective screening solutions. Strategic partnerships, technological innovation, and geographic expansion are central to strengthening product portfolios and market presence.

AFT (Aikawa Fiber Technologies), USA/Japan-based, offers advanced screening systems with a focus on precision engineering, operational efficiency, and technical expertise. ANDRITZ, operating from Austria globally, provides comprehensive screening solutions integrated with industrial process equipment and automation systems. Bellmer, Germany, delivers technologically advanced screening systems with standardized manufacturing procedures and digital integration. GL&V (Valmet legacy), Canada/Global, emphasizes comprehensive service and worldwide coverage for industrial screening applications.

Kadant Fiber Processing, USA, offers screening solutions integrated with fiber processing and pulp production operations. Leizhan Machinery, China, provides cost-effective screening systems with established manufacturing capabilities. PAPCEL, Czechia, delivers specialized screening expertise for pulp and paper applications. Parason Machinery, India, offers regionally-focused screening solutions with competitive pricing. Valmet, Finland, provides comprehensive industrial screening systems with global service support. Voith, Germany, offers specialized screening expertise, advanced engineering, and operational reliability across global and regional networks.

Key Players in the Inflow Pressure Screen Market

  • AFT (Aikawa Fiber Technologies)
  • ANDRITZ
  • Bellmer
  • GL&V (Valmet legacy)
  • Kadant Fiber Processing
  • Leizhan Machinery
  • PAPCEL
  • Parason Machinery
  • Valmet
  • Voith

Scope of the Report

Items Values
Quantitative Units (2025) USD 911.1 million
Product Construction Standard-Duty, Heavy-Duty/Corrosion-Resistant, Hygienic/Cleanroom
Capacity/Size Class Small, Medium, Large
End-Use Sector Food & Beverage Processing, Chemicals & Petrochemicals, Power Generation & Utilities, Water & Wastewater Utilities, Metals & Mining, Pulp & Paper, Automotive & Transportation, Electronics & Semiconductors, Oil & Gas, Construction & Building Services
Compliance/Standard ISO/EN, ANSI/ASME, Customer/Other
Regions Covered North America, Europe, East Asia, South Asia & Pacific, Latin America, Middle East & Africa
Countries Covered United States, Canada, United Kingdom, Germany, France, China, Japan, South Korea, Brazil, Australia and 40+ countries
Key Companies Profiled AFT (Aikawa Fiber Technologies), ANDRITZ, Bellmer, GL&V (Valmet legacy), Kadant Fiber Processing, Leizhan Machinery, PAPCEL, Parason Machinery, Valmet, and Voith
Additional Attributes Dollar sales by screen type and capacity range, regional demand trends, competitive landscape, buyer preferences for continuous versus batch systems, integration with pulp and paper processing lines, innovations in rotor design, energy efficiency, and wear-resistant materials

Inflow Pressure Screen Market by Segments

Product Construction:

  • Standard-Duty
  • Heavy-Duty/Corrosion-Resistant
  • Hygienic/Cleanroom

Capacity/Size Class:

  • Small
  • Medium
  • Large

End-Use Sector:

  • Food & Beverage Processing
  • Chemicals & Petrochemicals
  • Power Generation & Utilities
  • Water & Wastewater Utilities
  • Metals & Mining
  • Pulp & Paper
  • Automotive & Transportation
  • Electronics & Semiconductors
  • Oil & Gas (Up/Downstream)
  • Construction & Building Services

Compliance/Standard:

  • ISO/EN
  • ANSI/ASME
  • Customer/Other

Region:

  • North America
    • United States
    • Canada
    • Mexico
  • Europe
    • Germany
    • United Kingdom
    • France
    • Italy
    • Spain
    • Nordic
    • BENELUX
    • Rest of Europe
  • East Asia
    • China
    • Japan
    • South Korea
  • South Asia & Pacific
    • India
    • ASEAN
    • Australia & New Zealand
    • Rest of South Asia & Pacific
  • Latin America
    • Brazil
    • Chile
    • Rest of Latin America
  • Middle East & Africa
    • Kingdom of Saudi Arabia
    • Other GCC Countries
    • Turkey
    • South Africa
    • Other African Union
    • Rest of Middle East & Africa

Table of Content

  1. Executive Summary
    • Global Market Outlook
    • Demand-side Trends
    • Supply-side Trends
    • Technology Roadmap Analysis
    • Analysis and Recommendations
  2. Market Overview
    • Market Coverage / Taxonomy
    • Market Definition / Scope / Limitations
  3. Market Background
    • Market Dynamics
      • Drivers
      • Restraints
      • Opportunity
      • Trends
    • Scenario Forecast
      • Demand in Optimistic Scenario
      • Demand in Likely Scenario
      • Demand in Conservative Scenario
    • Opportunity Map Analysis
    • Product Life Cycle Analysis
    • Supply Chain Analysis
    • Investment Feasibility Matrix
    • Value Chain Analysis
    • PESTLE and Porter’s Analysis
    • Regulatory Landscape
    • Regional Parent Market Outlook
    • Production and Consumption Statistics
    • Import and Export Statistics
  4. Global Market Analysis 2020 to 2024 and Forecast, 2025 to 2035
    • Historical Market Size Value (USD Million) Analysis, 2020 to 2024
    • Current and Future Market Size Value (USD Million) Projections, 2025 to 2035
      • Y-o-Y Growth Trend Analysis
      • Absolute $ Opportunity Analysis
  5. Global Market Pricing Analysis 2020 to 2024 and Forecast 2025 to 2035
  6. Global Market Analysis 2020 to 2024 and Forecast 2025 to 2035, By Product Construction
    • Introduction / Key Findings
    • Historical Market Size Value (USD Million) Analysis By Product Construction , 2020 to 2024
    • Current and Future Market Size Value (USD Million) Analysis and Forecast By Product Construction , 2025 to 2035
      • Standard-Duty
      • Heavy-Duty/Corrosion-Resistant
      • Hygienic/Cleanroom
      • Special mission
      • Others
    • Y-o-Y Growth Trend Analysis By Product Construction , 2020 to 2024
    • Absolute $ Opportunity Analysis By Product Construction , 2025 to 2035
  7. Global Market Analysis 2020 to 2024 and Forecast 2025 to 2035, By Capacity/Size Class
    • Introduction / Key Findings
    • Historical Market Size Value (USD Million) Analysis By Capacity/Size Class, 2020 to 2024
    • Current and Future Market Size Value (USD Million) Analysis and Forecast By Capacity/Size Class, 2025 to 2035
      • Medium
      • Small
      • Large
      • Water & Wastewater Utilities
      • Metals & Mining
      • Pulp & Paper
      • Automotive & Transportation
      • Electronics & Semiconductors
      • Oil & Gas (Up/Downstream)
      • Construction & Building Services
    • Y-o-Y Growth Trend Analysis By Capacity/Size Class, 2020 to 2024
    • Absolute $ Opportunity Analysis By Capacity/Size Class, 2025 to 2035
  8. Global Market Analysis 2020 to 2024 and Forecast 2025 to 2035, By End-Use Sector
    • Introduction / Key Findings
    • Historical Market Size Value (USD Million) Analysis By End-Use Sector, 2020 to 2024
    • Current and Future Market Size Value (USD Million) Analysis and Forecast By End-Use Sector, 2025 to 2035
      • Food & Beverage Processing
      • Chemicals & Petrochemicals
      • Power Generation & Utilities
      • Water & Wastewater Utilities
      • Metals & Mining
      • Pulp & Paper
      • Automotive & Transportation
      • Electronics & Semiconductors
      • Oil & Gas (Up/Downstream)
      • Construction & Building Services
    • Y-o-Y Growth Trend Analysis By End-Use Sector, 2020 to 2024
    • Absolute $ Opportunity Analysis By End-Use Sector, 2025 to 2035
  9. Global Market Analysis 2020 to 2024 and Forecast 2025 to 2035, By Compliance/Standard
    • Introduction / Key Findings
    • Historical Market Size Value (USD Million) Analysis By Compliance/Standard, 2020 to 2024
    • Current and Future Market Size Value (USD Million) Analysis and Forecast By Compliance/Standard, 2025 to 2035
      • ISO/EN
      • ANSI/ASME
      • Customer/Other
      • Others
      • Rest of World
    • Y-o-Y Growth Trend Analysis By Compliance/Standard, 2020 to 2024
    • Absolute $ Opportunity Analysis By Compliance/Standard, 2025 to 2035
  10. Global Market Analysis 2020 to 2024 and Forecast 2025 to 2035, By Region
    • Introduction
    • Historical Market Size Value (USD Million) Analysis By Region, 2020 to 2024
    • Current Market Size Value (USD Million) Analysis and Forecast By Region, 2025 to 2035
      • North America
      • Latin America
      • Western Europe
      • Eastern Europe
      • East Asia
      • South Asia and Pacific
      • Middle East & Africa
    • Market Attractiveness Analysis By Region
  11. North America Market Analysis 2020 to 2024 and Forecast 2025 to 2035, By Country
    • Historical Market Size Value (USD Million) Trend Analysis By Market Taxonomy, 2020 to 2024
    • Market Size Value (USD Million) Forecast By Market Taxonomy, 2025 to 2035
      • By Country
        • USA
        • Canada
        • Mexico
      • By Product Construction
      • By Capacity/Size Class
      • By End-Use Sector
      • By Compliance/Standard
    • Market Attractiveness Analysis
      • By Country
      • By Product Construction
      • By Capacity/Size Class
      • By End-Use Sector
      • By Compliance/Standard
    • Key Takeaways
  12. Latin America Market Analysis 2020 to 2024 and Forecast 2025 to 2035, By Country
    • Historical Market Size Value (USD Million) Trend Analysis By Market Taxonomy, 2020 to 2024
    • Market Size Value (USD Million) Forecast By Market Taxonomy, 2025 to 2035
      • By Country
        • Brazil
        • Chile
        • Rest of Latin America
      • By Product Construction
      • By Capacity/Size Class
      • By End-Use Sector
      • By Compliance/Standard
    • Market Attractiveness Analysis
      • By Country
      • By Product Construction
      • By Capacity/Size Class
      • By End-Use Sector
      • By Compliance/Standard
    • Key Takeaways
  13. Western Europe Market Analysis 2020 to 2024 and Forecast 2025 to 2035, By Country
    • Historical Market Size Value (USD Million) Trend Analysis By Market Taxonomy, 2020 to 2024
    • Market Size Value (USD Million) Forecast By Market Taxonomy, 2025 to 2035
      • By Country
        • Germany
        • UK
        • Italy
        • Spain
        • France
        • Nordic
        • BENELUX
        • Rest of Western Europe
      • By Product Construction
      • By Capacity/Size Class
      • By End-Use Sector
      • By Compliance/Standard
    • Market Attractiveness Analysis
      • By Country
      • By Product Construction
      • By Capacity/Size Class
      • By End-Use Sector
      • By Compliance/Standard
    • Key Takeaways
  14. Eastern Europe Market Analysis 2020 to 2024 and Forecast 2025 to 2035, By Country
    • Historical Market Size Value (USD Million) Trend Analysis By Market Taxonomy, 2020 to 2024
    • Market Size Value (USD Million) Forecast By Market Taxonomy, 2025 to 2035
      • By Country
        • Russia
        • Poland
        • Hungary
        • Balkan & Baltic
        • Rest of Eastern Europe
      • By Product Construction
      • By Capacity/Size Class
      • By End-Use Sector
      • By Compliance/Standard
    • Market Attractiveness Analysis
      • By Country
      • By Product Construction
      • By Capacity/Size Class
      • By End-Use Sector
      • By Compliance/Standard
    • Key Takeaways
  15. East Asia Market Analysis 2020 to 2024 and Forecast 2025 to 2035, By Country
    • Historical Market Size Value (USD Million) Trend Analysis By Market Taxonomy, 2020 to 2024
    • Market Size Value (USD Million) Forecast By Market Taxonomy, 2025 to 2035
      • By Country
        • China
        • Japan
        • South Korea
      • By Product Construction
      • By Capacity/Size Class
      • By End-Use Sector
      • By Compliance/Standard
    • Market Attractiveness Analysis
      • By Country
      • By Product Construction
      • By Capacity/Size Class
      • By End-Use Sector
      • By Compliance/Standard
    • Key Takeaways
  16. South Asia and Pacific Market Analysis 2020 to 2024 and Forecast 2025 to 2035, By Country
    • Historical Market Size Value (USD Million) Trend Analysis By Market Taxonomy, 2020 to 2024
    • Market Size Value (USD Million) Forecast By Market Taxonomy, 2025 to 2035
      • By Country
        • India
        • ASEAN
        • Australia & New Zealand
        • Rest of South Asia and Pacific
      • By Product Construction
      • By Capacity/Size Class
      • By End-Use Sector
      • By Compliance/Standard
    • Market Attractiveness Analysis
      • By Country
      • By Product Construction
      • By Capacity/Size Class
      • By End-Use Sector
      • By Compliance/Standard
    • Key Takeaways
  17. Middle East & Africa Market Analysis 2020 to 2024 and Forecast 2025 to 2035, By Country
    • Historical Market Size Value (USD Million) Trend Analysis By Market Taxonomy, 2020 to 2024
    • Market Size Value (USD Million) Forecast By Market Taxonomy, 2025 to 2035
      • By Country
        • Kingdom of Saudi Arabia
        • Other GCC Countries
        • Turkiye
        • South Africa
        • Other African Union
        • Rest of Middle East & Africa
      • By Product Construction
      • By Capacity/Size Class
      • By End-Use Sector
      • By Compliance/Standard
    • Market Attractiveness Analysis
      • By Country
      • By Product Construction
      • By Capacity/Size Class
      • By End-Use Sector
      • By Compliance/Standard
    • Key Takeaways
  18. Key Countries Market Analysis
    • USA
      • Pricing Analysis
      • Market Share Analysis, 2024
        • By Product Construction
        • By Capacity/Size Class
        • By End-Use Sector
        • By Compliance/Standard
    • Canada
      • Pricing Analysis
      • Market Share Analysis, 2024
        • By Product Construction
        • By Capacity/Size Class
        • By End-Use Sector
        • By Compliance/Standard
    • Mexico
      • Pricing Analysis
      • Market Share Analysis, 2024
        • By Product Construction
        • By Capacity/Size Class
        • By End-Use Sector
        • By Compliance/Standard
    • Brazil
      • Pricing Analysis
      • Market Share Analysis, 2024
        • By Product Construction
        • By Capacity/Size Class
        • By End-Use Sector
        • By Compliance/Standard
    • Chile
      • Pricing Analysis
      • Market Share Analysis, 2024
        • By Product Construction
        • By Capacity/Size Class
        • By End-Use Sector
        • By Compliance/Standard
    • Germany
      • Pricing Analysis
      • Market Share Analysis, 2024
        • By Product Construction
        • By Capacity/Size Class
        • By End-Use Sector
        • By Compliance/Standard
    • UK
      • Pricing Analysis
      • Market Share Analysis, 2024
        • By Product Construction
        • By Capacity/Size Class
        • By End-Use Sector
        • By Compliance/Standard
    • Italy
      • Pricing Analysis
      • Market Share Analysis, 2024
        • By Product Construction
        • By Capacity/Size Class
        • By End-Use Sector
        • By Compliance/Standard
    • Spain
      • Pricing Analysis
      • Market Share Analysis, 2024
        • By Product Construction
        • By Capacity/Size Class
        • By End-Use Sector
        • By Compliance/Standard
    • France
      • Pricing Analysis
      • Market Share Analysis, 2024
        • By Product Construction
        • By Capacity/Size Class
        • By End-Use Sector
        • By Compliance/Standard
    • India
      • Pricing Analysis
      • Market Share Analysis, 2024
        • By Product Construction
        • By Capacity/Size Class
        • By End-Use Sector
        • By Compliance/Standard
    • ASEAN
      • Pricing Analysis
      • Market Share Analysis, 2024
        • By Product Construction
        • By Capacity/Size Class
        • By End-Use Sector
        • By Compliance/Standard
    • Australia & New Zealand
      • Pricing Analysis
      • Market Share Analysis, 2024
        • By Product Construction
        • By Capacity/Size Class
        • By End-Use Sector
        • By Compliance/Standard
    • China
      • Pricing Analysis
      • Market Share Analysis, 2024
        • By Product Construction
        • By Capacity/Size Class
        • By End-Use Sector
        • By Compliance/Standard
    • Japan
      • Pricing Analysis
      • Market Share Analysis, 2024
        • By Product Construction
        • By Capacity/Size Class
        • By End-Use Sector
        • By Compliance/Standard
    • South Korea
      • Pricing Analysis
      • Market Share Analysis, 2024
        • By Product Construction
        • By Capacity/Size Class
        • By End-Use Sector
        • By Compliance/Standard
    • Russia
      • Pricing Analysis
      • Market Share Analysis, 2024
        • By Product Construction
        • By Capacity/Size Class
        • By End-Use Sector
        • By Compliance/Standard
    • Poland
      • Pricing Analysis
      • Market Share Analysis, 2024
        • By Product Construction
        • By Capacity/Size Class
        • By End-Use Sector
        • By Compliance/Standard
    • Hungary
      • Pricing Analysis
      • Market Share Analysis, 2024
        • By Product Construction
        • By Capacity/Size Class
        • By End-Use Sector
        • By Compliance/Standard
    • Kingdom of Saudi Arabia
      • Pricing Analysis
      • Market Share Analysis, 2024
        • By Product Construction
        • By Capacity/Size Class
        • By End-Use Sector
        • By Compliance/Standard
    • Turkiye
      • Pricing Analysis
      • Market Share Analysis, 2024
        • By Product Construction
        • By Capacity/Size Class
        • By End-Use Sector
        • By Compliance/Standard
    • South Africa
      • Pricing Analysis
      • Market Share Analysis, 2024
        • By Product Construction
        • By Capacity/Size Class
        • By End-Use Sector
        • By Compliance/Standard
  19. Market Structure Analysis
    • Competition Dashboard
    • Competition Benchmarking
    • Market Share Analysis of Top Players
      • By Regional
      • By Product Construction
      • By Capacity/Size Class
      • By End-Use Sector
      • By Compliance/Standard
  20. Competition Analysis
    • Competition Deep Dive
      • Valmet
        • Overview
        • Product Portfolio
        • Profitability by Market Segments (Product/Age /Sales Channel/Region)
        • Sales Footprint
        • Strategy Overview
          • Marketing Strategy
          • Product Strategy
          • Channel Strategy
      • AFT (Aikawa Fiber Technologies)
      • ANDRITZ
      • Bellmer
      • GL&V (Valmet legacy)
      • Kadant Fiber Processing
      • Leizhan Machinery
      • PAPCEL
      • Parason Machinery
      • Voith
  21. Assumptions & Acronyms Used
  22. Research Methodology

List of Tables

  • Table 1: Global Market Value (USD Million) Forecast by Region, 2020-2035
  • Table 2: Global Market Value (USD Million) Forecast by Product Construction , 2020-2035
  • Table 3: Global Market Value (USD Million) Forecast by Capacity/Size Class, 2020-2035
  • Table 4: Global Market Value (USD Million) Forecast by End-Use Sector, 2020-2035
  • Table 5: Global Market Value (USD Million) Forecast by Compliance/Standard, 2020-2035
  • Table 6: North America Market Value (USD Million) Forecast by Country, 2020-2035
  • Table 7: North America Market Value (USD Million) Forecast by Product Construction , 2020-2035
  • Table 8: North America Market Value (USD Million) Forecast by Capacity/Size Class, 2020-2035
  • Table 9: North America Market Value (USD Million) Forecast by End-Use Sector, 2020-2035
  • Table 10: North America Market Value (USD Million) Forecast by Compliance/Standard, 2020-2035
  • Table 11: Latin America Market Value (USD Million) Forecast by Country, 2020-2035
  • Table 12: Latin America Market Value (USD Million) Forecast by Product Construction , 2020-2035
  • Table 13: Latin America Market Value (USD Million) Forecast by Capacity/Size Class, 2020-2035
  • Table 14: Latin America Market Value (USD Million) Forecast by End-Use Sector, 2020-2035
  • Table 15: Latin America Market Value (USD Million) Forecast by Compliance/Standard, 2020-2035
  • Table 16: Western Europe Market Value (USD Million) Forecast by Country, 2020-2035
  • Table 17: Western Europe Market Value (USD Million) Forecast by Product Construction , 2020-2035
  • Table 18: Western Europe Market Value (USD Million) Forecast by Capacity/Size Class, 2020-2035
  • Table 19: Western Europe Market Value (USD Million) Forecast by End-Use Sector, 2020-2035
  • Table 20: Western Europe Market Value (USD Million) Forecast by Compliance/Standard, 2020-2035
  • Table 21: Eastern Europe Market Value (USD Million) Forecast by Country, 2020-2035
  • Table 22: Eastern Europe Market Value (USD Million) Forecast by Product Construction , 2020-2035
  • Table 23: Eastern Europe Market Value (USD Million) Forecast by Capacity/Size Class, 2020-2035
  • Table 24: Eastern Europe Market Value (USD Million) Forecast by End-Use Sector, 2020-2035
  • Table 25: Eastern Europe Market Value (USD Million) Forecast by Compliance/Standard, 2020-2035
  • Table 26: East Asia Market Value (USD Million) Forecast by Country, 2020-2035
  • Table 27: East Asia Market Value (USD Million) Forecast by Product Construction , 2020-2035
  • Table 28: East Asia Market Value (USD Million) Forecast by Capacity/Size Class, 2020-2035
  • Table 29: East Asia Market Value (USD Million) Forecast by End-Use Sector, 2020-2035
  • Table 30: East Asia Market Value (USD Million) Forecast by Compliance/Standard, 2020-2035
  • Table 31: South Asia and Pacific Market Value (USD Million) Forecast by Country, 2020-2035
  • Table 32: South Asia and Pacific Market Value (USD Million) Forecast by Product Construction , 2020-2035
  • Table 33: South Asia and Pacific Market Value (USD Million) Forecast by Capacity/Size Class, 2020-2035
  • Table 34: South Asia and Pacific Market Value (USD Million) Forecast by End-Use Sector, 2020-2035
  • Table 35: South Asia and Pacific Market Value (USD Million) Forecast by Compliance/Standard, 2020-2035
  • Table 36: Middle East & Africa Market Value (USD Million) Forecast by Country, 2020-2035
  • Table 37: Middle East & Africa Market Value (USD Million) Forecast by Product Construction , 2020-2035
  • Table 38: Middle East & Africa Market Value (USD Million) Forecast by Capacity/Size Class, 2020-2035
  • Table 39: Middle East & Africa Market Value (USD Million) Forecast by End-Use Sector, 2020-2035
  • Table 40: Middle East & Africa Market Value (USD Million) Forecast by Compliance/Standard, 2020-2035

List of Figures

  • Figure 1: Global Market Pricing Analysis
  • Figure 2: Global Market Value (USD Million) Forecast 2020-2035
  • Figure 3: Global Market Value Share and BPS Analysis by Product Construction , 2025 and 2035
  • Figure 4: Global Market Y-o-Y Growth Comparison by Product Construction , 2025-2035
  • Figure 5: Global Market Attractiveness Analysis by Product Construction
  • Figure 6: Global Market Value Share and BPS Analysis by Capacity/Size Class, 2025 and 2035
  • Figure 7: Global Market Y-o-Y Growth Comparison by Capacity/Size Class, 2025-2035
  • Figure 8: Global Market Attractiveness Analysis by Capacity/Size Class
  • Figure 9: Global Market Value Share and BPS Analysis by End-Use Sector, 2025 and 2035
  • Figure 10: Global Market Y-o-Y Growth Comparison by End-Use Sector, 2025-2035
  • Figure 11: Global Market Attractiveness Analysis by End-Use Sector
  • Figure 12: Global Market Value Share and BPS Analysis by Compliance/Standard, 2025 and 2035
  • Figure 13: Global Market Y-o-Y Growth Comparison by Compliance/Standard, 2025-2035
  • Figure 14: Global Market Attractiveness Analysis by Compliance/Standard
  • Figure 15: Global Market Value (USD Million) Share and BPS Analysis by Region, 2025 and 2035
  • Figure 16: Global Market Y-o-Y Growth Comparison by Region, 2025-2035
  • Figure 17: Global Market Attractiveness Analysis by Region
  • Figure 18: North America Market Incremental Dollar Opportunity, 2025-2035
  • Figure 19: Latin America Market Incremental Dollar Opportunity, 2025-2035
  • Figure 20: Western Europe Market Incremental Dollar Opportunity, 2025-2035
  • Figure 21: Eastern Europe Market Incremental Dollar Opportunity, 2025-2035
  • Figure 22: East Asia Market Incremental Dollar Opportunity, 2025-2035
  • Figure 23: South Asia and Pacific Market Incremental Dollar Opportunity, 2025-2035
  • Figure 24: Middle East & Africa Market Incremental Dollar Opportunity, 2025-2035
  • Figure 25: North America Market Value Share and BPS Analysis by Country, 2025 and 2035
  • Figure 26: North America Market Value Share and BPS Analysis by Product Construction , 2025 and 2035
  • Figure 27: North America Market Y-o-Y Growth Comparison by Product Construction , 2025-2035
  • Figure 28: North America Market Attractiveness Analysis by Product Construction
  • Figure 29: North America Market Value Share and BPS Analysis by Capacity/Size Class, 2025 and 2035
  • Figure 30: North America Market Y-o-Y Growth Comparison by Capacity/Size Class, 2025-2035
  • Figure 31: North America Market Attractiveness Analysis by Capacity/Size Class
  • Figure 32: North America Market Value Share and BPS Analysis by End-Use Sector, 2025 and 2035
  • Figure 33: North America Market Y-o-Y Growth Comparison by End-Use Sector, 2025-2035
  • Figure 34: North America Market Attractiveness Analysis by End-Use Sector
  • Figure 35: North America Market Value Share and BPS Analysis by Compliance/Standard, 2025 and 2035
  • Figure 36: North America Market Y-o-Y Growth Comparison by Compliance/Standard, 2025-2035
  • Figure 37: North America Market Attractiveness Analysis by Compliance/Standard
  • Figure 38: Latin America Market Value Share and BPS Analysis by Country, 2025 and 2035
  • Figure 39: Latin America Market Value Share and BPS Analysis by Product Construction , 2025 and 2035
  • Figure 40: Latin America Market Y-o-Y Growth Comparison by Product Construction , 2025-2035
  • Figure 41: Latin America Market Attractiveness Analysis by Product Construction
  • Figure 42: Latin America Market Value Share and BPS Analysis by Capacity/Size Class, 2025 and 2035
  • Figure 43: Latin America Market Y-o-Y Growth Comparison by Capacity/Size Class, 2025-2035
  • Figure 44: Latin America Market Attractiveness Analysis by Capacity/Size Class
  • Figure 45: Latin America Market Value Share and BPS Analysis by End-Use Sector, 2025 and 2035
  • Figure 46: Latin America Market Y-o-Y Growth Comparison by End-Use Sector, 2025-2035
  • Figure 47: Latin America Market Attractiveness Analysis by End-Use Sector
  • Figure 48: Latin America Market Value Share and BPS Analysis by Compliance/Standard, 2025 and 2035
  • Figure 49: Latin America Market Y-o-Y Growth Comparison by Compliance/Standard, 2025-2035
  • Figure 50: Latin America Market Attractiveness Analysis by Compliance/Standard
  • Figure 51: Western Europe Market Value Share and BPS Analysis by Country, 2025 and 2035
  • Figure 52: Western Europe Market Value Share and BPS Analysis by Product Construction , 2025 and 2035
  • Figure 53: Western Europe Market Y-o-Y Growth Comparison by Product Construction , 2025-2035
  • Figure 54: Western Europe Market Attractiveness Analysis by Product Construction
  • Figure 55: Western Europe Market Value Share and BPS Analysis by Capacity/Size Class, 2025 and 2035
  • Figure 56: Western Europe Market Y-o-Y Growth Comparison by Capacity/Size Class, 2025-2035
  • Figure 57: Western Europe Market Attractiveness Analysis by Capacity/Size Class
  • Figure 58: Western Europe Market Value Share and BPS Analysis by End-Use Sector, 2025 and 2035
  • Figure 59: Western Europe Market Y-o-Y Growth Comparison by End-Use Sector, 2025-2035
  • Figure 60: Western Europe Market Attractiveness Analysis by End-Use Sector
  • Figure 61: Western Europe Market Value Share and BPS Analysis by Compliance/Standard, 2025 and 2035
  • Figure 62: Western Europe Market Y-o-Y Growth Comparison by Compliance/Standard, 2025-2035
  • Figure 63: Western Europe Market Attractiveness Analysis by Compliance/Standard
  • Figure 64: Eastern Europe Market Value Share and BPS Analysis by Country, 2025 and 2035
  • Figure 65: Eastern Europe Market Value Share and BPS Analysis by Product Construction , 2025 and 2035
  • Figure 66: Eastern Europe Market Y-o-Y Growth Comparison by Product Construction , 2025-2035
  • Figure 67: Eastern Europe Market Attractiveness Analysis by Product Construction
  • Figure 68: Eastern Europe Market Value Share and BPS Analysis by Capacity/Size Class, 2025 and 2035
  • Figure 69: Eastern Europe Market Y-o-Y Growth Comparison by Capacity/Size Class, 2025-2035
  • Figure 70: Eastern Europe Market Attractiveness Analysis by Capacity/Size Class
  • Figure 71: Eastern Europe Market Value Share and BPS Analysis by End-Use Sector, 2025 and 2035
  • Figure 72: Eastern Europe Market Y-o-Y Growth Comparison by End-Use Sector, 2025-2035
  • Figure 73: Eastern Europe Market Attractiveness Analysis by End-Use Sector
  • Figure 74: Eastern Europe Market Value Share and BPS Analysis by Compliance/Standard, 2025 and 2035
  • Figure 75: Eastern Europe Market Y-o-Y Growth Comparison by Compliance/Standard, 2025-2035
  • Figure 76: Eastern Europe Market Attractiveness Analysis by Compliance/Standard
  • Figure 77: East Asia Market Value Share and BPS Analysis by Country, 2025 and 2035
  • Figure 78: East Asia Market Value Share and BPS Analysis by Product Construction , 2025 and 2035
  • Figure 79: East Asia Market Y-o-Y Growth Comparison by Product Construction , 2025-2035
  • Figure 80: East Asia Market Attractiveness Analysis by Product Construction
  • Figure 81: East Asia Market Value Share and BPS Analysis by Capacity/Size Class, 2025 and 2035
  • Figure 82: East Asia Market Y-o-Y Growth Comparison by Capacity/Size Class, 2025-2035
  • Figure 83: East Asia Market Attractiveness Analysis by Capacity/Size Class
  • Figure 84: East Asia Market Value Share and BPS Analysis by End-Use Sector, 2025 and 2035
  • Figure 85: East Asia Market Y-o-Y Growth Comparison by End-Use Sector, 2025-2035
  • Figure 86: East Asia Market Attractiveness Analysis by End-Use Sector
  • Figure 87: East Asia Market Value Share and BPS Analysis by Compliance/Standard, 2025 and 2035
  • Figure 88: East Asia Market Y-o-Y Growth Comparison by Compliance/Standard, 2025-2035
  • Figure 89: East Asia Market Attractiveness Analysis by Compliance/Standard
  • Figure 90: South Asia and Pacific Market Value Share and BPS Analysis by Country, 2025 and 2035
  • Figure 91: South Asia and Pacific Market Value Share and BPS Analysis by Product Construction , 2025 and 2035
  • Figure 92: South Asia and Pacific Market Y-o-Y Growth Comparison by Product Construction , 2025-2035
  • Figure 93: South Asia and Pacific Market Attractiveness Analysis by Product Construction
  • Figure 94: South Asia and Pacific Market Value Share and BPS Analysis by Capacity/Size Class, 2025 and 2035
  • Figure 95: South Asia and Pacific Market Y-o-Y Growth Comparison by Capacity/Size Class, 2025-2035
  • Figure 96: South Asia and Pacific Market Attractiveness Analysis by Capacity/Size Class
  • Figure 97: South Asia and Pacific Market Value Share and BPS Analysis by End-Use Sector, 2025 and 2035
  • Figure 98: South Asia and Pacific Market Y-o-Y Growth Comparison by End-Use Sector, 2025-2035
  • Figure 99: South Asia and Pacific Market Attractiveness Analysis by End-Use Sector
  • Figure 100: South Asia and Pacific Market Value Share and BPS Analysis by Compliance/Standard, 2025 and 2035
  • Figure 101: South Asia and Pacific Market Y-o-Y Growth Comparison by Compliance/Standard, 2025-2035
  • Figure 102: South Asia and Pacific Market Attractiveness Analysis by Compliance/Standard
  • Figure 103: Middle East & Africa Market Value Share and BPS Analysis by Country, 2025 and 2035
  • Figure 104: Middle East & Africa Market Value Share and BPS Analysis by Product Construction , 2025 and 2035
  • Figure 105: Middle East & Africa Market Y-o-Y Growth Comparison by Product Construction , 2025-2035
  • Figure 106: Middle East & Africa Market Attractiveness Analysis by Product Construction
  • Figure 107: Middle East & Africa Market Value Share and BPS Analysis by Capacity/Size Class, 2025 and 2035
  • Figure 108: Middle East & Africa Market Y-o-Y Growth Comparison by Capacity/Size Class, 2025-2035
  • Figure 109: Middle East & Africa Market Attractiveness Analysis by Capacity/Size Class
  • Figure 110: Middle East & Africa Market Value Share and BPS Analysis by End-Use Sector, 2025 and 2035
  • Figure 111: Middle East & Africa Market Y-o-Y Growth Comparison by End-Use Sector, 2025-2035
  • Figure 112: Middle East & Africa Market Attractiveness Analysis by End-Use Sector
  • Figure 113: Middle East & Africa Market Value Share and BPS Analysis by Compliance/Standard, 2025 and 2035
  • Figure 114: Middle East & Africa Market Y-o-Y Growth Comparison by Compliance/Standard, 2025-2035
  • Figure 115: Middle East & Africa Market Attractiveness Analysis by Compliance/Standard
  • Figure 116: Global Market - Tier Structure Analysis
  • Figure 117: Global Market - Company Share Analysis

Frequently Asked Questions

How big is the inflow pressure screen market in 2025?

The global inflow pressure screen market is estimated to be valued at USD 911.1 million in 2025.

What will be the size of inflow pressure screen market in 2035?

The market size for the inflow pressure screen market is projected to reach USD 1,310.2 million by 2035.

How much will be the inflow pressure screen market growth between 2025 and 2035?

The inflow pressure screen market is expected to grow at a 3.7% CAGR between 2025 and 2035.

What are the key product types in the inflow pressure screen market?

The key product types in inflow pressure screen market are standard-duty, heavy-duty/corrosion-resistant and hygienic/cleanroom.

Which capacity/size class segment to contribute significant share in the inflow pressure screen market in 2025?

In terms of capacity/size class, medium segment to command 45.0% share in the inflow pressure screen market in 2025.

Explore Similar Insights

Future Market Insights

Inflow Pressure Screen Market

Chat With

MaRIA

Hi There, I am MaRIA, Your Market Research Intelligence Assistant. How may I help you?