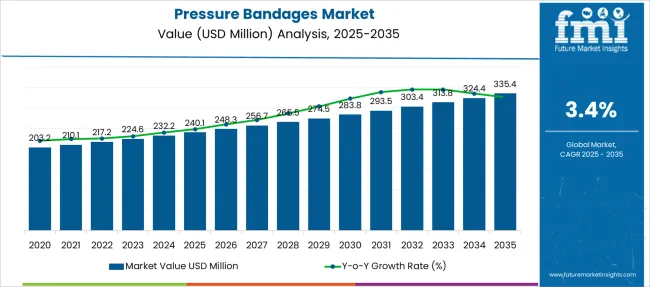
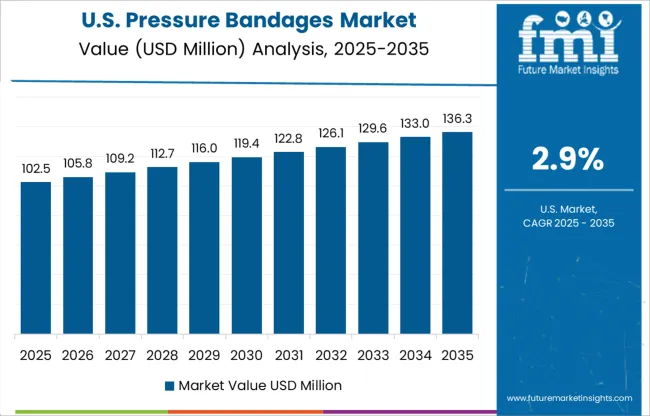
The global Pressure Bandages Market size is slated to top USD 217.2 Million in 2022. Increasing incidence of diabetic foot ulcers and lymphedema is spurring demand for pressure bandages, which is expected to boost sales at a 3.4% CAGR, pushing the market valuation to USD 274.5 Million in 2029.
Attribute | Details |
---|---|
Pressure bandages Estimated Market Size 2022 | USD 217.2 Million |
Pressure bandages Market Value-based CAGR (2022 to 2029) | 3.4% |
Pressure bandages Market Projected Size in 2029 | USD 274.5 Million |
Pressure bandages are the first line of care when it comes to minor injuries such as sprains and cuts. They are used to control the bleeding and to protect the injured area without affecting the blood circulation.
Product innovations in the advanced wound management market are expected to bolster sales of pressure bandages in the forthcoming years. As per Future Market Insights (FMI), sales of pressure bandages represent 2.8% of the overall advanced wound management market.
Particulars | Details |
---|---|
H1, 2021 | 3.27% |
H1, 2022 Projected | 3.40% |
H1, 2022 Outlook | 3.00% |
BPS Change - H1, 2022 (O) - H1, 2022 (P) | (-) 40 ↓ |
BPS Change - H1, 2022 (O) - H1, 2021 | (-) 27 ↓ |
The comparative and review analysis of market dynamics within pressure bandages market revealed that H1-2022 outlook period in comparison to H1-2022 projected period will show a negative growth in terms of Basis Point Share by 40 BPS. In H1-2022, the market growth rate of pressure bandages is expected to fall by 27 basis point share (BPS) when compared to H1-2021, as per FMI analysis.
The market for pressure bandages is subject to changes as per disease epidemiology, product adoption rate, and product patents, as a part of the macro and industry dynamics. The observed decline in the BPS values is associated with poor patient compliance on the product, as well as the drawbacks associated with inelastic pressure bandages.
Key developments in the market include the design and development of patient specific compression bandages for instances associated with diabetic foot ulcer management, and wound management. The introduction of gradient pressure systems within newly introduced compression socks products will further promote the growth of the overall pressure bandages market during the forecast period.
The utilization of pressure bandages promotes a reduced length of hospital stay along with cost savings on regular bulk inventory of conventional bandages. Thus, adding to the factors for market growth in future.
Demand in the market is forecast to grow at a 3.4% CAGR, in comparison with the 2.7% CAGR registered between 2014 to 2021, finds FMI.
These medical devices are primarily used to compress the dead space at the site of cut, injury, or incision and to prevent the formation of hematoma or seroma. They have a wide range of applications in different cases such as leg ulcers, the management of chronic and acute wounds, orthopedic surgeries, and musculoskeletal injuries.
There are different types of pressure bandages available in the market such as elastic bandages, low elastic bandages, multi-layer bandages to suit applications in different medical indications. To improve the convenience and effectiveness of these bandages, manufacturers are investing in research and development to enhance the quality of raw materials used.
As per FMI, surging incidence of lymphedema, deep vein thrombosis, and diabetic foot ulcers across the globe will drive sales in the market. According to a study published in the National Center for Biotechnology Information, the USA National Library of Medicine, the annual incidence of diabetic foot ulcers worldwide is between 9.1 million to 26.1 million.
As the prevalence continues to rise, demand for pressure bandages will increase in tandem, which is expected to fuel sales in the market over the assessment period.
Since pressure bandages are used as the first line of care in minor injuries, they are widely available in pharmacies, supermarkets, and online retail channels. These bandages are easy to access and are effective for treating minor wounds and injuries at home, which in turn is propelling sales in the market.
These bandages are an important first-aid technique used in medical settings for serious injuries as well. They provide compression to the injured blood vessels by stimulating blood clot formation, thereby preventing rapid blood loss and hemorrhage.
They are also effective in stabilizing wounds such as venomous snake bites as they prevent venom progression into the bloodstream. Owing to the convenience and accessibility at any point of care, they are also being adopted for sports injuries and other severe accidents.
Growing incidence of diabetic foot ulcers and venous leg ulcers is presenting a posing as a burden on the healthcare system. However, these ulcers can be treated by using compression bandages. These bandages are recommended for 2-3 days by physiotherapists for acute injuries to reduce pain and swelling.
In addition to this, growing investments in the healthcare sector to improve the quality of these bandages and to promote their usage will boost the market in the forthcoming years. Growing applications of pressure bandages for foot ulcers in emerging economies will continue fueling sales in the market over the forecast period.
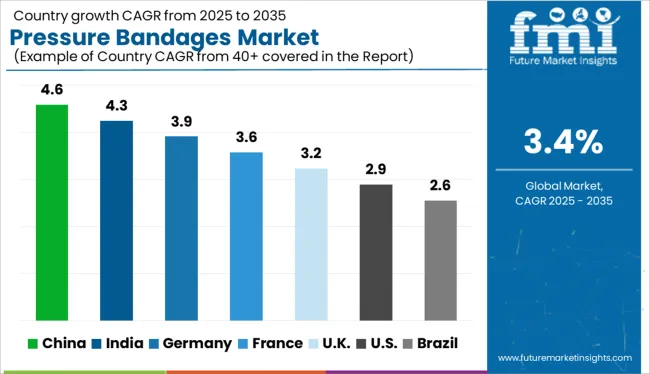
Healthcare Providers in the USA are Prescribing Pressure Immobilisation Bandages for Trauma Injuries
As per the report, the USA is expected to dominate the North America pressure bandages market over the assessment period owing to the presence of a robust healthcare sector and patient healthcare reimbursement plans. Sales in the North America market are slated to account for 40.6% of the total market share in 2022.
According to the Centers for Disease Control and Prevention (CDC), approximately 37.3 million people in the USA currently have diabetes, which is equal to 11.3% of the USA population.
High prevalence of diabetic foot ulcers in the country is spurring demand for effective wound management solutions. Pressure bandages act as a temporary solution to curb excessive blood loss in diabetic foot ulcers till the time of treatment, surgery, or amputation, which, in turn, is driving sales in the USA market.
High Incidence of Leg Ulcers to Fuel Sales of Pressure Bandages for Foot
China is expected to account for a lion’s share of the East Asia pressure bandages market over the forecast period. As per FMI, demand in Asia Pacific Excluding Japan is projected to account for 11% of the total market share in 2022.
Increasing prevalence of leg ulcers due to diabetes and other chronic illnesses such as arthritis is spurring demand for advanced wound management products, which, in turn, is boosting sales of pressure bandages.
In addition to this, increasing investments by the government for availing patient healthcare reimbursement plans in China will continue augmenting the growth of the market in the forthcoming years.
Increasing Applications of Pressure Wound Bandages to Fuel Growth in the UK
Sales in the UK are projected to increase at a considerable pace amid surging demand for effective and easily accessible wound management devices for home and medical settings. As per the report, the Europe pressure bandages market is projected to account for 31.8% of the total market share in 2022.
The presence of leading market players in the UK is also expected to bode well for the market. Players are investing in research and development to improve the quality of raw materials used for making these bandages, including latex and polyester.
Furthermore, growing trend of medical tourism in the country for the treatment of deep vein thrombosis and lymphedema is expected to bolster sales in the market over the assessment period.
Athletes and Sports Professionals Prefer Long Stretch Bandages for Trauma Relief
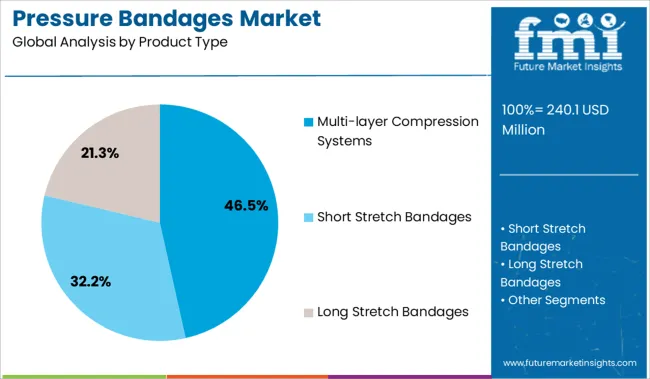
Based on the product type, demand for long stretch bandages is expected to remain high over the assessment period. Growth can be attributed to the easy availability and accessibility of these bandages in home care and medical settings.
These bandages are being adopted by athletes and sports professionals for quick pain relief from traumatic injuries such as sprains and ligament tears. Further, increasing product developments with enhanced quality of the material will continue fueling sales in this segment over the forecast period.
High Demand for Cotton Pressure Relief Bandages will Bolster Sales
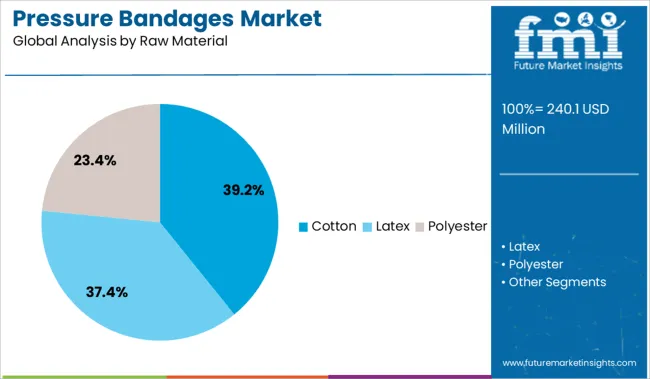
In terms of raw material, demand in the cotton segment is slated to account for a dominant share in the global pressure bandages market. These bandages are soft on the skin and provide adequate pressure to control excessive bleeding and pain.
Besides this, increasing availability and sales of these bandages in supermarkets, hypermarkets, online channels, and pharmacies will bolster growth in this segment over the forecast period.
Demand for Pressure Wound Bandages for Leg Ulcers will Remain High
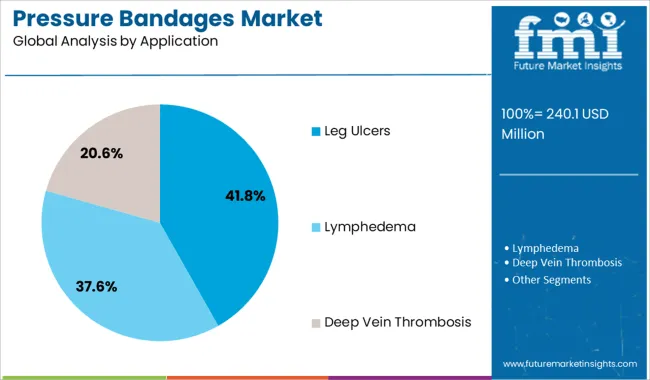
Sales in the leg ulcers segment are expected to gain traction over the forecast period. Increasing incidence of chronic ulcers, along with the high prevalence of diabetic foot ulcers across the globe is spurring demand for high-pressure wound bandages, thereby pushing sales in this segment.
In addition to this, increasing government-led investments in diabetes awareness programs, along with patient reimbursement plans for ulcer treatment will continue boosting growth in this segment in the forthcoming years.
Sales of Pressure Bandages for Legs Will Increase in Pharmacies
Based on the sales channel, sales in the pharmacies segment are slated to gain momentum through 2029. Easy availability of a wide range of bandage types in pharmacies is a chief factor driving sales in this segment.
Further, hospital pharmacies and general pharmacies retail high-quality bandages suited for various applications, from minor trauma injuries to major burns, cuts, and ulcers, which enables consumers to buy the bandages and use them in homecare settings. This is expected to continue fueling sales over the assessment period.
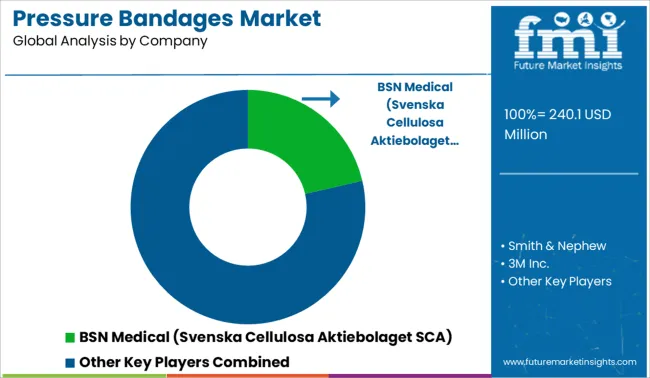
Leading players operating in the global pressure bandages market are investing in research and development to improve the quality of these bandages. Through this, players are also expecting to expand their product portfolios. Further, players are investing in mergers, acquisitions, and collaborations to expand their distribution networks across various countries and regions.
Attribute | Details |
---|---|
Forecast Period | 2022 to 2029 |
Historical Data Available for | 2014 to 2021 |
Market Analysis | Units for Volume and USD Million for Value |
Key Regions Covered | North America; Latin America; Europe; East Asia; South Asia; Oceania, and MEA |
Key Countries Covered | United States, Canada, Brazil, Mexico, Germany, UK, France, Italy, Spain, Nordic, Russia, Poland, China, India, Thailand, Indonesia, Australia and New Zealand, Japan, GCC countries, North Africa, South Africa, others. |
Key Market Segments Covered | Product Type, Raw Material, Application, Distribution Channel, and Region |
Key Companies Profiled | BSN Medical (Svenska Cellulosa Aktiebolaget SCA); Smith & Nephew; 3M Inc.; Medtronic, Plc; Cardinal Health; ConvaTec Inc. |
Pricing | Available upon Request |
Table 01: North America Pressure Bandages Market size (US$ Mn) Analysis, and Forecast, By Country, 2014-2029
Table 02: North America Pressure Bandages Market size (US$ Mn) Analysis, and Forecast, By Product type, 2014-2029
Table 03: North America Pressure Bandages Market size (US$ Mn) Analysis, and Forecast, By Application, 2014-2029
Table 04: North America Pressure Bandages Market size (US$ Mn) Analysis, and Forecast, By Raw Material, 2014-2029
Table 05: North America Pressure Bandages Market size (US$ Mn) Analysis, and Forecast, By Distribution Channel, 2014-2029
Table 06: Latin America Pressure Bandages Market size (US$ Mn) Analysis, and Forecast, By Country, 2014-2029
Table 07: Latin America Pressure Bandages Market size (US$ Mn) Analysis, and Forecast, By Product type, 2014-2029
Table 08: Latin America Pressure Bandages Market size (US$ Mn) Analysis, and Forecast, By Application, 2014-2029
Table 09: Latin America Pressure Bandages Market size (US$ Mn) Analysis, and Forecast, By Raw Material, 2014-2029
Table 10: Latin America Pressure Bandages Market size (US$ Mn) Analysis, and Forecast, By Distribution Channel, 2014-2029
Table 11: Western Europe Pressure Bandages Market size (US$ Mn) Analysis, and Forecast, By Country, 2014-2029
Table 12: Western Europe Pressure Bandages Market size (US$ Mn) Analysis, and Forecast, By Product type, 2014-2029
Table 13: Western Europe Pressure Bandages Market size (US$ Mn) Analysis, and Forecast, By Application, 2014-2029
Table 14: Western Europe Pressure Bandages Market size (US$ Mn) Analysis, and Forecast, By Raw Material, 2014-2029
Table 15: Western Europe Pressure Bandages Market size (US$ Mn) Analysis, and Forecast, By Distribution Channel, 2014-2029
Table 16: Eastern Europe Pressure Bandages Market size (US$ Mn) Analysis, and Forecast, By Country, 2014-2029
Table 17: Eastern Europe Pressure Bandages Market size (US$ Mn) Analysis, and Forecast, By Product type, 2014-2029
Table 18: Eastern Europe Pressure Bandages Market size (US$ Mn) Analysis, and Forecast, By Application, 2014-2029
Table 19: Eastern Europe Pressure Bandages Market size (US$ Mn) Analysis, and Forecast, By Raw Material, 2014-2029
Table 20: Eastern Europe Pressure Bandages Market size (US$ Mn) Analysis, and Forecast, By Distribution Channel, 2014-2029
Table 21: APEJ Pressure Bandages Market size (US$ Mn) Analysis, and Forecast, By Country, 2014-2029
Table 22: APEJ Pressure Bandages Market size (US$ Mn) Analysis, and Forecast, By Product type, 2014-2029
Table 23: APEJ Pressure Bandages Market size (US$ Mn) Analysis, and Forecast, By Application, 2014-2029
Table 24: APEJ Pressure Bandages Market size (US$ Mn) Analysis, and Forecast, By Raw Material, 2014-2029
Table 25: APEJ Pressure Bandages Market size (US$ Mn) Analysis, and Forecast, By Distribution Channel, 2014-2029
Table 26: Japan Pressure Bandages Market size (US$ Mn) Analysis, and Forecast, By Product type, 2014-2029
Table 27: Japan Pressure Bandages Market size (US$ Mn) Analysis, and Forecast, By Application, 2014-2029
Table 28: Japan Pressure Bandages Market size (US$ Mn) Analysis, and Forecast, By Raw Material, 2014-2029
Table 29: Japan Pressure Bandages Market size (US$ Mn) Analysis, and Forecast, By Distribution Channel, 2014-2029
Table 30: APEJ Pressure Bandages Market size (US$ Mn) Analysis, and Forecast, By Country, 2014-2029
Table 31: APEJ Pressure Bandages Market size (US$ Mn) Analysis, and Forecast, By Product type, 2014-2029
Table 32: APEJ Pressure Bandages Market size (US$ Mn) Analysis, and Forecast, By Application, 2014-2029
Table 33: APEJ Pressure Bandages Market size (US$ Mn) Analysis, and Forecast, By Raw Material, 2014-2029
Table 34: MEA Pressure Bandages Market size (US$ Mn) Analysis, and Forecast, By Distribution Channel, 2014-2029
Table 35: Global Pressure Bandages Volume (Units) Analysis and Forecast, By Region, 2014-2017
Table 36: Global Pressure Bandages Market size (US$ Mn) Analysis, and Forecast, By Product type, 2014-2029
Table 37: Global Pressure Bandages Market size (US$ Mn) Analysis, and Forecast, By Application, 2014-2029
Table 38: Global Pressure Bandages Market size (US$ Mn) Analysis, and Forecast, By Raw Material, 2014-2029
Table 39: Global Pressure Bandages Market size (US$ Mn) Analysis, and Forecast, By Distribution Channel, 2014-2029
Figure 01: North America Pressure Bandages Market Value Share By Product Type (2022 E)
Figure 02: North America Pressure Bandages Market Value Share By Raw Material (2022 E)
Figure 03: North America Pressure Bandages Market Value Share By Application (2022 E)
Figure 04: North America Pressure Bandages Market Value Share By Distribution Channel (2022 E)
Figure 05: North America Pressure Bandages Market Forecast 2022 E and 2029 F
Figure 06: North America Pressure Bandages Market Size Analysis, 2014–2021
Figure 07: North America Pressure Bandages Market Forecast, 2022–2029
Figure 08: U.S. Pressure Bandages Market Size (US$ Mn) 2014–2029 & Y-o-Y analysis, 2022 - 2029
Figure 09: Canada Pressure Bandages Market Size (US$ Mn) 2014–2029 & Y-o-Y analysis, 2022 - 2029
Figure 10: North America Pressure Bandages Market Size (US$ Mn) Analysis, By Short Stretch Bandages Pressure Bandages, 2014–2021 &
Figure 11: North America Pressure Bandages Market Size (US$ Mn) Analysis, By Long Stretch Bandages Pressure Bandages, 2014–2021 &
Figure 12: North America Pressure Bandages Market Size (US$ Mn) Analysis, By Multi Layer Compression System Bandages Pressure Bandages, 2014–2021 & Y-o-Y analysis, 2022 - 2029
Figure 13: North America Pressure Bandages Market Attractiveness Analysis By Country, 2022–2029
Figure 14: North America Pressure Bandages Market Attractiveness Analysis By Product Type, 2022–2029
Figure 15: North America Pressure Bandages Market Attractiveness Analysis By Application, 2022–2029
Figure 16: North America Pressure Bandages Market Attractiveness Analysis By Raw Material, 2022–2029
Figure 17: North America Pressure Bandages Market Attractiveness Analysis By Distribution Channel, 2022–2029
Figure 18: Latin America Pressure Bandages Market Value Share By Product Type (2022 E)
Figure 19: Latin America Pressure Bandages Market Value Share By Raw Material (2022 E)
Figure 20: Latin America Pressure Bandages Market Value Share By Application (2022 E)
Figure 21: Latin America Pressure Bandages Market Value Share By Distribution Channel (2022 E)
Figure 22: Latin America Pressure Bandages Market Forecast 2022 E and 2029 F
Figure 23: Latin America Pressure Bandages Market Size Analysis, 2014–2021
Figure 24: Latin America Pressure Bandages Market Forecast, 2022–2029
Figure 25: Brazil Pressure Bandages Market Size (US$ Mn) 2014–2029 & Y-o-Y analysis, 2022 - 2029
Figure 26: Mexico Pressure Bandages Market Size (US$ Mn) 2014–2029 & Y-o-Y analysis, 2022 - 2029
Figure 27: Rest od Latin America Pressure Bandages Market Size (US$ Mn) 2014–2029 & Y-o-Y analysis, 2022 - 2029
Figure 28: Latin America Pressure Bandages Market Size (US$ Mn) Analysis, By Short Stretch Bandages Pressure Bandages, 2014–2021 &
Figure 29: Latin America Pressure Bandages Market Size (US$ Mn) Analysis, By Long Stretch Bandages Pressure Bandages, 2014–2021 &
Figure 30: Latin America Pressure Bandages Market Size (US$ Mn) Analysis, By Multi Layer Compression System Bandages Pressure Bandages, 2014–2021 & Y-o-Y analysis, 2022 - 2029
Figure 31: Latin America Pressure Bandages Market Attractiveness Analysis By Country, 2022–2029
Figure 32: Latin America Pressure Bandages Market Attractiveness Analysis By Product Type, 2022–2029
Figure 33: Latin America Pressure Bandages Market Attractiveness Analysis By Application, 2022–2029
Figure 34: Latin America Pressure Bandages Market Attractiveness Analysis By Raw Material, 2022–2029
Figure 35: Latin America Pressure Bandages Market Attractiveness Analysis By Distribution Channel, 2022–2029
Figure 36: Western Europe Pressure Bandages Market Value Share By Product Type (2022 E)
Figure 37: Western Europe Pressure Bandages Market Value Share By Raw Material (2022 E)
Figure 38: Western Europe Pressure Bandages Market Value Share By Application (2022 E)
Figure 39: Western Europe Pressure Bandages Market Value Share By Distribution Channel (2022 E)
Figure 40: Western Europe Pressure Bandages Market Forecast 2022 E and 2029 F
Figure 41: Western Europe Pressure Bandages Market Size Analysis, 2014–2021
Figure 42: Western Europe Pressure Bandages Market Forecast, 2022–2029
Figure 43: Germany Pressure Bandages Market Size (US$ Mn) 2014–2029 & Y-o-Y analysis, 2022 - 2029
Figure 44: France Pressure Bandages Market Size (US$ Mn) 2014–2029 & Y-o-Y analysis, 2022 - 2029
Figure 45: U.K. Pressure Bandages Market Size (US$ Mn) 2014–2029 & Y-o-Y analysis, 2022 - 2029
Figure 46: Italy Pressure Bandages Market Size (US$ Mn) 2014–2029 & Y-o-Y analysis, 2022 - 2029
Figure 47: Spain Pressure Bandages Market Size (US$ Mn) 2014–2029 & Y-o-Y analysis, 2022 - 2029
Figure 48: Nordic Pressure Bandages Market Size (US$ Mn) 2014–2029 & Y-o-Y analysis, 2022 - 2029
Figure 49: BENELUX Pressure Bandages Market Size (US$ Mn) 2014–2029 & Y-o-Y analysis, 2022 - 2029
Figure 50: Rest of Western Europe Pressure Bandages Market Size (US$ Mn) 2014–2029 & Y-o-Y analysis, 2022 - 2029
Figure 51: Western Europe Pressure Bandages Market Size (US$ Mn) Analysis, By Short Stretch Bandages Pressure Bandages, 2014–2021 &
Figure 52: Western Europe Pressure Bandages Market Size (US$ Mn) Analysis, By Long Stretch Bandages Pressure Bandages, 2014–2021 &
Figure 53: Western Europe Pressure Bandages Market Size (US$ Mn) Analysis, By Multi Layer Compression System Bandages Pressure Bandages, 2014–2021 & Y-o-Y analysis, 2022 - 2029
Figure 54: Western Europe Pressure Bandages Market Attractiveness Analysis By Country, 2022–2029
Figure 55: Western Europe Pressure Bandages Market Attractiveness Analysis By Product Type, 2022–2029
Figure 56: Western Europe Pressure Bandages Market Attractiveness Analysis By Application, 2022–2029
Figure 57: Western Europe Pressure Bandages Market Attractiveness Analysis By Raw Material, 2022–2029
Figure 58: Western Europe Pressure Bandages Market Attractiveness Analysis By Distribution Channel, 2022–2029
Figure 59: Eastern Europe Pressure Bandages Market Value Share By Product Type (2022 E)
Figure 60: Eastern Europe Pressure Bandages Market Value Share By Raw Material (2022 E)
Figure 61: Eastern Europe Pressure Bandages Market Value Share By Application (2022 E)
Figure 62: Eastern Europe Pressure Bandages Market Value Share By Distribution Channel (2022 E)
Figure 63: Eastern Europe Pressure Bandages Market Forecast 2022 E and 2029 F
Figure 64: Eastern Europe Pressure Bandages Market Size Analysis, 2014–2021
Figure 65: Eastern Europe Pressure Bandages Market Forecast, 2022–2029
Figure 66: Russia Pressure Bandages Market Size (US$ Mn) 2014–2029 & Y-o-Y analysis, 2022 - 2029
Figure 67: Poland Pressure Bandages Market Size (US$ Mn) 2014–2029 & Y-o-Y analysis, 2022 - 2029
Figure 68: Rest of Eastern Europe Pressure Bandages Market Size (US$ Mn) 2014–2029 & Y-o-Y analysis, 2022 - 2029
Figure 69: Eastern Europe Pressure Bandages Market Size (US$ Mn) Analysis, By Short Stretch Bandages Pressure Bandages, 2014–2021 &
Figure 70: Eastern Europe Pressure Bandages Market Size (US$ Mn) Analysis, By Long Stretch Bandages Pressure Bandages, 2014–2021 &
Figure 71: Eastern Europe Pressure Bandages Market Size (US$ Mn) Analysis, By Multi Layer Compression System Bandages Pressure Bandages, 2014–2021 & Y-o-Y analysis, 2022 - 2029
Figure 72: Eastern Europe Pressure Bandages Market Attractiveness Analysis By Country, 2022–2029
Figure 73: Eastern Europe Pressure Bandages Market Attractiveness Analysis By Product Type, 2022–2029
Figure 74: Eastern Europe Pressure Bandages Market Attractiveness Analysis By Application, 2022–2029
Figure 75: Eastern Europe Pressure Bandages Market Attractiveness Analysis By Raw Material, 2022–2029
Figure 76: Eastern Europe Pressure Bandages Market Attractiveness Analysis By Distribution Channel, 2022–2029
Figure 77: APEJ Pressure Bandages Market Value Share By Product Type (2022 E)
Figure 78: APEJ Pressure Bandages Market Value Share By Raw Material (2022 E)
Figure 79: APEJ Pressure Bandages Market Value Share By Application (2022 E)
Figure 80: APEJ Pressure Bandages Market Value Share By Distribution Channel (2022 E)
Figure 81: APEJ Pressure Bandages Market Forecast 2022 E and 2029 F
Figure 82: APEJ Pressure Bandages Market Size Analysis, 2014–2021
Figure 83: APEJ Pressure Bandages Market Forecast, 2022–2029
Figure 84: China Pressure Bandages Market Size (US$ Mn) 2014–2029 & Y-o-Y analysis, 2022 - 2029
Figure 85: India Pressure Bandages Market Size (US$ Mn) 2014–2029 & Y-o-Y analysis, 2022 - 2029
Figure 86: ASEAN Pressure Bandages Market Size (US$ Mn) 2014–2029 & Y-o-Y analysis, 2022 - 2029
Figure 87: ANZ Pressure Bandages Market Size (US$ Mn) 2014–2029 & Y-o-Y analysis, 2022 - 2029
Figure 88: Rest of APEJ Pressure Bandages Market Size (US$ Mn) 2014–2029 & Y-o-Y analysis, 2022 - 2029
Figure 89: APEJ Pressure Bandages Market Size (US$ Mn) Analysis, By Short Stretch Bandages Pressure Bandages, 2014–2021 &
Figure 90: APEJ Pressure Bandages Market Size (US$ Mn) Analysis, By Long Stretch Bandages Pressure Bandages, 2014–2021 &
Figure 91: APEJ Pressure Bandages Market Size (US$ Mn) Analysis, By Multi Layer Compression System Bandages Pressure Bandages, 2014–2021 & Y-o-Y analysis, 2022 - 2029
Figure 92: APEJ Pressure Bandages Market Attractiveness Analysis By Country, 2022–2029
Figure 93: APEJ Pressure Bandages Market Attractiveness Analysis By Product Type, 2022–2029
Figure 94: APEJ Pressure Bandages Market Attractiveness Analysis By Application, 2022–2029
Figure 95: APEJ Pressure Bandages Market Attractiveness Analysis By Raw Material, 2022–2029
Figure 96: APEJ Pressure Bandages Market Attractiveness Analysis By Distribution Channel, 2022–2029
Figure 97: Japan Pressure Bandages Market Value Share By Product Type (2022 E)
Figure 98: Japan Pressure Bandages Market Value Share By Raw Material (2022 E)
Figure 99: Japan Pressure Bandages Market Value Share By Application (2022 E)
Figure 100: Japan Pressure Bandages Market Value Share By Distribution Channel (2022 E)
Figure 101: Japan Pressure Bandages Market Forecast 2022 E and 2029 F
Figure 102: Japan Pressure Bandages Market Size Analysis, 2014–2021
Figure 103: Japan Pressure Bandages Market Forecast, 2022–2029
Figure 104: Japan Pressure Bandages Market Size (US$ Mn) Analysis, By Short Stretch Bandages Pressure Bandages, 2014–2021 &
Figure 105: Japan Pressure Bandages Market Size (US$ Mn) Analysis, By Long Stretch Bandages Pressure Bandages, 2014–2021 &
Figure 106: Japan Pressure Bandages Market Size (US$ Mn) Analysis, By Multi Layer Compression System Bandages Pressure Bandages, 2014–2021 & Y-o-Y analysis, 2022 - 2029
Figure 107: Japan Pressure Bandages Market Attractiveness Analysis By Product Type, 2022–2029
Figure 108: Japan Pressure Bandages Market Attractiveness Analysis By Application, 2022–2029
Figure 109: Japan Pressure Bandages Market Attractiveness Analysis By Raw Material, 2022–2029
Figure 110: Japan Pressure Bandages Market Attractiveness Analysis By Distribution Channel, 2022–2029
Figure 111: MEA Pressure Bandages Market Value Share By Product Type (2022 E)
Figure 112: MEA Pressure Bandages Market Value Share By Raw Material (2022 E)
Figure 113: MEA Pressure Bandages Market Value Share By Application (2022 E)
Figure 114: MEA Pressure Bandages Market Value Share By Distribution Channel (2022 E)
Figure 115: MEA Pressure Bandages Market Forecast 2022 E and 2029 F
Figure 116: MEA Pressure Bandages Market Size Analysis, 2014–2021
Figure 117: MEA Pressure Bandages Market Forecast, 2022–2029
Figure 118: GCC Countries Pressure Bandages Market Size (US$ Mn) 2014–2029 & Y-o-Y analysis, 2022 - 2029
Figure 119: South Africa Pressure Bandages Market Size (US$ Mn) 2014–2029 & Y-o-Y analysis, 2022 - 2029
Figure 120: Rest od MEA Pressure Bandages Market Size (US$ Mn) 2014–2029 & Y-o-Y analysis, 2022 - 2029
Figure 121: MEA Pressure Bandages Market Size (US$ Mn) Analysis, By Short Stretch Bandages Pressure Bandages, 2014–2021 &
Figure 122: MEA Pressure Bandages Market Size (US$ Mn) Analysis, By Long Stretch Bandages Pressure Bandages, 2014–2021 &
Figure 123: MEA Pressure Bandages Market Size (US$ Mn) Analysis, By Multi Layer Compression System Bandages Pressure Bandages, 2014–2021 & Y-o-Y analysis, 2022 - 2029
Figure 124: MEA Pressure Bandages Market Attractiveness Analysis By Country, 2022–2029
Figure 125: MEA Pressure Bandages Market Attractiveness Analysis By Product Type, 2022–2029
Figure 126: MEA Pressure Bandages Market Attractiveness Analysis By Application, 2022–2029
Figure 127: MEA Pressure Bandages Market Attractiveness Analysis By Raw Material, 2022–2029
Figure 128: MEA Pressure Bandages Market Attractiveness Analysis By Distribution Channel, 2022–2029
Figure 129: Global Pressure Bandages Market Attractiveness Analysis, By Region
Figure 130: Global Pressure Bandages Market Attractiveness Analysis, By Product Type
Figure 131: Global Pressure Bandages Market Attractiveness Analysis, By Application
Figure 132: Global Pressure Bandages Market Attractiveness Analysis, By Raw Material
Figure 133: Global Pressure Bandages Market Attractiveness Analysis, By Distribution Channel
Figure 134: Global Pressure Bandages Historical Market Size (US$ Mn), 2014 - 2021
Figure 135: Global Pressure Bandages Market Size (US$ Mn) and Y-o-Y, 2022 - 2029
Figure 136: Global Pressure Bandages Market Absolute $ Opportunity, 2014–2027
Figure 129: China Breast Pump Market Forecast & Y-o-Y Growth (%), 2022–2029
Figure 130: India Breast Pump Market Size (US$ Mn) Analysis, 2014–2021
Figure 131: India Breast Pump Market Forecast & Y-o-Y Growth (%), 2022–2029
Figure 132: ASEAN Breast Pump Market Size (US$ Mn) Analysis, 2014–2021
Figure 133: ASEAN Breast Pump Market Forecast & Y-o-Y Growth (%), 2022–2029
Figure 134: Australia & New Zealand Breast Pump Market Size (US$ Mn) Analysis, 2014–2021
Figure 135: Australia & New Zealand Breast Pump Market Forecast & Y-o-Y Growth (%), 2022–2029
Figure 136: Rest of APEJ Breast Pump Market Size (US$ Mn) Analysis, 2014–2021
Figure 137: Rest of APEJ Breast Pump Market Forecast & Y-o-Y Growth (%), 2022–2029
Figure 138: APEJ Breast Pump Market Size (US$ Mn) Analysis, By Closed System Breast Pumps, 2014–2021
Figure 139: APEJ Breast Pump Market Forecast & Y-o-Y Growth (%), By Closed System Breast Pumps, 2022–2029
Figure 140: APEJ Breast Pump Market Size (US$ Mn) Analysis, By Open System Breast Pumps, 2014–2021
Figure 141: APEJ Breast Pump Market Forecast & Y-o-Y Growth (%), By Open System Breast Pumps, 2022–2029
Figure 142: APEJ Breast Pump Market Size (US$ Mn) Analysis, By Electric Breast Pumps, 2014–2021
Figure 143: APEJ Breast Pump Market Forecast & Y-o-Y Growth (%), By Electric Breast Pumps, 2022–2029
Figure 144: APEJ Breast Pump Market Size (US$ Mn) Analysis, By Manual Breast Pumps, 2014–2021
Figure 145: APEJ Breast Pump Market Forecast & Y-o-Y Growth (%), By Manual Breast Pumps, 2022–2029
Figure 146: APEJ Breast Pump Market Size (US$ Mn) Analysis, By Homecare Settings, 2014–2021
Figure 147: APEJ Breast Pump Market Forecast & Y-o-Y Growth (%), By Homecare Settings, 2022–2029
Figure 148: APEJ Breast Pump Market Size (US$ Mn) Analysis, By Healthcare Facilities, 2014–2021
Figure 149: APEJ Breast Pump Market Forecast & Y-o-Y Growth (%), By Healthcare Facilities, 2022–2029
Figure 150: APEJ Breast Pump Market Attractiveness Analysis, By Product Type, 2022–2029
Figure 151: APEJ Breast Pump Market Attractiveness Analysis, By Technology, 2022–2029
Figure 152: APEJ Breast Pump Market Attractiveness Analysis, By End User, 2022–2029
Figure 153: APEJ Breast Pump Market Attractiveness Analysis, By Country, 2022–2029
Figure 154: Japan Breast Pump Market Value Share By Product Type (2022)
Figure 155: Japan Breast Pump Market Value Share By Technology (2022)
Figure 156: Japan Breast Pump Market Value Share By End User (2022)
Figure 157: Japan Breast Pump Market Forecast 2022 and 2029
Figure 158: Japan Breast Pump Market Size Analysis, 2014–2021
Figure 159: Japan Breast Pump Market Forecast, 2022–2029
Figure 160: Japan Breast Pump Market Size (US$ Mn) Analysis, By Closed System Breast Pumps, 2014–2021
Figure 161: Japan Breast Pump Market Forecast & Y-o-Y Growth (%), By Closed System Breast Pumps, 2022–2029
Figure 162: Japan Breast Pump Market Size (US$ Mn) Analysis, By Open System Breast Pumps, 2014–2021
Figure 163: Japan Breast Pump Market Forecast & Y-o-Y Growth (%), By Open System Breast Pumps, 2022–2029
Figure 164: Japan Breast Pump Market Size (US$ Mn) Analysis, By Electric Breast Pumps, 2014–2021
Figure 165: Japan Breast Pump Market Forecast & Y-o-Y Growth (%), By Electric Breast Pumps, 2022–2029
Figure 166: Japan Breast Pump Market Size (US$ Mn) Analysis, By Manual Breast Pumps, 2014–2021
Figure 167: Japan Breast Pump Market Forecast & Y-o-Y Growth (%), By Manual Breast Pumps, 2022–2029
Figure 168: Japan Breast Pump Market Size (US$ Mn) Analysis, By Homecare Settings, 2014–2021
Figure 169: Japan Breast Pump Market Forecast & Y-o-Y Growth (%), By Homecare Settings, 2022–2029
Figure 170: Japan Breast Pump Market Size (US$ Mn) Analysis, By Healthcare Facilities, 2014–2021
Figure 171: Japan Breast Pump Market Forecast & Y-o-Y Growth (%), By Healthcare Facilities, 2022–2029
Figure 172: Japan Breast Pump Market Attractiveness Analysis, By Product Type, 2022–2029
Figure 173: Japan Breast Pump Market Attractiveness Analysis, By Technology, 2022–2029
Figure 174: Japan Breast Pump Market Attractiveness Analysis, By End User, 2022–2029
Figure 175: MEA Breast Pump Market Value Share By Product Type (2022)
Figure 176: MEA Breast Pump Market Value Share By Technology (2022)
Figure 177: MEA Breast Pump Market Value Share By End User (2022)
Figure 178: MEA Breast Pump Market Forecast 2022 and 2029
Figure 179: MEA Breast Pump Market Size Analysis, 2014–2021
Figure 180: MEA Breast Pump Market Forecast, 2022–2029
Figure 181: GCC Countries Breast Pump Market Size (US$ Mn) Analysis, 2014–2021
Figure 182: GCC Countries Breast Pump Market Forecast & Y-o-Y Growth (%), 2022–2029
Figure 183: South Africa Breast Pump Market Size (US$ Mn) Analysis, 2014–2021
Figure 184: South Africa Breast Pump Market Forecast & Y-o-Y Growth (%), 2022–2029
Figure 185: North Africa Breast Pump Market Size (US$ Mn) Analysis, 2014–2021
Figure 186: North Africa Breast Pump Market Forecast & Y-o-Y Growth (%), 2022–2029
Figure 187: Rest of MEA Breast Pump Market Size (US$ Mn) Analysis, 2014–2021
Figure 188: Rest of MEA Breast Pump Market Forecast & Y-o-Y Growth (%), 2022–2029
Figure 189: MEA Breast Pump Market Size (US$ Mn) Analysis, By Closed System Breast Pumps, 2014–2021
Figure 190: MEA Breast Pump Market Forecast & Y-o-Y Growth (%), By Closed System Breast Pumps, 2022–2029
Figure 191: MEA Breast Pump Market Size (US$ Mn) Analysis, By Open System Breast Pumps, 2014–2021
Figure 192: MEA Breast Pump Market Forecast & Y-o-Y Growth (%), By Open System Breast Pumps, 2022–2029
Figure 193: MEA Breast Pump Market Size (US$ Mn) Analysis, By Electric Breast Pumps, 2014–2021
Figure 194: MEA Breast Pump Market Forecast & Y-o-Y Growth (%), By Electric Breast Pumps, 2022–2029
Figure 195: MEA Breast Pump Market Size (US$ Mn) Analysis, By Manual Breast Pumps, 2014–2021
Figure 196: MEA Breast Pump Market Forecast & Y-o-Y Growth (%), By Manual Breast Pumps, 2022–2029
Figure 197: MEA Breast Pump Market Size (US$ Mn) Analysis, By Homecare Settings, 2014–2021
Figure 198: MEA Breast Pump Market Forecast & Y-o-Y Growth (%), By Homecare Settings, 2022–2029
Figure 199: MEA Breast Pump Market Size (US$ Mn) Analysis, By Healthcare Facilities, 2014–2021
Figure 200: MEA Breast Pump Market Forecast & Y-o-Y Growth (%), By Healthcare Facilities, 2022–2029
Figure 201: MEA Breast Pump Market Attractiveness Analysis, By Product Type, 2022–2029
Figure 202: MEA Breast Pump Market Attractiveness Analysis, By Technology, 2022–2029
Figure 203: MEA Breast Pump Market Attractiveness Analysis, By End User, 2022–2029
Figure 204: MEA Breast Pump Market Attractiveness Analysis, By Country, 2022–2029
Figure 205: Global Breast Pump Market Attractiveness Analysis, By Region
Figure 206: Global Breast Pump Market Attractiveness Analysis, By Product Type
Figure 207: Global Breast Pump Market Attractiveness Analysis, By Distribution Channel
Figure 208: Global Breast Pump Market Attractiveness Analysis, By End User
Figure 209: Global Breast Pump Historical Market Size (US$ Mn), 2014 - 2021
Figure 210: Global Breast Pump Market Size (US$ Mn) and Y-o-Y, 2022 - 2029
Figure 211: Global Breast Pump Market Absolute $ Opportunity, 2014–2029
Figure 212: Global Breast Pump Market Value Chain Analysis
The global pressure bandages market is expected to reach a valuation of USD 217.2 Million in 2022.
The global pressure bandages market grew at a 2.7% CAGR between 2014 and 2021.
Growing incidence of diabetic foot ulcers, along with increasing investments in patient healthcare reimbursement plans will boost sales in the market over the assessment period.
North America is projected to account for 40.6% of the global pressure bandages market share during the forecast period.
The pressure bandages market in Europe is anticipated to command 31.8% of the total market share in 2022.
Explore Similar Insights
Thank you!
You will receive an email from our Business Development Manager. Please be sure to check your SPAM/JUNK folder too.