The MEMS Pressure Sensor Market is estimated to be valued at USD 2.7 billion in 2025 and is projected to reach USD 4.9 billion by 2035, registering a compound annual growth rate (CAGR) of 6.2% over the forecast period.
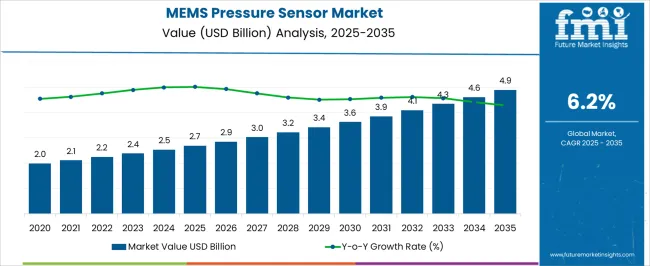
| Metric | Value |
|---|---|
| MEMS Pressure Sensor Market Estimated Value in (2025 E) | USD 2.7 billion |
| MEMS Pressure Sensor Market Forecast Value in (2035 F) | USD 4.9 billion |
| Forecast CAGR (2025 to 2035) | 6.2% |
The MEMS pressure sensor market is exhibiting strong growth momentum, supported by the increasing demand for compact, energy-efficient, and high-performance sensors across multiple industries. The rapid electrification of vehicles, emergence of autonomous driving technologies, and rising regulatory emphasis on vehicle safety and emissions monitoring have significantly increased the integration of pressure sensing systems within the automotive sector.
Simultaneously, broader deployment in consumer electronics, industrial automation, and medical devices has reinforced the relevance of MEMS sensors in real-time monitoring and control. Technological advancements in semiconductor manufacturing, along with improvements in sensor calibration and environmental compensation, have enhanced the reliability and scalability of MEMS-based pressure sensing platforms.
The ongoing shift toward Industry 4.0 and IoT ecosystems has further emphasized the need for sensors that are software-configurable, offer digital outputs, and support edge data processing Over the forecast period, market expansion is expected to be supported by continued innovation in packaging, materials, and signal conditioning circuits, allowing for broader adaptability in both harsh and precision-oriented environments.
The market is segmented by End User, Technology, and Type and region. By End User, the market is divided into Automotive, Healthcare, and Industrial. In terms of Technology, the market is classified into Piezoresistive and Capacitive. Based on Type, the market is segmented into Absolute, Gauge type, and Differential. Regionally, the market is classified into North America, Latin America, Western Europe, Eastern Europe, Balkan & Baltic Countries, Russia & Belarus, Central Asia, East Asia, South Asia & Pacific, and the Middle East & Africa.
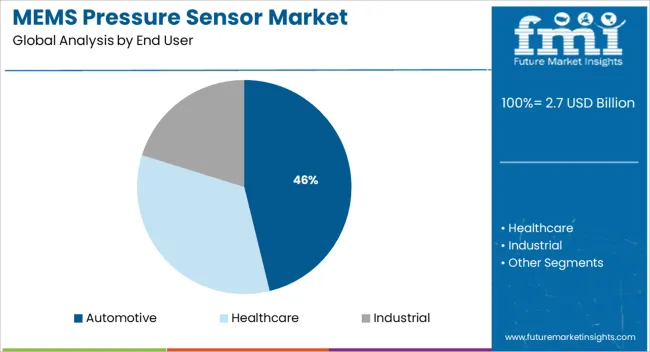
The automotive segment is projected to account for 46.2% of the overall revenue share in the MEMS pressure sensor market in 2025, making it the leading end-user industry. This leadership is being driven by the increasing number of sensor-based systems in modern vehicles, where MEMS pressure sensors are used extensively in tire pressure monitoring systems, engine management, exhaust control, and airbag deployment.
Regulatory requirements surrounding emission control and fuel efficiency have prompted automotive manufacturers to integrate pressure sensors across combustion, electric, and hybrid vehicle architectures. The robustness of MEMS technology and its ability to maintain performance across extreme temperatures and vibrations have made it a preferred choice for automotive-grade applications.
In addition, the growth in electric vehicle production and demand for predictive maintenance solutions have reinforced sensor deployment The automotive sector’s push toward digital transformation and smart diagnostics has accelerated the adoption of MEMS sensors that support continuous monitoring and data-driven decision-making, contributing to the sustained dominance of this segment.
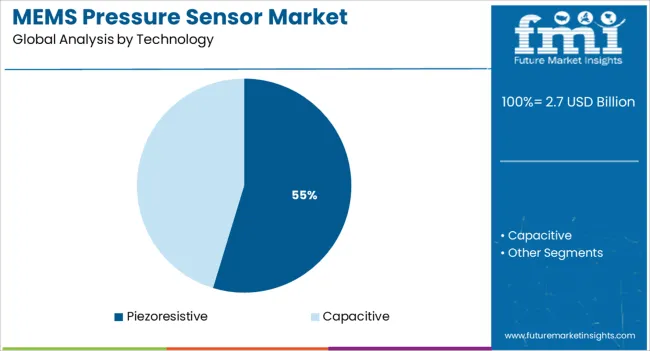
The piezoresistive technology segment is expected to contribute 54.7% of the total revenue share in the MEMS pressure sensor market by 2025, reflecting its dominant role in current sensor architectures. This growth is attributed to the inherent simplicity, stability, and sensitivity offered by piezoresistive structures, which are well-suited for both high and low-pressure ranges across diverse application scenarios.
The technology’s compatibility with standard CMOS processes has allowed for cost-effective mass production and seamless integration into various electronic systems. Piezoresistive MEMS sensors have demonstrated high accuracy and thermal stability, making them ideal for automotive, industrial, and medical environments where reliability is essential.
The rising need for continuous pressure monitoring in compact form factors has favored this technology, particularly in miniaturized and portable devices Additionally, advancements in micromachining and thin-film materials have enabled higher precision outputs, low power consumption, and long-term drift compensation, supporting their widespread use in evolving sensor ecosystems.
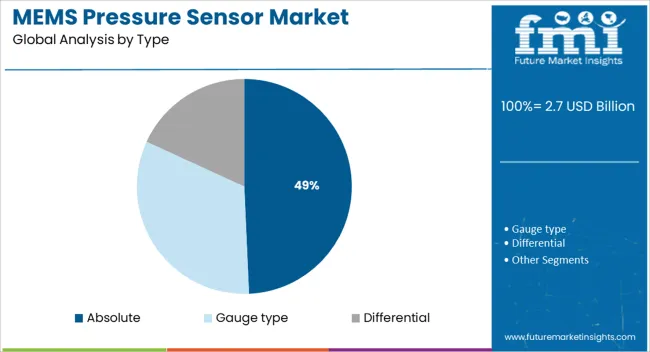
The absolute pressure sensor type is projected to command 49.3% of the total market share in the MEMS pressure sensor landscape in 2025. This dominance is being shaped by the growing need for precise pressure reference measurements in controlled and dynamic environments. Absolute pressure sensors are extensively utilized in applications where pressure is measured relative to a fixed vacuum reference, enabling consistent outputs regardless of environmental fluctuations.
Their use has gained traction in barometric pressure sensing, altimetry, and industrial vacuum systems where stability and accuracy are paramount. MEMS-based absolute sensors have benefitted from innovations in diaphragm design and signal processing, leading to reduced noise, improved linearity, and enhanced long-term stability.
The demand for real-time ambient pressure feedback in navigation systems, drones, and wearable devices has further strengthened the relevance of this sensor type As industries continue to demand high-performance, compact, and software-configurable pressure sensing solutions, the absolute type remains integral to mission-critical and performance-sensitive operations.
From 2020 to 2024, sales witnessed significant growth, registering a CAGR of 4.2%. Micro-electro-mechanical systems (MEMS) pressure sensors are widely utilized in applications which require absolute, gauge and differential pressure measurements. MEMS pressure sensors sense on the micro scale and can generate effects on the macro scale.
MEMS Pressure Sensors are widely used in harsh environments, ultra-low pressure ranges, and extremely small size atmospheres. Also MEMS Pressure Sensors are utilized in various energy domains, which include electrical, mechanical, thermal, magnetic, chemical and radiant. The overall demand for MEMS Pressure Sensors is projected to grow at a CAGR of 6.2% between 2025 and 2035, totalling around USD 4,086.9 Million by 2035.
Increased Demand from Automotive Industry Likely to Augment MEMS Pressure Sensor Sales
Increasing demand for MEMS Pressure Sensors from the automotive industry to enhance reliability, reduce cost and improve performance is the key factor driving the growth of MEMS global pressure sensor market during the forecast period. Furthermore, continuous focus on factory automation, rapid development in industrial IoT solutions and improved sensing approach for monitoring & control applications are the factors accelerating the demand for MEMS pressure sensors in the industrial manufacturing sector.
Also, the increasing demand for disposable pressure sensors and continuous innovation in MEMS-enabled medical applications are expected to positively impact the growth of the global MEMS pressure sensor market in medical space. Also, rapid growth in consumer electronics, such as smartphones and home appliances, and rising demand for customized MEMS devices for aerospace and defense applications are expected to fuel the growth of MEMS Pressure Sensor market during the forecast period.
Increasing Awareness of Hazardous Gasses and Compounds to Impede the Growth
Lack of standard fabrication process and technical difficulties in integration and packing process are identified as the restraints likely to deter the progression of global MEMS pressure sensor market during the forecast period.
Rising Market Competition to Boost the Market Growth in North America
The North America MEMS Pressure Sensor market is expected to accumulate a market share of 33.2% in 2025. North America is dominating and contributing the leading shares to the MEMS Pressure Sensor market in terms of revenue and is expected to register a significant growth over a forecast period due to the increasing market competition.
For instance, in February 2025, Abbott announced that the US Food and Drug Administration (FDA) had approved an expanded indication for its CardioMEMS HF System to support the care of people living with heart failure. As a result, an additional 1.2 million USA patients are now eligible to benefit from advanced monitoring with the company's sensor, which marks a significant increase over the current addressable population. The sensor provides an early warning system that enables doctors to protect against worsening heart failure.
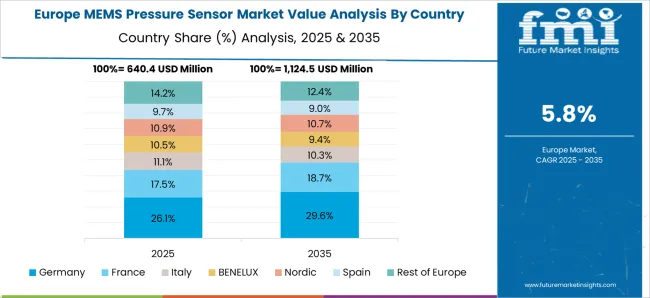
Presence of Large Number of Automobile Manufacturers to Boost Market Growth in Europe
The European region is anticipated to hold a market share of 21.7%. Europe is expected to contribute to moderate revenue market share and register a healthy growth rate in the global MEMS Pressure Sensor market due to government initiatives to expand the industrial infrastructure, presence of a large number of automobile and original equipment manufacturers.
Some key startups in the MEMS Pressure Sensor market include axSense Technologies, CEKO Sensors, ACEINNA, Enervibe and many more.
Recent Developments:
Prominent players in the MEMS Pressure Sensor market are Robert Bosch GmbH, Denso, NXP Semiconductors, General Electric, Texas Instruments, Infineon Technologies, MRON Corporation, Infineon Technologies AG, and Melexis and various other regional players.
| Report Attribute | Details |
|---|---|
| Growth Rate | CAGR of 6.2% from 2025 to 2035 |
| Market Value in 2025 | USD 2.7 billion |
| Market Value in 2035 | USD 4.9 billion |
| Base Year for Estimation | 2024 |
| Historical Data | 2020 to 2024 |
| Forecast Period | 2025 to 2035 |
| Quantitative Units | Revenue in USD Million and CAGR from 2025-2035 |
| Report Coverage | Revenue Forecast, Company Ranking, Competitive Landscape, Growth Factors, Trends and Pricing Analysis |
| Segments Covered | End User, Technology, Type, Region |
| Regions Covered | North America; Latin America; Europe; Asia Pacific; Middle East and Africa (MEA) |
| Key Countries Profiled | USA, Canada, Brazil, Mexico, Germany, UK, France, Spain, Italy, China, Japan, South Korea, Malaysia, Singapore, Australia, New Zealand, GCC, South Africa, Israel |
| Key Companies Profiled | Robert Bosch GmbH; Denso; NXP Semiconductors; General Electric; Texas Instruments; Infineon Technologies AG; MRON Corporation; Honeywell International; ST Electronics |
| Report Customization | Available upon Request |
The global mems pressure sensor market is estimated to be valued at USD 2.7 billion in 2025.
The market size for the mems pressure sensor market is projected to reach USD 4.9 billion by 2035.
The mems pressure sensor market is expected to grow at a 6.2% CAGR between 2025 and 2035.
The key product types in mems pressure sensor market are automotive, healthcare and industrial.
In terms of technology, piezoresistive segment to command 54.7% share in the mems pressure sensor market in 2025.


Full Research Suite comprises of:
Market outlook & trends analysis
Interviews & case studies
Strategic recommendations
Vendor profiles & capabilities analysis
5-year forecasts
8 regions and 60+ country-level data splits
Market segment data splits
12 months of continuous data updates
DELIVERED AS:
PDF EXCEL ONLINE
MEMS Oscillators Market Size and Share Forecast Outlook 2025 to 2035
MEMS Probes Market Size and Share Forecast Outlook 2025 to 2035
MEMS Microphones Market Size and Share Forecast Outlook 2025 to 2035
MEMS Microdisplay Market Analysis - Size and Share Forecast Outlook 2025 to 2035
MEMS Inkjet Heads Market Growth – Trends and Forecast 2025-2035
Mems Market
MEMS Sensor Market - Applications & Growth Forecast 2025 to 2035
Automotive MEMS Market Size and Share Forecast Outlook 2025 to 2035
Automotive MEMS Sensors Market Growth - Trends & Forecast 2025 to 2035
Wide Temperature MEMS Oscillator Market Size and Share Forecast Outlook 2025 to 2035
Micro-electromechanical System (MEMS) Market Size and Share Forecast Outlook 2025 to 2035
Pressure Relief Dressing Market Size and Share Forecast Outlook 2025 to 2035
Pressure Compensated Hydraulic Pump Market Size and Share Forecast Outlook 2025 to 2035
Pressure Compensated Pump Market Size and Share Forecast Outlook 2025 to 2035
Pressure Switch Market Forecast Outlook 2025 to 2035
Pressure Reducing Valve Market Size and Share Forecast Outlook 2025 to 2035
Pressure-Volume Loop Systems Market Size and Share Forecast Outlook 2025 to 2035
Pressure Transmitter Market Size and Share Forecast Outlook 2025 to 2035
Pressure Monitoring Extension Tubing Sets Market Size and Share Forecast Outlook 2025 to 2035
Pressure Sensitive Labeling Machine Market Size and Share Forecast Outlook 2025 to 2035

Thank you!
You will receive an email from our Business Development Manager. Please be sure to check your SPAM/JUNK folder too.
Chat With
MaRIA