The MEMS oscillators market stands at the threshold of a decade-long expansion trajectory that promises to reshape precision timing technology and frequency control solutions. The market's journey from USD 624.5 million in 2025 to USD 1,590.6 million by 2035 represents substantial growth, demonstrating the accelerating adoption of advanced silicon-based timing devices and miniaturized oscillator solutions across consumer electronics, telecommunications infrastructure, and automotive systems.
The first half of the decade (2025-2030) will witness the market climbing from USD 624.5 million to approximately USD 996.7 million, adding USD 372.2 million in value, which constitutes 39% of the total forecast growth period. This phase will be characterized by the rapid adoption of chip-scale package MEMS oscillators, driven by increasing 5G deployment requirements and the growing need for compact, high-reliability timing solutions worldwide. Enhanced frequency stability capabilities and temperature compensation features will become standard expectations rather than premium options.
The latter half (2030-2035) will witness continued growth from USD 996.7 million to USD 1,590.6 million, representing an addition of USD 593.9 million or 61% of the decade's expansion. This period will be defined by mass market penetration of automotive-grade timing devices, integration with comprehensive IoT platforms, and seamless compatibility with emerging wireless infrastructure. The market trajectory signals fundamental shifts in how electronics manufacturers approach timing accuracy and system miniaturization, with participants positioned to benefit from growing demand across multiple frequency bands and packaging types.
| Period | Primary Revenue Buckets | Share | Notes |
|---|---|---|---|
| Today | Consumer electronics timing components | 38% | Smartphones, wearables, IoT devices |
| Telecom & networking equipment | 24% | Base stations, optical modules, backhaul | |
| Automotive electronics systems | 16% | ADAS, infotainment, powertrain control | |
| Industrial automation & IoT | 14% | Sensors, edge devices, factory equipment | |
| Aerospace & defense applications | 8% | Ruggedized timing, mission-critical systems | |
| Future (3-5 yrs) | 5G/6G infrastructure timing | 28-32% | Open RAN, optical transport, edge computing |
| Automotive ADAS & EV systems | 22-26% | Zonal controllers, battery management, V2X | |
| Consumer & mobile devices | 20-24% | Smartphones, wearables, AR/VR headsets | |
| Industrial IoT & automation | 15-18% | Smart factories, predictive maintenance sensors | |
| Data center & AI infrastructure | 8-10% | Server timing, synchronization, AI accelerators | |
| Aerospace/defense & medical | 5-7% | Ruggedized applications, precision instruments |
| Metric | Value |
|---|---|
| Market Value (2025) | USD 624.5 million |
| Market Forecast (2035) | USD 1,590.6 million |
| Growth Rate | 9.8% CAGR |
| Leading Packaging Technology | Chip-Scale Package (CSP) |
| Primary Application | Consumer Electronics & Mobile Segment |
The market demonstrates strong fundamentals with chip-scale package MEMS oscillators capturing dominant share through advanced miniaturization capabilities and consumer electronics integration optimization. Consumer electronics and mobile applications drive primary demand, supported by increasing smartphone production and IoT device proliferation requirements. Geographic expansion remains concentrated in developed markets with established semiconductor infrastructure, while emerging economies show accelerating adoption rates driven by electronics manufacturing localization initiatives and rising connectivity standards.
Primary Classification: The market segments by packaging into chip-scale package (CSP) and surface-mount device (SMD) package types, representing the evolution from traditional oscillator packages to ultra-miniaturized timing solutions for comprehensive electronics integration optimization.
Secondary Classification: General circuitry segmentation divides the market into voltage-controlled MEMS oscillators (VCMO), temperature-compensated (TCMO), simple/standard (SPMO), digitally-controlled (DCMO), frequency-selective (FSMO), and spread-spectrum (SSMO) configurations, reflecting distinct requirements for frequency stability, tuning capability, and electromagnetic interference management standards.
Tertiary Classification: Frequency band segmentation covers MHz band and kHz band applications, while end-use segments span consumer electronics and mobile, telecom and networking (including 5G), automotive (including ADAS/infotainment), industrial/IoT and automation, and aerospace and defense and other sectors.
Regional Classification: Geographic distribution covers North America, Latin America, Western Europe, Eastern Europe, East Asia, South Asia Pacific, and Middle East & Africa, with developed markets leading adoption while emerging economies show accelerating growth patterns driven by electronics manufacturing expansion programs.
The segmentation structure reveals technology progression from standard oscillator configurations toward sophisticated programmable timing systems with enhanced stability and miniaturization capabilities, while application diversity spans from consumer smartphones to automotive safety systems requiring ultra-reliable frequency control solutions.
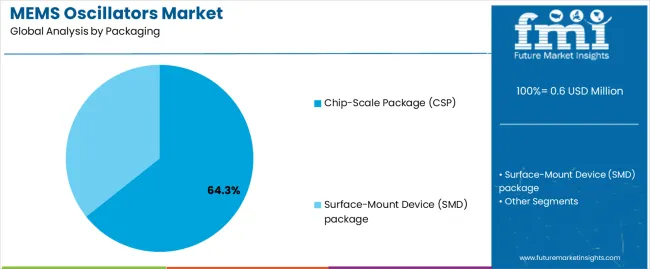
Market Position: Chip-Scale Package (CSP) commands the leading position in the MEMS oscillators market with 64.3% market share through advanced miniaturization features, including superior space efficiency, board-level integration optimization, and consumer electronics compatibility that enable device manufacturers to achieve compact timing solutions across diverse smartphone, wearable, and IoT device environments.
Value Drivers: The segment benefits from electronics manufacturer preference for ultra-compact timing systems that provide reliable frequency generation, reduced printed circuit board footprint, and design flexibility without requiring significant layout modifications. Advanced packaging features enable multi-device integration, automated pick-and-place compatibility, and thermal management optimization, where size reduction and assembly efficiency represent critical manufacturing requirements.
Competitive Advantages: CSP MEMS oscillators differentiate through proven miniaturization leadership, automated assembly compatibility, and integration with comprehensive system-on-chip designs that enhance product competitiveness while maintaining optimal performance standards suitable for diverse consumer electronics and mobile applications.
Key market characteristics:
Surface-Mount Device (SMD) package maintains a 35.7% market position in the MEMS oscillators market due to its proven reliability characteristics and industrial application advantages. These packages appeal to manufacturers requiring robust timing solutions with established qualification history for automotive and industrial applications. Market strength is driven by automotive electronics expansion, emphasizing proven packaging solutions and thermal performance through traditional configurations.
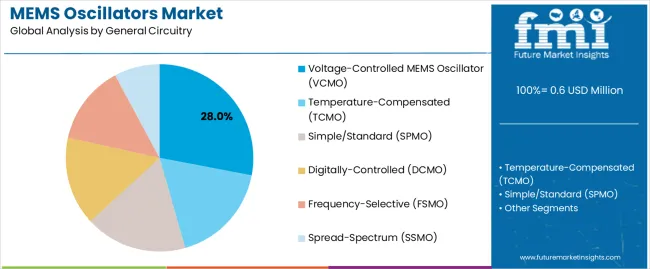
Market Context: Voltage-Controlled MEMS Oscillators (VCMO) demonstrate the leading market position in the MEMS oscillators market with 28.0% market share due to widespread adoption of frequency-tunable timing systems and increasing focus on phase-locked loop applications, synchronization flexibility, and communication infrastructure that maximizes design versatility while maintaining frequency accuracy standards.
Appeal Factors: VCMO users prioritize frequency tunability, voltage-controlled operation, and integration with clock generation and data recovery circuits that enable coordinated timing management across multiple system functions. The segment benefits from substantial telecommunications investment and wireless infrastructure programs that emphasize the deployment of flexible timing systems for synchronization and clock generation applications.
Growth Drivers: 5G network expansion programs incorporate VCMO oscillators as essential timing components for base station synchronization, while optical networking growth increases demand for tunable frequency capabilities that comply with system timing standards and minimize phase noise performance.
Market Challenges: Higher power consumption compared to fixed-frequency alternatives and increased circuit complexity may limit adoption in ultra-low-power applications or cost-sensitive designs.
Application dynamics include:
Temperature-Compensated MEMS Oscillators (TCMO) capture 22.5% market share through superior frequency stability across temperature variations and automotive-grade reliability. Simple/Standard MEMS Oscillators (SPMO) hold 18.5% market share, Digitally-Controlled MEMS Oscillators (DCMO) account for 15.0%, Frequency-Selective MEMS Oscillators (FSMO) represent 10.0%, while Spread-Spectrum MEMS Oscillators (SSMO) maintain 6.0% through electromagnetic interference reduction applications.
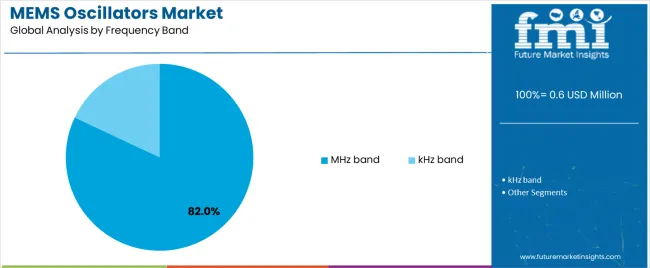
Market Position: MHz band oscillators command dominant market position with 82.0% market share through universal application compatibility across digital electronics systems.
Value Drivers: This frequency range provides the fundamental timing requirements for microprocessors, digital signal processors, and wireless communication systems, meeting needs for system clocking, data synchronization, and interface timing without specialized circuit designs.
Growth Characteristics: The segment benefits from broad applicability across all electronics sectors, standardized frequency specifications, and established design methodologies that support widespread adoption and circuit integration efficiency.
kHz band oscillators capture 18.0% market share through low-power timing requirements in real-time clocks, sensor interfaces, and ultra-low-power IoT devices requiring extended battery operation and minimal energy consumption.
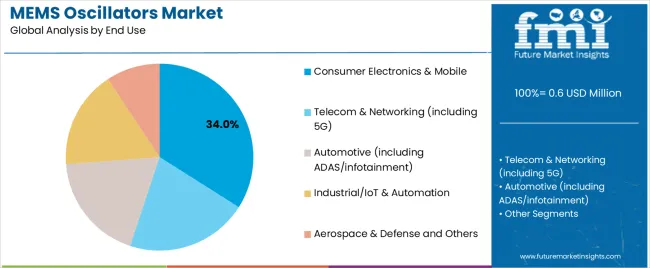
Market Context: Consumer Electronics & Mobile applications dominate the market with 34.0% market share, reflecting the primary demand driver for miniaturized timing solutions in portable devices and connected electronics.
Business Model Advantages: Consumer electronics provide massive volume opportunities for MEMS oscillator deployment, driving cost reduction and technology innovation while maintaining compact form factors and reliable performance requirements.
Operational Benefits: Mobile device applications include smartphones, tablets, wearables, and smart home devices that drive consistent demand for timing components while requiring ultra-compact packages and low power consumption capabilities.
Telecom & Networking including 5G applications capture 26.0% market share through base station timing, optical transport synchronization, and backhaul equipment requirements. Automotive including ADAS/infotainment holds 17.0%, Industrial/IoT & Automation accounts for 15.0%, while Aerospace & Defense and Others represent 8.0% of the market.
| Category | Factor | Impact | Why It Matters |
|---|---|---|---|
| Driver | 5G infrastructure deployment & network densification (base stations, small cells, fronthaul/backhaul timing) | ★★★★★ | 5G networks require precise timing synchronization across distributed architecture; MEMS oscillators providing compact, reliable timing for thousands of new cell sites and optical transport equipment. |
| Driver | Automotive electronics content growth (ADAS, zonal architectures, EV power systems, V2X communication) | ★★★★★ | Vehicle electrification and autonomy multiplying electronic control units; automotive-grade MEMS oscillators replacing quartz in harsh-environment applications with superior vibration resistance and reliability. |
| Driver | IoT device proliferation & edge computing (industrial sensors, smart cities, connected infrastructure) | ★★★★☆ | Billions of connected devices requiring compact timing solutions; MEMS oscillators enabling miniaturization and cost reduction for high-volume IoT deployments across industrial and consumer applications. |
| Restraint | Quartz crystal oscillator incumbency (established supply chains, designer familiarity, cost parity challenges) | ★★★★☆ | Legacy quartz technology deeply embedded in designs; switching costs and design qualification cycles slowing MEMS adoption despite performance advantages in certain applications. |
| Restraint | Phase noise performance gaps (ultra-low jitter applications, RF local oscillator requirements) | ★★★☆☆ | High-performance RF and precision instrumentation still preferring quartz; MEMS phase noise improving but not yet matching best quartz performance in most demanding applications. |
| Trend | Programmable & multi-frequency platforms (single-SKU flexibility, field programming, inventory optimization) | ★★★★★ | Equipment manufacturers seeking bill-of-material simplification; programmable MEMS oscillators enabling one component supporting multiple frequencies, reducing inventory complexity and accelerating design cycles. |
| Trend | Ultra-low jitter for high-speed data (100G/400G/800G optical, PCIe Gen5/6, DDR5 memory interfaces) | ★★★★☆ | Data rate increases demanding tighter timing specifications; MEMS suppliers investing in jitter reduction to capture optical networking and server timing sockets previously dominated by quartz. |
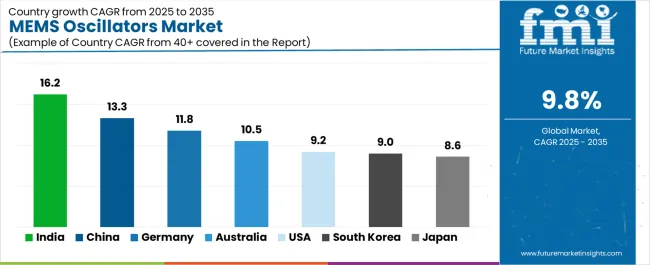
The MEMS oscillators market demonstrates varied regional dynamics with Growth Leaders including India (16.2% growth rate) and China (13.3% growth rate) driving expansion through electronics manufacturing scale-up initiatives and telecommunications infrastructure development. Steady Performers encompass Germany (11.8% growth rate), Australia (10.5% growth rate), and United States (9.2% growth rate), benefiting from established automotive industries and advanced technology adoption. Developed Markets feature South Korea (9.0% growth rate) and Japan (8.6% growth rate), where semiconductor leadership and precision manufacturing support consistent growth patterns.
Regional synthesis reveals South Asian markets leading adoption through smartphone production expansion and IoT device manufacturing, while East Asian countries maintain strong growth supported by consumer electronics dominance and 5G infrastructure advancement. European markets show robust growth driven by automotive electronics applications and Industry 4.0 integration trends.
| Region/Country | 2025-2035 Growth | How to win | What to watch out |
|---|---|---|---|
| India | 16.2% | Focus on mobile & IoT volume | Price pressure; quality consistency |
| China | 13.3% | Scale manufacturing partnerships | IP protection; local competition |
| Germany | 11.8% | Lead with automotive-grade | Long qualification cycles; conservative adoption |
| Australia | 10.5% | Ruggedized industrial timing | Small market size; project lumpiness |
| United States | 9.2% | Push data center & aerospace | Design-in cycles; quartz incumbency |
| South Korea | 9.0% | Leverage semiconductor ecosystem | Export dependency; technology cycles |
| Japan | 8.6% | Premium quality & precision | Deflation pressures; conservative switching |
India establishes fastest market growth through aggressive electronics manufacturing programs and comprehensive smartphone production expansion, integrating advanced MEMS oscillators as standard components in mobile devices and IoT equipment manufacturing. The country's 16.2% growth rate reflects government initiatives promoting electronics self-reliance and manufacturing scale that mandate the use of advanced timing components in consumer electronics and telecommunications facilities. Growth concentrates in major electronics hubs, including Bengaluru technology clusters, Noida manufacturing zones, and Chennai electronics corridors, where manufacturing infrastructure development showcases localized semiconductor component integration that appeals to device manufacturers seeking cost-effective solutions and domestic supply chain capabilities.
Indian electronics manufacturers are adopting MEMS oscillator technology through partnerships with global suppliers that combine competitive pricing with improving technical support, including smartphone-grade timing solutions and IoT device components. Distribution channels through electronics distributors and contract manufacturers expand market access, while government Production Linked Incentive schemes support adoption across diverse consumer electronics and telecommunications segments.
Strategic Market Indicators:
In Shenzhen electronics clusters, Shanghai technology zones, and Pearl River Delta manufacturing regions, device manufacturers are implementing advanced MEMS oscillators as standard components for product miniaturization and performance optimization applications, driven by massive consumer electronics output and 5G infrastructure deployment programs that emphasize the importance of precision timing. The market holds a 13.3% growth rate, supported by continued electronics manufacturing dominance and telecommunications network expansion that promote advanced timing systems for smartphone and network equipment manufacturing facilities. Chinese operators are adopting MEMS oscillator solutions that provide reliable frequency control and compact form factors, particularly appealing in high-volume production regions where cost efficiency and supply chain integration represent critical competitive requirements.
Market expansion benefits from vertically integrated electronics supply chains and domestic MEMS manufacturing capabilities that enable competitive timing solutions. Technology adoption follows patterns established in semiconductor components, where volume economics and supply security drive procurement decisions and production-scale deployment.
Market Intelligence Brief:
Germany's advanced automotive technology market demonstrates sophisticated MEMS oscillator deployment with documented operational effectiveness in ADAS systems and EV power electronics through integration with vehicle electronic architectures and safety systems. The country leverages automotive engineering expertise and quality standards to maintain an 11.8% growth rate. Automotive centers, including Stuttgart vehicle development, Munich automotive technology, and Wolfsburg manufacturing complexes, showcase automotive-grade installations where MEMS oscillators integrate with comprehensive electronic control systems and advanced driver assistance platforms to optimize system reliability and functional safety.
German automotive manufacturers prioritize AEC-Q100 qualification and functional safety certification in timing component procurement, creating demand for automotive-grade systems with advanced features, including extended temperature operation and vibration resistance. The market benefits from established automotive electronics infrastructure and willingness to invest in advanced timing technologies that provide long-term reliability benefits and compliance with automotive quality standards.
Market Intelligence Brief:
In Sydney telecommunications infrastructure, Melbourne industrial automation, and mining region equipment deployments, industrial operators are implementing advanced MEMS oscillators as ruggedized components for harsh environment reliability and precision timing applications, driven by telecommunications modernization and resource sector automation that emphasize the importance of reliable frequency control. The market holds a 10.5% growth rate, supported by telecom network upgrades and industrial IoT initiatives that promote compact timing systems for edge computing and automation equipment facilities. Australian operators are adopting MEMS oscillator systems that provide robust environmental performance and compact packaging, particularly appealing in remote deployment regions where equipment reliability and maintenance access represent critical operational requirements.
Market expansion benefits from telecommunications infrastructure investment and resource sector digitalization programs that require reliable timing solutions. Technology adoption follows patterns established in ruggedized electronics, where environmental resilience and supply reliability drive procurement decisions and remote deployment scenarios.
Market Intelligence Brief:
United States establishes strong market position through comprehensive data center infrastructure and advanced aerospace programs, integrating MEMS oscillators across server platforms, AI accelerators, and defense systems. The country's 9.2% growth rate reflects established technology relationships and advanced application adoption that supports widespread use of precision timing systems in critical infrastructure and aerospace facilities. Demand concentrates in data center hubs, aerospace manufacturing, and defense contractors, where technology deployment showcases advanced timing application that appeals to system architects seeking proven performance capabilities and reliability assurance.
American technology companies leverage established design ecosystems and comprehensive qualification infrastructure, including aerospace certification programs and data center standards that create supplier relationships and technology advantages. The market benefits from mature quality requirements and performance specifications that drive advanced MEMS adoption while supporting innovation and emerging application development.
Market Intelligence Brief:
South Korea's semiconductor and mobile device leadership demonstrates sophisticated MEMS oscillator integration with comprehensive supply chain coordination through established handset manufacturing and chip packaging. The country maintains a 9.0% growth rate, driven by 5G device ecosystem development and advanced packaging technology adoption.
Market dynamics focus on mobile device timing solutions integrated with semiconductor packaging and system-in-package configurations. Technology leadership in smartphones and semiconductor manufacturing creates consistent opportunities for advanced MEMS oscillator integration supporting miniaturization and performance optimization.
Strategic Market Considerations:
Japan's precision electronics market demonstrates sophisticated MEMS oscillator deployment with emphasis on automotive innovation and miniaturized timing through established quality standards and manufacturing excellence. The country maintains an 8.6% growth rate, driven by automotive electronics advancement and compact system design requirements.
Market dynamics focus on automotive-grade timing solutions and ultra-compact configurations for consumer and industrial equipment. Precision manufacturing culture and quality expectations create sustained demand for high-reliability MEMS oscillators supporting advanced automotive and miniaturized electronics applications.
Strategic Market Considerations:
The MEMS oscillators market in Europe is projected to grow from USD 181.1 million in 2025 to USD 453.3 million by 2035, representing 29.0% of global market in 2025 moderating to 28.5% by 2035. Germany is expected to maintain leadership with a 24.0% share of European market in 2025 (USD 43.5 million), easing to 23.0% by 2035 (USD 104.3 million) on continued dominance in automotive electronics and industrial automation.
United Kingdom holds an 18.0% share in 2025 (USD 32.6 million), maintaining 18.0% through 2035 (USD 81.6 million) with telecommunications infrastructure and aerospace applications. France accounts for a 16.0% share in 2025 (USD 28.9 million), maintaining 16.0% by 2035 (USD 72.5 million) on automotive and industrial equipment demand. Italy represents a 12.0% share in 2025 (USD 21.7 million), maintaining 12.0% through 2035 (USD 54.4 million) with industrial machinery and automotive components. Nordics hold a 10.0% share in 2025 (USD 18.1 million), maintaining 10.0% by 2035 (USD 45.3 million) driven by telecom and industrial applications. Benelux accounts for an 8.0% share in 2025 (USD 14.5 million), maintaining 8.0% through 2035 (USD 36.3 million). Spain represents a 7.0% share in 2025 (USD 12.7 million), maintaining 7.0% by 2035 (USD 31.7 million). Rest of Europe accounts for 5.0% in 2025 (USD 9.1 million), expanding to 6.0% by 2035 (USD 27.2 million) through Central and Eastern European electronics manufacturing growth.
| Stakeholder | What they actually control | Typical strengths | Typical blind spots |
|---|---|---|---|
| Pure-play MEMS timing leaders | Silicon technology, fabrication IP, frequency synthesis algorithms | Innovation leadership, performance advantage, automotive qualification depth | Manufacturing scale; distribution reach in consumer |
| Traditional oscillator manufacturers | Quartz heritage, customer relationships, broad product lines | Design-in base, application knowledge, channel coverage | MEMS technology; miniaturization leadership |
| Semiconductor diversifiers | Fab access, packaging technology, system integration capability | Manufacturing scale, cost position, adjacent product synergies | MEMS-specific expertise; timing application focus |
| Component distributors | Market access, inventory management, technical support field teams | Volume logistics, regional coverage, BOM consolidation | Technology roadmap; direct OEM relationships |
| Vertical integrators (handset/telecom) | Captive demand, system architecture control, integration advantages | Application optimization, cost transparency, supply security | External market; technology licensing |
| Item | Value |
|---|---|
| Quantitative Units | USD 624.5 million |
| Packaging | Chip-Scale Package (CSP), Surface-Mount Device (SMD) package |
| General Circuitry | Voltage-Controlled MEMS Oscillator (VCMO), Temperature-Compensated (TCMO), Simple/Standard (SPMO), Digitally-Controlled (DCMO), Frequency-Selective (FSMO), Spread-Spectrum (SSMO) |
| Frequency Band | MHz band, kHz band |
| End Use | Consumer Electronics & Mobile, Telecom & Networking (including 5G), Automotive (including ADAS/infotainment), Industrial/IoT & Automation, Aerospace & Defense and Others |
| Regions Covered | North America, Latin America, Western Europe, Eastern Europe, East Asia, South Asia Pacific, Middle East & Africa |
| Countries Covered | United States, China, Germany, India, United Kingdom, Japan, South Korea, Australia, Canada, Brazil, France, and 25+ additional countries |
| Key Companies Profiled | SiTime Corporation, Seiko Epson (Epson Toyocom), Silicon Labs, Murata Manufacturing, Abracon, TXC Corporation, Rakon (including Vectron), Renesas (including IDT), IQD Frequency Products, Diodes Incorporated |
| Additional Attributes | Dollar sales by packaging and circuitry categories, regional adoption trends across South Asia Pacific, East Asia, and Western Europe, competitive landscape with semiconductor manufacturers and timing component suppliers, electronics designer preferences for frequency stability and miniaturization, integration with system-on-chip platforms and communication systems, innovations in MEMS technology and jitter reduction, and development of automotive-grade timing solutions with enhanced performance and reliability optimization capabilities. |
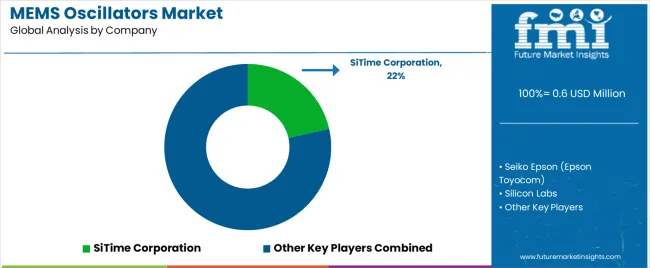
The global mems oscillators market is estimated to be valued at USD 0.6 million in 2025.
The market size for the mems oscillators market is projected to reach USD 1.6 million by 2035.
The mems oscillators market is expected to grow at a 9.8% CAGR between 2025 and 2035.
The key product types in mems oscillators market are chip-scale package (csp) and surface-mount device (smd) package.
In terms of general circuitry, voltage-controlled mems oscillator (vcmo) segment to command 28.0% share in the mems oscillators market in 2025.


Our Research Products

The "Full Research Suite" delivers actionable market intel, deep dives on markets or technologies, so clients act faster, cut risk, and unlock growth.

The Leaderboard benchmarks and ranks top vendors, classifying them as Established Leaders, Leading Challengers, or Disruptors & Challengers.

Locates where complements amplify value and substitutes erode it, forecasting net impact by horizon

We deliver granular, decision-grade intel: market sizing, 5-year forecasts, pricing, adoption, usage, revenue, and operational KPIs—plus competitor tracking, regulation, and value chains—across 60 countries broadly.

Spot the shifts before they hit your P&L. We track inflection points, adoption curves, pricing moves, and ecosystem plays to show where demand is heading, why it is changing, and what to do next across high-growth markets and disruptive tech

Real-time reads of user behavior. We track shifting priorities, perceptions of today’s and next-gen services, and provider experience, then pace how fast tech moves from trial to adoption, blending buyer, consumer, and channel inputs with social signals (#WhySwitch, #UX).

Partner with our analyst team to build a custom report designed around your business priorities. From analysing market trends to assessing competitors or crafting bespoke datasets, we tailor insights to your needs.
Supplier Intelligence
Discovery & Profiling
Capacity & Footprint
Performance & Risk
Compliance & Governance
Commercial Readiness
Who Supplies Whom
Scorecards & Shortlists
Playbooks & Docs
Category Intelligence
Definition & Scope
Demand & Use Cases
Cost Drivers
Market Structure
Supply Chain Map
Trade & Policy
Operating Norms
Deliverables
Buyer Intelligence
Account Basics
Spend & Scope
Procurement Model
Vendor Requirements
Terms & Policies
Entry Strategy
Pain Points & Triggers
Outputs
Pricing Analysis
Benchmarks
Trends
Should-Cost
Indexation
Landed Cost
Commercial Terms
Deliverables
Brand Analysis
Positioning & Value Prop
Share & Presence
Customer Evidence
Go-to-Market
Digital & Reputation
Compliance & Trust
KPIs & Gaps
Outputs
Full Research Suite comprises of:
Market outlook & trends analysis
Interviews & case studies
Strategic recommendations
Vendor profiles & capabilities analysis
5-year forecasts
8 regions and 60+ country-level data splits
Market segment data splits
12 months of continuous data updates
DELIVERED AS:
PDF EXCEL ONLINE
MEMS Probes Market Size and Share Forecast Outlook 2025 to 2035
MEMS Microphones Market Size and Share Forecast Outlook 2025 to 2035
MEMS Pressure Sensor Market Size and Share Forecast Outlook 2025 to 2035
MEMS Microdisplay Market Analysis - Size and Share Forecast Outlook 2025 to 2035
Oscillators Market Trends - Growth & Forecast 2025 to 2035
MEMS Sensor Market - Applications & Growth Forecast 2025 to 2035
MEMS Inkjet Heads Market Growth – Trends and Forecast 2025-2035
Mems Market
Automotive MEMS Market Size and Share Forecast Outlook 2025 to 2035
Automotive MEMS Sensors Market Growth - Trends & Forecast 2025 to 2035
TWS Earbuds MEMS Silicon Microphone Market Size and Share Forecast Outlook 2025 to 2035
Atomic Clock Oscillators Market Forecast and Outlook 2025 to 2035
Wide Temperature MEMS Oscillator Market Size and Share Forecast Outlook 2025 to 2035
High Reliability Oscillators Market Size and Share Forecast Outlook 2025 to 2035
Voltage Controlled Oscillators Market Size and Share Forecast Outlook 2025 to 2035
Micro-electromechanical System (MEMS) Market Size and Share Forecast Outlook 2025 to 2035

Thank you!
You will receive an email from our Business Development Manager. Please be sure to check your SPAM/JUNK folder too.
Chat With
MaRIA