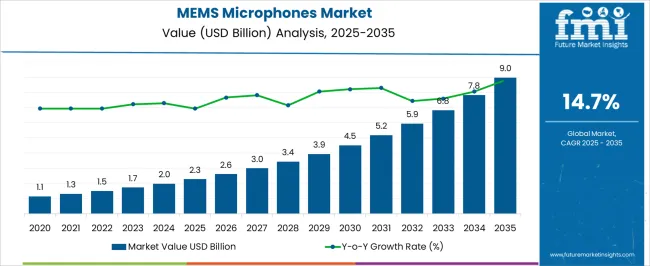
The global MEMS microphones market size is expected to reach USD 8,313.3 million in 2033. The MEMS microphones market is growing significantly. As per FMI Analysts, the global MEMS microphones market is estimated to be valued at USD 1,967.6 million in 2023 and is projected to increase at a CAGR of 15.5% in the forecast period from 2023 to 2033.
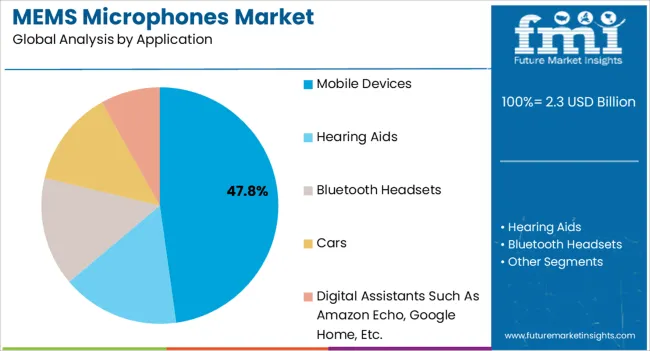
The market for MEMS microphones is booming with the increased adoption of mobile devices such as smartphones, tablets, etc. MEMS microphones provide enhanced features such as improved audio recording, which is resulting in increased usage of mobile phones, which is accelerating the MEMS microphones market growth.
Since MEMS microphone technology has been enhanced, it has been used in a variety of electrical devices and voice-activating systems, resulting in MEMS microphones being adopted in hearing aids as well. Further, MEMS microphones have been adopted in smartphones, so the product is poised to continue to be used in voice-activated products in the future.
Asia Pacific is the leading regional market in the report due to the presence of well-established manufacturing facilities in China, the Philippines, and Thailand, among others. According to the forecast, the Asia Pacific region is estimated to witness the highest CAGR in the coming years due to the significant proliferation of smartphones, hearing aids, and IoT & VR devices in the region.
Considering that VR is still in its infancy stages in the Middle East and Africa regional market, several hackathon events are being organized frequently to popularize VR technology, thereby bringing about an increase in the demand for MEMS microphones.
Currently, a few companies control a large market share of the MEMS microphones market. With the fierce competition intensifying, key players are focusing efforts on research and development activities and entering into partnerships with established players. They are also improving their distribution strategies by teaming up with distributors.
Manufacturing companies are also emphasizing the development of a robust distribution network across a wide range of countries. These strategies help them gradually increase the MEMS microphones market share. For example,
Report Attributes | Details |
---|---|
MEMS Microphones Market Estimated Base Year Value (2022) | USD 1,703.6 million |
MEMS Microphones Market Expected Market Value (2023) | USD 1,967.6 million |
MEMS Microphones Market Anticipated Forecast Value (2033) | USD 8,313.3 million |
MEMS Microphones Market Projected Growth Rate (2023 to 2033) | 15.5% CAGR |
Based on the report's regional analysis, North America is dominating the MEMS microphones market, with a share of 34%, owing to many well-established factories located there.
The region is expected to register a significant CAGR over the forecast period due to continued advancements in smartphones, hearing aids, and other consumer electronics, as well as the growing adoption of IoT and VR devices in.
The MEMS Microphone is projected to anticipate a high number of adoption rates given the region's high smartphone penetration rates and the already sizable consumer electronics market in the United States.
The adoption rate of MEMS microphone technology is probably going to increase significantly as the smartphone market is one of the most aggressive adopters of the technology.
One of the biggest manufacturers of smartphones located in the United States is Apple, and it has included MEMS microphones in several iPhone models.
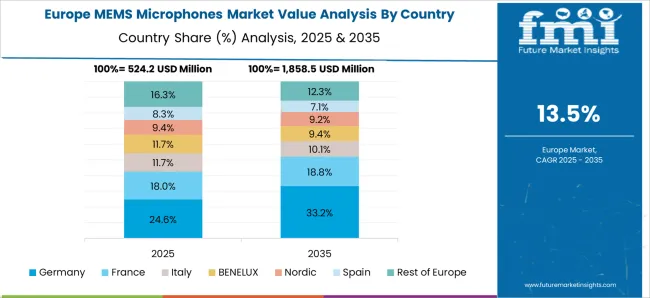
The Europe market is also expected to grow considerably with a share of 23%, because virtual reality is still in its early stages. Several hackathons are taking place frequently to popularize the technology in the Middle East and Africa’s markets, thus driving demand for MEMS microphones there.
MEMS microphone prices are assumed to decrease over the forecast period, and the profit margins for manufacturers are anticipated to decrease subsequently. Nonetheless, MEMS microphones are likely to be used in a multitude of industries and end-use verticals, including automotive, agriculture, telepresence, industrial manufacturing, oil & gas, construction, and medical telemetry, among others.
MEMS microphones are expected to be shipped in great numbers over the forecast period as a result.
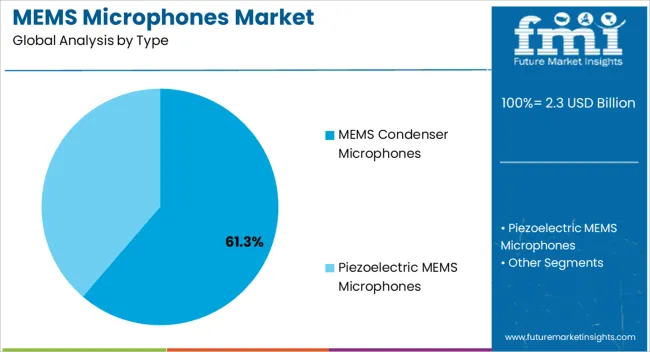
Piezoelectric provides a great SNR due to the usage of scandium-doped AIN film, which also benefits in sound dampening. Among the key roles of piezoelectric products is that they contribute to regular productivity and are significantly less prone to degradation even after extended use.
The piezoelectric market is expected to gain pace over the projected period due to the high demand for piezoelectric era-primarily based microphones to be employed in audio devices such as portable intelligent speakers and automotive infotainment systems. As a result, piezoelectric MEMS microphones are likely to increase rapidly in the future years.
SensiBel AS (Oslo, Norway), a startup developing MEMS microphones, has raised €15 million (roughly USD 16 million) in a funding round that was co-founded by Trumpf Ventures. Other investors included Skagerak Capital, Investinor, The European Council's EIC Fund, and SINTEF Venture IV.
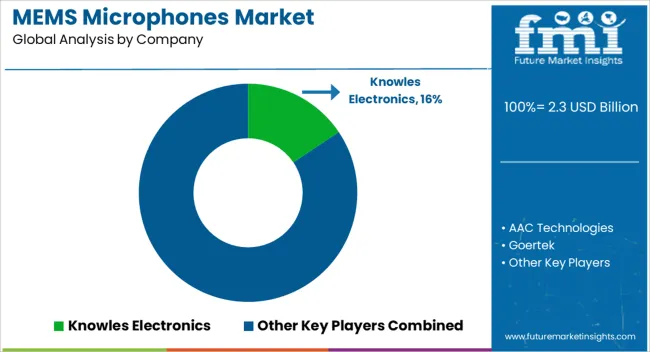
Some of the leading companies operating in the global MEMS microphones market include Knowles Electronics, LLC., AAC Technologies, Goertek, BSE Co., Ltd., STMicroelectronics, Analog Devices, Inc., Hosiden Corporation, Mouser Electronics, Inc., NeoMEMS Technologies Inc., and Akustica Inc.
There are few powerful players in the market, which is highly condensed. To stay competitive, the key players are focusing on investing in research and development activities and building partnerships with established companies. They are also developing their distribution strategies, which involve collaborating with distributors to reach a wider market.
Several manufacturers are also emphasizing extending their international networks of partners. This strategy is successful as it enables them to expand their market reach gradually. DB Unlimited signed distribution agreements with Symmetry Electronics and Master Electronics, while CUI Inc. signed an agreement with Arrow Electronics.
Report Attributes | Details |
---|---|
Growth Rate | CAGR of 15.5% from 2023 to 2033 |
MEMS Microphones Market Expected Market Value (2023) | USD 1,967.6 million |
MEMS Microphones Market Anticipated Forecast Value (2033) | USD 8,313.3 million |
Base Year for Estimation | 2022 |
Historical Data | 2018 to 2022 |
Forecast Period | 2023 to 2033 |
Quantitative Units | Revenue in USD million and CAGR from 2023 to 2033 |
Report Coverage | Revenue Forecast, Volume Forecast, Company Ranking, Competitive Landscape, Growth Factors, Trends, and Pricing Analysis |
Segments Covered | Type, Application, Region |
Regions Covered | North America; Latin America; Western Europe; Eastern Europe; South Asia & Pacific; East Asia; The Middle East & Africa (MEA) |
Key Countries Profiled | The United States, Canada, Brazil, Mexico, Germany, The United Kingdom, France, Spain, Italy, Poland, Russia, Czech Republic, Romania, India, Bangladesh, Australia, New Zealand, China, Japan, South Korea, GCC Countries, South Africa, Israel |
Key Companies Profiled | Knowles Electronics; LLC.; AAC Technologies; Goertek; BSE Co., Ltd.; STMicroelectronics; Analog Devices, Inc.; Hosiden Corporation; Mouser Electronics, Inc.; NeoMEMS Technologies Inc.; Akustica Inc. |
Customization | Available Upon Request |
Table 1: Global Market Value (US$ Million) Forecast by Region, 2018 to 2033
Table 2: Global Market Volume (Units) Forecast by Region, 2018 to 2033
Table 3: Global Market Value (US$ Million) Forecast by Type, 2018 to 2033
Table 4: Global Market Volume (Units) Forecast by Type, 2018 to 2033
Table 5: Global Market Value (US$ Million) Forecast by Application, 2018 to 2033
Table 6: Global Market Volume (Units) Forecast by Application, 2018 to 2033
Table 7: North America Market Value (US$ Million) Forecast by Country, 2018 to 2033
Table 8: North America Market Volume (Units) Forecast by Country, 2018 to 2033
Table 9: North America Market Value (US$ Million) Forecast by Type, 2018 to 2033
Table 10: North America Market Volume (Units) Forecast by Type, 2018 to 2033
Table 11: North America Market Value (US$ Million) Forecast by Application, 2018 to 2033
Table 12: North America Market Volume (Units) Forecast by Application, 2018 to 2033
Table 13: Latin America Market Value (US$ Million) Forecast by Country, 2018 to 2033
Table 14: Latin America Market Volume (Units) Forecast by Country, 2018 to 2033
Table 15: Latin America Market Value (US$ Million) Forecast by Type, 2018 to 2033
Table 16: Latin America Market Volume (Units) Forecast by Type, 2018 to 2033
Table 17: Latin America Market Value (US$ Million) Forecast by Application, 2018 to 2033
Table 18: Latin America Market Volume (Units) Forecast by Application, 2018 to 2033
Table 19: Western Europe Market Value (US$ Million) Forecast by Country, 2018 to 2033
Table 20: Western Europe Market Volume (Units) Forecast by Country, 2018 to 2033
Table 21: Western Europe Market Value (US$ Million) Forecast by Type, 2018 to 2033
Table 22: Western Europe Market Volume (Units) Forecast by Type, 2018 to 2033
Table 23: Western Europe Market Value (US$ Million) Forecast by Application, 2018 to 2033
Table 24: Western Europe Market Volume (Units) Forecast by Application, 2018 to 2033
Table 25: Eastern Europe Market Value (US$ Million) Forecast by Country, 2018 to 2033
Table 26: Eastern Europe Market Volume (Units) Forecast by Country, 2018 to 2033
Table 27: Eastern Europe Market Value (US$ Million) Forecast by Type, 2018 to 2033
Table 28: Eastern Europe Market Volume (Units) Forecast by Type, 2018 to 2033
Table 29: Eastern Europe Market Value (US$ Million) Forecast by Application, 2018 to 2033
Table 30: Eastern Europe Market Volume (Units) Forecast by Application, 2018 to 2033
Table 31: South Asia and Pacific Market Value (US$ Million) Forecast by Country, 2018 to 2033
Table 32: South Asia and Pacific Market Volume (Units) Forecast by Country, 2018 to 2033
Table 33: South Asia and Pacific Market Value (US$ Million) Forecast by Type, 2018 to 2033
Table 34: South Asia and Pacific Market Volume (Units) Forecast by Type, 2018 to 2033
Table 35: South Asia and Pacific Market Value (US$ Million) Forecast by Application, 2018 to 2033
Table 36: South Asia and Pacific Market Volume (Units) Forecast by Application, 2018 to 2033
Table 37: East Asia Market Value (US$ Million) Forecast by Country, 2018 to 2033
Table 38: East Asia Market Volume (Units) Forecast by Country, 2018 to 2033
Table 39: East Asia Market Value (US$ Million) Forecast by Type, 2018 to 2033
Table 40: East Asia Market Volume (Units) Forecast by Type, 2018 to 2033
Table 41: East Asia Market Value (US$ Million) Forecast by Application, 2018 to 2033
Table 42: East Asia Market Volume (Units) Forecast by Application, 2018 to 2033
Table 43: Middle East and Africa Market Value (US$ Million) Forecast by Country, 2018 to 2033
Table 44: Middle East and Africa Market Volume (Units) Forecast by Country, 2018 to 2033
Table 45: Middle East and Africa Market Value (US$ Million) Forecast by Type, 2018 to 2033
Table 46: Middle East and Africa Market Volume (Units) Forecast by Type, 2018 to 2033
Table 47: Middle East and Africa Market Value (US$ Million) Forecast by Application, 2018 to 2033
Table 48: Middle East and Africa Market Volume (Units) Forecast by Application, 2018 to 2033
Figure 1: Global Market Value (US$ Million) by Type, 2023 to 2033
Figure 2: Global Market Value (US$ Million) by Application, 2023 to 2033
Figure 3: Global Market Value (US$ Million) by Region, 2023 to 2033
Figure 4: Global Market Value (US$ Million) Analysis by Region, 2018 to 2033
Figure 5: Global Market Volume (Units) Analysis by Region, 2018 to 2033
Figure 6: Global Market Value Share (%) and BPS Analysis by Region, 2023 to 2033
Figure 7: Global Market Y-o-Y Growth (%) Projections by Region, 2023 to 2033
Figure 8: Global Market Value (US$ Million) Analysis by Type, 2018 to 2033
Figure 9: Global Market Volume (Units) Analysis by Type, 2018 to 2033
Figure 10: Global Market Value Share (%) and BPS Analysis by Type, 2023 to 2033
Figure 11: Global Market Y-o-Y Growth (%) Projections by Type, 2023 to 2033
Figure 12: Global Market Value (US$ Million) Analysis by Application, 2018 to 2033
Figure 13: Global Market Volume (Units) Analysis by Application, 2018 to 2033
Figure 14: Global Market Value Share (%) and BPS Analysis by Application, 2023 to 2033
Figure 15: Global Market Y-o-Y Growth (%) Projections by Application, 2023 to 2033
Figure 16: Global Market Attractiveness by Type, 2023 to 2033
Figure 17: Global Market Attractiveness by Application, 2023 to 2033
Figure 18: Global Market Attractiveness by Region, 2023 to 2033
Figure 19: North America Market Value (US$ Million) by Type, 2023 to 2033
Figure 20: North America Market Value (US$ Million) by Application, 2023 to 2033
Figure 21: North America Market Value (US$ Million) by Country, 2023 to 2033
Figure 22: North America Market Value (US$ Million) Analysis by Country, 2018 to 2033
Figure 23: North America Market Volume (Units) Analysis by Country, 2018 to 2033
Figure 24: North America Market Value Share (%) and BPS Analysis by Country, 2023 to 2033
Figure 25: North America Market Y-o-Y Growth (%) Projections by Country, 2023 to 2033
Figure 26: North America Market Value (US$ Million) Analysis by Type, 2018 to 2033
Figure 27: North America Market Volume (Units) Analysis by Type, 2018 to 2033
Figure 28: North America Market Value Share (%) and BPS Analysis by Type, 2023 to 2033
Figure 29: North America Market Y-o-Y Growth (%) Projections by Type, 2023 to 2033
Figure 30: North America Market Value (US$ Million) Analysis by Application, 2018 to 2033
Figure 31: North America Market Volume (Units) Analysis by Application, 2018 to 2033
Figure 32: North America Market Value Share (%) and BPS Analysis by Application, 2023 to 2033
Figure 33: North America Market Y-o-Y Growth (%) Projections by Application, 2023 to 2033
Figure 34: North America Market Attractiveness by Type, 2023 to 2033
Figure 35: North America Market Attractiveness by Application, 2023 to 2033
Figure 36: North America Market Attractiveness by Country, 2023 to 2033
Figure 37: Latin America Market Value (US$ Million) by Type, 2023 to 2033
Figure 38: Latin America Market Value (US$ Million) by Application, 2023 to 2033
Figure 39: Latin America Market Value (US$ Million) by Country, 2023 to 2033
Figure 40: Latin America Market Value (US$ Million) Analysis by Country, 2018 to 2033
Figure 41: Latin America Market Volume (Units) Analysis by Country, 2018 to 2033
Figure 42: Latin America Market Value Share (%) and BPS Analysis by Country, 2023 to 2033
Figure 43: Latin America Market Y-o-Y Growth (%) Projections by Country, 2023 to 2033
Figure 44: Latin America Market Value (US$ Million) Analysis by Type, 2018 to 2033
Figure 45: Latin America Market Volume (Units) Analysis by Type, 2018 to 2033
Figure 46: Latin America Market Value Share (%) and BPS Analysis by Type, 2023 to 2033
Figure 47: Latin America Market Y-o-Y Growth (%) Projections by Type, 2023 to 2033
Figure 48: Latin America Market Value (US$ Million) Analysis by Application, 2018 to 2033
Figure 49: Latin America Market Volume (Units) Analysis by Application, 2018 to 2033
Figure 50: Latin America Market Value Share (%) and BPS Analysis by Application, 2023 to 2033
Figure 51: Latin America Market Y-o-Y Growth (%) Projections by Application, 2023 to 2033
Figure 52: Latin America Market Attractiveness by Type, 2023 to 2033
Figure 53: Latin America Market Attractiveness by Application, 2023 to 2033
Figure 54: Latin America Market Attractiveness by Country, 2023 to 2033
Figure 55: Western Europe Market Value (US$ Million) by Type, 2023 to 2033
Figure 56: Western Europe Market Value (US$ Million) by Application, 2023 to 2033
Figure 57: Western Europe Market Value (US$ Million) by Country, 2023 to 2033
Figure 58: Western Europe Market Value (US$ Million) Analysis by Country, 2018 to 2033
Figure 59: Western Europe Market Volume (Units) Analysis by Country, 2018 to 2033
Figure 60: Western Europe Market Value Share (%) and BPS Analysis by Country, 2023 to 2033
Figure 61: Western Europe Market Y-o-Y Growth (%) Projections by Country, 2023 to 2033
Figure 62: Western Europe Market Value (US$ Million) Analysis by Type, 2018 to 2033
Figure 63: Western Europe Market Volume (Units) Analysis by Type, 2018 to 2033
Figure 64: Western Europe Market Value Share (%) and BPS Analysis by Type, 2023 to 2033
Figure 65: Western Europe Market Y-o-Y Growth (%) Projections by Type, 2023 to 2033
Figure 66: Western Europe Market Value (US$ Million) Analysis by Application, 2018 to 2033
Figure 67: Western Europe Market Volume (Units) Analysis by Application, 2018 to 2033
Figure 68: Western Europe Market Value Share (%) and BPS Analysis by Application, 2023 to 2033
Figure 69: Western Europe Market Y-o-Y Growth (%) Projections by Application, 2023 to 2033
Figure 70: Western Europe Market Attractiveness by Type, 2023 to 2033
Figure 71: Western Europe Market Attractiveness by Application, 2023 to 2033
Figure 72: Western Europe Market Attractiveness by Country, 2023 to 2033
Figure 73: Eastern Europe Market Value (US$ Million) by Type, 2023 to 2033
Figure 74: Eastern Europe Market Value (US$ Million) by Application, 2023 to 2033
Figure 75: Eastern Europe Market Value (US$ Million) by Country, 2023 to 2033
Figure 76: Eastern Europe Market Value (US$ Million) Analysis by Country, 2018 to 2033
Figure 77: Eastern Europe Market Volume (Units) Analysis by Country, 2018 to 2033
Figure 78: Eastern Europe Market Value Share (%) and BPS Analysis by Country, 2023 to 2033
Figure 79: Eastern Europe Market Y-o-Y Growth (%) Projections by Country, 2023 to 2033
Figure 80: Eastern Europe Market Value (US$ Million) Analysis by Type, 2018 to 2033
Figure 81: Eastern Europe Market Volume (Units) Analysis by Type, 2018 to 2033
Figure 82: Eastern Europe Market Value Share (%) and BPS Analysis by Type, 2023 to 2033
Figure 83: Eastern Europe Market Y-o-Y Growth (%) Projections by Type, 2023 to 2033
Figure 84: Eastern Europe Market Value (US$ Million) Analysis by Application, 2018 to 2033
Figure 85: Eastern Europe Market Volume (Units) Analysis by Application, 2018 to 2033
Figure 86: Eastern Europe Market Value Share (%) and BPS Analysis by Application, 2023 to 2033
Figure 87: Eastern Europe Market Y-o-Y Growth (%) Projections by Application, 2023 to 2033
Figure 88: Eastern Europe Market Attractiveness by Type, 2023 to 2033
Figure 89: Eastern Europe Market Attractiveness by Application, 2023 to 2033
Figure 90: Eastern Europe Market Attractiveness by Country, 2023 to 2033
Figure 91: South Asia and Pacific Market Value (US$ Million) by Type, 2023 to 2033
Figure 92: South Asia and Pacific Market Value (US$ Million) by Application, 2023 to 2033
Figure 93: South Asia and Pacific Market Value (US$ Million) by Country, 2023 to 2033
Figure 94: South Asia and Pacific Market Value (US$ Million) Analysis by Country, 2018 to 2033
Figure 95: South Asia and Pacific Market Volume (Units) Analysis by Country, 2018 to 2033
Figure 96: South Asia and Pacific Market Value Share (%) and BPS Analysis by Country, 2023 to 2033
Figure 97: South Asia and Pacific Market Y-o-Y Growth (%) Projections by Country, 2023 to 2033
Figure 98: South Asia and Pacific Market Value (US$ Million) Analysis by Type, 2018 to 2033
Figure 99: South Asia and Pacific Market Volume (Units) Analysis by Type, 2018 to 2033
Figure 100: South Asia and Pacific Market Value Share (%) and BPS Analysis by Type, 2023 to 2033
Figure 101: South Asia and Pacific Market Y-o-Y Growth (%) Projections by Type, 2023 to 2033
Figure 102: South Asia and Pacific Market Value (US$ Million) Analysis by Application, 2018 to 2033
Figure 103: South Asia and Pacific Market Volume (Units) Analysis by Application, 2018 to 2033
Figure 104: South Asia and Pacific Market Value Share (%) and BPS Analysis by Application, 2023 to 2033
Figure 105: South Asia and Pacific Market Y-o-Y Growth (%) Projections by Application, 2023 to 2033
Figure 106: South Asia and Pacific Market Attractiveness by Type, 2023 to 2033
Figure 107: South Asia and Pacific Market Attractiveness by Application, 2023 to 2033
Figure 108: South Asia and Pacific Market Attractiveness by Country, 2023 to 2033
Figure 109: East Asia Market Value (US$ Million) by Type, 2023 to 2033
Figure 110: East Asia Market Value (US$ Million) by Application, 2023 to 2033
Figure 111: East Asia Market Value (US$ Million) by Country, 2023 to 2033
Figure 112: East Asia Market Value (US$ Million) Analysis by Country, 2018 to 2033
Figure 113: East Asia Market Volume (Units) Analysis by Country, 2018 to 2033
Figure 114: East Asia Market Value Share (%) and BPS Analysis by Country, 2023 to 2033
Figure 115: East Asia Market Y-o-Y Growth (%) Projections by Country, 2023 to 2033
Figure 116: East Asia Market Value (US$ Million) Analysis by Type, 2018 to 2033
Figure 117: East Asia Market Volume (Units) Analysis by Type, 2018 to 2033
Figure 118: East Asia Market Value Share (%) and BPS Analysis by Type, 2023 to 2033
Figure 119: East Asia Market Y-o-Y Growth (%) Projections by Type, 2023 to 2033
Figure 120: East Asia Market Value (US$ Million) Analysis by Application, 2018 to 2033
Figure 121: East Asia Market Volume (Units) Analysis by Application, 2018 to 2033
Figure 122: East Asia Market Value Share (%) and BPS Analysis by Application, 2023 to 2033
Figure 123: East Asia Market Y-o-Y Growth (%) Projections by Application, 2023 to 2033
Figure 124: East Asia Market Attractiveness by Type, 2023 to 2033
Figure 125: East Asia Market Attractiveness by Application, 2023 to 2033
Figure 126: East Asia Market Attractiveness by Country, 2023 to 2033
Figure 127: Middle East and Africa Market Value (US$ Million) by Type, 2023 to 2033
Figure 128: Middle East and Africa Market Value (US$ Million) by Application, 2023 to 2033
Figure 129: Middle East and Africa Market Value (US$ Million) by Country, 2023 to 2033
Figure 130: Middle East and Africa Market Value (US$ Million) Analysis by Country, 2018 to 2033
Figure 131: Middle East and Africa Market Volume (Units) Analysis by Country, 2018 to 2033
Figure 132: Middle East and Africa Market Value Share (%) and BPS Analysis by Country, 2023 to 2033
Figure 133: Middle East and Africa Market Y-o-Y Growth (%) Projections by Country, 2023 to 2033
Figure 134: Middle East and Africa Market Value (US$ Million) Analysis by Type, 2018 to 2033
Figure 135: Middle East and Africa Market Volume (Units) Analysis by Type, 2018 to 2033
Figure 136: Middle East and Africa Market Value Share (%) and BPS Analysis by Type, 2023 to 2033
Figure 137: Middle East and Africa Market Y-o-Y Growth (%) Projections by Type, 2023 to 2033
Figure 138: Middle East and Africa Market Value (US$ Million) Analysis by Application, 2018 to 2033
Figure 139: Middle East and Africa Market Volume (Units) Analysis by Application, 2018 to 2033
Figure 140: Middle East and Africa Market Value Share (%) and BPS Analysis by Application, 2023 to 2033
Figure 141: Middle East and Africa Market Y-o-Y Growth (%) Projections by Application, 2023 to 2033
Figure 142: Middle East and Africa Market Attractiveness by Type, 2023 to 2033
Figure 143: Middle East and Africa Market Attractiveness by Application, 2023 to 2033
Figure 144: Middle East and Africa Market Attractiveness by Country, 2023 to 2033
The market was estimated to be around USD 1,703.6 million in 2022.
The increased adoption of mobile devices like smartphones, etc., drives the market.
Lack of capability to transfer high-power may hamper the market.
The market valuation is expected to be USD 8,313.3 million by 2033.
Asia Pacific dominates the MEMS Microphones Market.
Thank you!
You will receive an email from our Business Development Manager. Please be sure to check your SPAM/JUNK folder too.