Pressure-Controlled Vacuum Sealers Market Size and Share Forecast Outlook 2025 to 2035

The pressure-controlled vacuum sealers market is projected to grow from USD 3.1 billion in 2025 to USD 6.9 billion by 2035, registering a total gain of USD 3.8 billion over the forecast period. This reflects a 122.6% overall expansion, with the market achieving a compound annual growth rate (CAGR) of 8.3%. Over the ten-year span, the market is expected to grow by a 2.2 multiple.
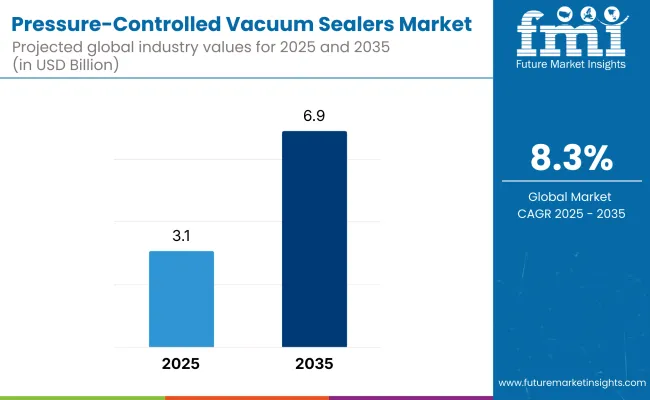
Quick Stats for Pressure-Controlled Vacuum Sealers Market

  • Market Value (2025): USD 3.1 billion
  • Market Forecast Value (2035): USD 6.9 billion
  • Market Forecast CAGR: 8.3%
  • Leading Segment in 2025: Single Chamber (43.8%)
  • Key Growth Regions: Europe (United Kingdom is the fastest-growing market with 9.2% CAGR)
  • Top Key Players: Avid ARMOR, VAC Master, AmeriVacS Manufacturing, Inc., PAC Machinery, , Bernhardt SAS, Boss Vakuum, PlexPackCorporation.

Pressure Controlled Vacuum Sealers Market

Metric Value
Estimated Value in (2025 E) USD 3.1 billion
Forecast Value in (2035 F) USD 6.9 billion
Forecast CAGR (2025 to 2035) 8.3%

In the first half of the decade (2025 to 2030), the market expands from USD 3.1 billion to USD 4.6 billion, contributing USD 1.5 billion, or 39.5% of the total decadal growth. This phase is driven by increased demand from premium food packaging, aerospace components, and medical devices, where pressure precision is critical for preserving product integrity. Bench-top and chamber sealers with programmable pressure control gain popularity due to their flexibility and reduced operator dependency.

In the second half (2030 to 2035), the market grows from USD 4.6 billion to USD 6.9 billion, contributing USD 2.3 billion, or 60.5% of the decade’s growth. Growth accelerates due to broader adoption in automated vacuum lines, pharmaceutical serialization, and high-value electronics, where real-time vacuum monitoring and dynamic pressure regulation are mandatory. Software-integrated sealers, IoT-enabled diagnostics, and compatibility with recyclable barrier materials drive significant value creation in this phase.

From 2020 to 2024, the pressure-controlled vacuum sealers market grew from USD 2.1 billion to USD 2.8 billion, driven by hardware-centric adoption in the food processing, pharmaceutical, and medical device packaging sectors, where precise air extraction and seal consistency are critical.

During this period, the competitive landscape was dominated by equipment manufacturers controlling nearly 70% of the revenue, with leaders such as Avid ARMOR, VAC Master, Nesco, and AmeriVacS Manufacturing, Inc. focusing on chamber-based and external vacuum systems with programmable pressure cycles.

Competitive differentiation relied on vacuum pressure precision, multi-bag compatibility, and hygienic design, while digital control modules were commonly bundled as auxiliary features rather than standalone revenue streams. Service-based models including calibration, seal testing, and maintenance subscriptions accounted for less than 10% of the market value, as end-users favored capital expenditure models.

Demand for pressure-controlled vacuum sealers will expand to USD 6.9 billion in 2035, and the revenue mix will shift as sensor-based monitoring, cloud integration, and aftermarket services grow to over 40% share. Traditional sealing equipment manufacturers face growing competition from automation-forward players offering smart diagnostics, adaptive pressure algorithms, and IoT-enabled dashboards.

Analyzing Pressure-Controlled Vacuum Sealers Market by Top Investment Segments

The market is segmented by chamber type, pressure control, sealing type, application, end-use industry, and region. Chamber type includes external vacuum, single chamber, double chamber, and inline conveyor systems, supporting varying throughput needs from low-volume operations to high-speed production lines. Pressure control segmentation features manual pressure setting, digital pressure programming, and sensor-driven adaptive control, enabling precise vacuum regulation for sensitive products and automated workflows.

Based on sealing type, the market includes single seal, double seal, and gas flush option configurations, ensuring extended shelf-life, leak prevention, and modified atmosphere packaging (MAP) compatibility. Application areas comprise perishables, medical instruments, and electronics packaging, where vacuum sealing enhances product protection, hygiene, and preservation.

End-use industries include food processing, pharma, electronics, and industrial tools, each with unique sealing standards and contamination control requirements. Regionally, the market is segmented into North America, Europe, Asia-Pacific, Latin America, and the Middle East & Africa.

Single Chamber Vacuum Sealers to Lead in Market Adoption Due to Compact Efficiency and Versatility

The single chamber segment is expected to account for the highest share of 43.8% in 2025 in the pressure-controlled vacuum sealers market. This dominance stems from the wide adoption of single chamber systems in small to mid-scale operations requiring precise vacuum pressure control with a compact footprint. These machines offer significant benefits including lower operational costs, simplified maintenance, and adjustable vacuum cycles that make them ideal for sealing delicate or perishable items under controlled pressure environments.

The popularity of single chamber vacuum sealers is particularly strong among small food processors, specialty meat packers, and contract manufacturers, where space efficiency and cost-to-performance ratio are crucial. Moreover, the integration of digital pressure sensors and programmable sealing profiles enhances the appeal of these systems in regulated industries like pharmaceuticals and high-end food production. As demand rises for precision vacuum packaging of both solid and liquid products, the single chamber format is expected to remain a top choice for its adaptability.
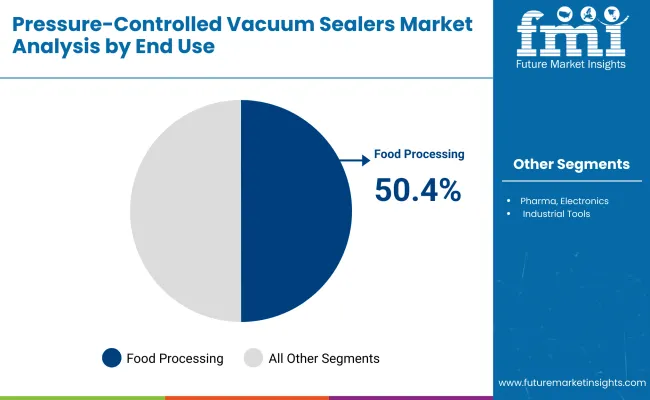
Food Processing Sector to Dominate Usage Amid Demand for Shelf Life Extension and Product Integrity

Pressure Controlled Vacuum Sealers Market By End Use

The food processing segment is projected to lead the end-use industry category with a 50.4% share in 2025, driven by the increasing need to extend product shelf life, minimize oxidation, and maintain hygienic standards. Vacuum sealing, particularly with pressure-controlled systems, is essential in meat, seafood, dairy, and processed food segments where packaging integrity directly impacts safety and freshness.

Adoption is further propelled by global regulatory mandates and consumer demand for preservative-free, vacuum-sealed products with clean-label attributes. Pressure-controlled sealers ensure consistent evacuation and sealing regardless of product volume or moisture levels, reducing the risk of contamination or spoilage.

These machines also support MAP (Modified Atmosphere Packaging) protocols, which are becoming standard in the chilled and frozen food sectors. With automation and digital control becoming essential in HACCP-compliant food plants, food processors are increasingly investing in pressure-controlled sealing systems to optimize throughput and maintain high quality assurance standards.
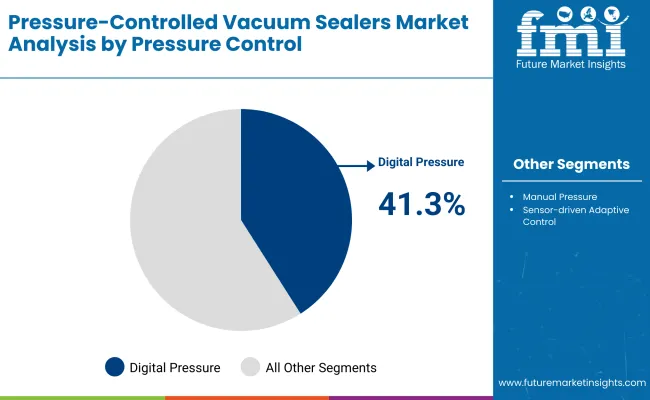
Digital Pressure Programming Gains Traction for Enhanced Vacuum Precision in Sealing Systems

Pressure Controlled Vacuum Sealers Market By Pressure Control

The digital pressure programming segment is expected to account for the highest share of 41.3% in 2025 in the pressure-controlled vacuum sealers market. This segment's rise is driven by manufacturers’ growing preference for programmable vacuum cycles that offer granular control over internal pressure settings. Such digital systems ensure uniformity across sealing runs, reduce human error, and are essential in sectors requiring high consistency, such as pharmaceuticals and precision food processing.

The growing shift toward automation and smart packaging systems has accelerated the adoption of digital interfaces that allow operators to store multiple pressure profiles and integrate quality assurance protocols.

Double Seal Format Preferred for Maximum Integrity in Vacuum Packaging Applications

The double seal segment is projected to lead the sealing type category with a 46.2% share in 2025. This growth is primarily attributed to the increasing demand for dual-bar or parallel seals that offer higher sealing strength, minimize leak risks, and improve protection against oxygen and moisture ingress. Particularly in vacuum applications, a double seal ensures redundancy and reduces rework or product loss due to seal failure.

Adopted widely in sectors such as industrial food packaging, pharmaceuticals, and vacuum-sealed electronics, the double seal format reinforces product shelf life and hygiene.

Perishable Goods Segment Leads Application Scope Due to Critical Shelf-Life Requirements

The perishables application segment is anticipated to hold a 42.1% share in 2025, making it the dominant end-use in the pressure-controlled vacuum sealers market. The consistent demand for extended shelf life, microbial safety, and oxygen reduction across food categories like meats, dairy, and seafood has driven adoption of vacuum sealing solutions tailored to perishable products.

Vacuum sealers with precise pressure control are instrumental in maintaining the integrity of perishable goods during distribution and cold chain logistics.

Why the Pressure-Controlled Vacuum Sealers Market is growing?

Rising demand for extended shelf life, airtight preservation, and precision-controlled packaging across food, pharmaceutical, and electronics sectors is driving the growth of the pressure-controlled vacuum sealers market. These sealers enable accurate pressure regulation during vacuum cycles, ensuring optimal removal of air without damaging delicate products. Growing focus on food waste reduction, freshness retention, and contamination prevention has accelerated their adoption in both industrial and commercial applications.

Programmable and sensor-based vacuum sealers have gained popularity due to their ability to monitor chamber pressure and adjust sealing parameters in real time. This ensures consistent seal quality, especially for moisture-rich or fragile items such as marinated proteins, medical devices, or microelectronic components. Integration with MAP (Modified Atmosphere Packaging) systems and hygienic design standards has further expanded their suitability in cleanroom and food-grade environments.

Industries such as meat processing, ready-to-eat meals, nutraceuticals, and semiconductor packaging are driving demand for machines that provide controlled vacuum profiles, reduce oxidation, and enable compliance with regulatory packaging norms. These sealers support quality assurance, traceability, and material cost savings through repeatable and uniform sealing processes.

What are the Drivers, Restraints, and Key Trends of the Pressure-Controlled Vacuum Sealers Market?

Equipment calibration sensitivity and high setup costs slow down wider deployment, even as demand rises in pharmaceuticals, food packaging, electronics, and aerospace for precision-sealing systems that ensure vacuum accuracy, extended shelf life, and product sterility.

Precision Sealing Demand in Regulated and High-value Packaging Applications

Pressure-controlled vacuum sealers are becoming critical in industries that require highly controlled packaging environments, such as pharmaceuticals, biotechnology, medical devices, and high-end food processing. These systems allow operators to precisely regulate pressure levels and vacuum duration during the sealing process, ensuring consistent pack quality, integrity, and sterility. In pharmaceutical blister packs or sterile barrier systems, exact vacuum profiles reduce the risk of microbial ingress and seal failure.

Calibration Complexity and Cost of System Ownership

Despite their performance benefits, pressure-controlled vacuum sealers face adoption barriers due to their technical sophistication and initial investment cost. Achieving and maintaining optimal vacuum profiles requires precision sensors, programmable logic controllers (PLCs), and high-end vacuum pumps driving up capital expenditure.

These systems also need routine calibration and validation, especially in pharmaceutical or aerospace settings where audit readiness is essential. operators must be trained to manage multiple sealing parameters, including vacuum levels, dwell time, and pressure differentials, increasing the learning curve.

Smart Sealing Interfaces and Multi-Recipe Programmable Systems Gaining Adoption

A key trend driving growth in this market is the integration of digital intelligence and recipe-based automation. Manufacturers are equipping vacuum sealers with touchscreen HMIs, pre-set packaging profiles, and IoT connectivity to enable remote diagnostics, real-time process monitoring, and batch traceability. These features improve user control, reduce human error, and support compliance with GMP and HACCP standards. Advanced systems now offer dual-chamber or impulse sealing options for multi-format adaptability.
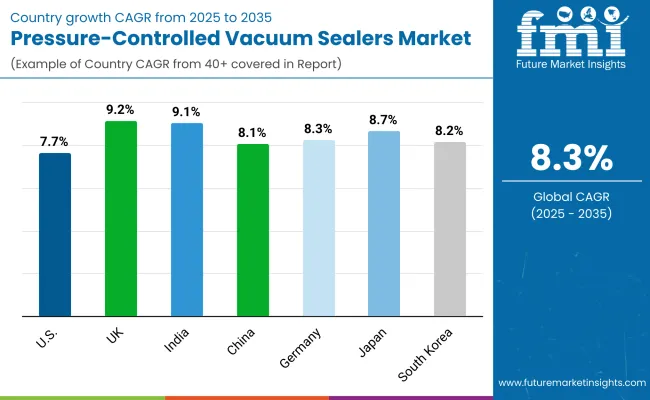
Analysis of Pressure-Controlled Vacuum Sealers Market by Key Countries

Pressure Controlled Vacuum Sealers Market Country Wise Analysis

Country CAGR
USA 7.7%
United Kingdom 9.2%
India 9.1%
China 8.1%
Germany 8.3%
Japan 8.7%
South Korea 8.2%

The global pressure-controlled vacuum sealers market is experiencing sustained growth due to rising demand for precision sealing, extended shelf life, and contamination-free storage across pharmaceuticals, diagnostics, perishable foods, and industrial packaging. These systems regulate vacuum pressure precisely to accommodate sensitive contents such as medical devices, electronics, and soft foods.

The UK and India lead in terms of growth due to pharma and diagnostics export packaging. Germany and Japan continue to adopt automated vacuum sealing within GMP-compliant cleanrooms. Meanwhile, China and South Korea are integrating pressure-sensitive vacuum units into high-speed industrial production. The USA market is focused on incorporating programmable pressure profiles and digital compliance features in pharma and electronics sealing.

Sales Outlook for Pressure-Controlled Vacuum Sealers United States

The USA market for pressure-controlled vacuum sealers is expected to grow at a CAGR of 7.7%, driven by stringent packaging compliance in medical and electronics sectors. These vacuum sealers offer programmable pressure settings and are essential in protecting sensitive devices from stress or oxygen ingress. American OEMs are embedding pressure monitoring sensors and integrating digital interfaces to log sealing events for CFR Part 11 compliance.

  • Medical device companies use vacuum sealers for precise pouch evacuations and controlled backflush cycles.
  • Electronics assemblers rely on vacuum regulation to avoid component deformation during moisture-proof packaging.
  • Automation vendors are integrating real-time pressure diagnostics and barcode tracking in sealing equipment.

Growth Outlook for Pressure-Controlled Vacuum Sealers United Kingdom

The UK market is projected to grow at a CAGR of 9.2%, the highest among developed economies, supported by demand for regulatory-compliant vacuum packaging in biopharma and pathology test kits. British diagnostic exporters are transitioning to pressure-controlled systems to ensure sterile barrier integrity during air transit and long-haul storage. Smart vacuum systems with pressure relief valves and safety seals are also gaining traction.

  • Pharmaceutical firms utilize vacuum sealers to meet MHRA and EU Annex 1 sealing requirements.
  • Diagnostic labs use controlled pressure cycles to preserve temperature-sensitive reagent kits.
  • OEMs are launching compact pressure-sealing units with USB data logging for validation audits.

Expansion Outlook for Pressure-Controlled Vacuum Sealers India

India’s pressure-controlled vacuum sealers market is forecast to grow at a CAGR of 9.1%, driven by increasing GMP compliance in pharma manufacturing, food exports, and medical kit assembly. These systems are being rapidly adopted by Indian exporters to extend shelf life and prevent contamination in sensitive product flows. Local manufacturers are developing cost-effective digital vacuum sealers for SMEs.

  • Pharma exporters install pressure-calibrated sealers for inhalers, injectables, and sterile pouches.
  • Food exporters use vacuum sealing for spice blends, seafood, and dehydrated meals under MAP formats.
  • Indian OEMs are bundling programmable pressure units with local PLC integration for MES compatibility.

Sales Outlook for Pressure-Controlled Vacuum Sealers China

The Chinese market is growing at a CAGR of 8.1%, fueled by fast-evolving industrial packaging standards, electronics manufacturing, and rapid foodservice digitization. Pressure-controlled vacuum sealers are used in applications where thermal stress, oxygen ingress, or seal distortion must be avoided. Chinese integrators are embedding these systems into semi-automated packaging lines across tier-1 and tier-2 cities.

  • Medical packaging plants apply vacuum sealers in negative-pressure cleanrooms for tubing and catheters.
  • Electronics manufacturers use precision-controlled sealing for battery cells, ICs, and sensors.
  • OEMs are scaling low-cost vacuum sealing modules with touchscreen HMIs and remote diagnostics.

Growth & Expansion of Pressure-Controlled Vacuum Sealers Germany

Germany’s market is projected to expand at a CAGR of 8.3%, owing to high-standard applications in biotechnology, diagnostics, and industrial precision parts packaging. German firms favor high-spec machines with dynamic pressure monitoring, data integrity logging, and contamination risk mitigation. Cleanroom-rated sealers are deployed widely in medical packaging under EU-MDR guidelines.

  • Life sciences firms use vacuum sealing to prevent airborne contamination and maintain sterility.
  • Precision parts manufacturers use variable pressure sealers for anti-static and corrosion-inhibited packaging.
  • Leading OEMs are launching modular sealers with real-time pressure feedback and audit trails.

Growth Trajectory for Pressure-Controlled Vacuum Sealers Japan

Japan’s pressure-controlled vacuum sealers market is projected to grow at a CAGR of 8.7%, driven by demand from ultra-clean electronics, biotech labs, and temperature-sensitive foods. Japanese manufacturers emphasize vacuum control accuracy and seal validation data logging. Consumer health and wellness products in soft packaging also benefit from controlled pressure sealing to preserve content integrity.

  • Semiconductor and sensor packagers apply vacuum sealing to maintain electrostatic protection and vacuum purity.
  • Japanese pharma companies seal diagnostics and drug delivery kits with monitored vacuum cycles.
  • Domestic brands adopt low-noise, precision-control sealers for in-house OTC and nutraceutical packaging.

Opportunity Analysis for Pressure-Controlled Vacuum Sealers South Korea

South Korea is witnessing 8.2% CAGR in pressure-controlled vacuum sealers adoption between 2025 and 2035. Exporters of medical consumables, batteries, and smart food kits are investing in advanced sealing systems. Korea’s smart factory initiatives and automated QMS adoption are creating demand for vacuum sealers with pressure feedback, traceable logs, and robotic compatibility.

  • Battery and capacitor plants use vacuum sealing to ensure electrolyte stability and moisture exclusion.
  • Medical device firms install pressure-sealing units for disposable kits and catheters.
  • Korean OEMs integrate HMI interfaces and IIoT sync to monitor pressure cycles in real-time.

Competitive Landscape of Pressure-Controlled Vacuum Sealers Market

The pressure-controlled vacuum sealers market is moderately fragmented, featuring consumer-grade appliance brands, industrial sealer manufacturers, and regional vacuum technology specialists serving food, pharma, electronics, and logistics industries.

Global leaders such as PAC Machinery, Bernhardt SAS, and Boss Vakuum hold significant market share, driven by precision-controlled vacuum cycles, robust chamber construction, and compliance with hygienic and industrial packaging standards. Their strategies increasingly emphasize programmable pressure sensors, gas-flush compatibility, and HACCP/ISO-certified sealing solutions tailored for bulk packaging and high-value perishables.

Established mid-sized players including Avid ARMOR, AmeriVacS Manufacturing, Inc., and PlexPack cater to medium-scale production environments with semi-automatic and automatic pressure-sensitive vacuum sealing units. These firms are expanding adoption through customizable seal bar widths, sensor-based sealing accuracy, and integration with MAP (Modified Atmosphere Packaging) and moisture-sensitive packaging systems.

Key Development of Pressure-Controlled Vacuum Sealers

  • 2024, PAC Machinery showcased its PVT Plus MED medical-grade vacuum sealer at PACK EXPO East, designated a “Top Medical Packaging Innovation.”
  • June 2025, Avid Armor released the A100 GEN 2, an upgraded version of its best-selling edge vacuum sealer. Key enhancements include a magnetized locking lid, stronger suction pump, industrial-grade stainless steel build, and pulse sealing mode.

Pressure-Controlled Vacuum Sealers Companies

  • Avid ARMOR
  • VAC Master
  • AmeriVacS Manufacturing, Inc.,
  • PAC Machinery
  • Bernhardt SAS
  • Boss Vakuum
  • PlexPack Corporation

Report Scope - Pressure-Controlled Vacuum Sealers Market

Item Value
Quantitative Units USD 3.1 Billion
By Chamber Type External Vacuum, Single Chamber, Double Chamber, and Inline Conveyor
By Pressure Control Manual Pressure Setting, Digital Pressure Programming, and Sensor-driven Adaptive Control
By Sealing Type Single Seal, Double Seal, and Gas Flush Option
By Application Perishables, Medical Instruments, and Electronics Packaging
By End-Use Industry Food Processing, Pharma, Electronics, and Industrial Tools
Key Companies Profiled Avid ARMOR, VAC Master, AmeriVacS Manufacturing, Inc., PAC Machinery, Bernhardt SAS, Boss Vakuum , and PlexPack Corporation
Additional Attributes Growing demand for adjustable pressure sealing in sensitive packaging, adoption of sensor-driven control for precision sealing in pharma and electronics, increasing use of gas flush to extend shelf life of perishables, integration of digital pressure programming for consistent seal quality, rising deployment in medical instrument sterilization packaging, demand from industrial tools packaging to prevent corrosion, strong uptake in double chamber systems for higher throughput, compact designs gaining popularity for small-scale processors, technological advancements in inline conveyor sealers for automation, and expanding adoption in North America and Western Europe driven by food safety and product integrity standards

Key Segments

By Chamber Type:

  • External Vacuum
  • Single Chamber
  • Double Chamber
  • Inline Conveyor

By Pressure Control:

  • Manual Pressure Setting
  • Digital Pressure Programming
  • Sensor-driven Adaptive Control

By Sealing Type:

  • Single Seal
  • Double Seal
  • Gas Flush Option

By Application:

  • Perishables
  • Medical Instruments
  • Electronics Packaging

By End-Use Industry:

  • Food Processing
  • Pharma
  • Electronics
  • Industrial Tools

By Region:

  • North America
  • Latin America
  • Europe
  • East Asia
  • South Asia
  • Oceania
  • MEA

Table of Content

  1. Executive Summary
    • Global Market Outlook
    • Demand-side Trends
    • Supply-side Trends
    • Technology Roadmap Analysis
    • Analysis and Recommendations
  2. Market Overview
    • Market Coverage / Taxonomy
    • Market Definition / Scope / Limitations
  3. Market Background
    • Market Dynamics
      • Drivers
      • Restraints
      • Opportunity
      • Trends
    • Scenario Forecast
      • Demand in Optimistic Scenario
      • Demand in Likely Scenario
      • Demand in Conservative Scenario
    • Opportunity Map Analysis
    • Product Life Cycle Analysis
    • Supply Chain Analysis
      • Supply Side Participants and their Roles
        • Producers
        • Mid-Level Participants (Traders/ Agents/ Brokers)
        • Wholesalers and Distributors
      • Value Added and Value Created at Node in the Supply Chain
      • List of Raw Material Suppliers
      • List of Existing and Potential Buyer’s
    • Investment Feasibility Matrix
    • Value Chain Analysis
      • Profit Margin Analysis
      • Wholesalers and Distributors
      • Retailers
    • PESTLE and Porter’s Analysis
    • Regulatory Landscape
      • By Key Regions
      • By Key Countries
    • Regional Parent Market Outlook
    • Production and Consumption Statistics
    • Import and Export Statistics
  4. Global Analysis 2020 to 2024 and Forecast, 2025 to 2035
    • Historical Market Size Value (USD Million) & Volume (Units) Analysis, 2020 to 2024
    • Current and Future Market Size Value (USD Million) & Volume (Units) Projections, 2025 to 2035
      • Y-o-Y Growth Trend Analysis
      • Absolute $ Opportunity Analysis
  5. Global Pricing Analysis 2020 to 2024 and Forecast 2025 to 2035
  6. Global Analysis 2020 to 2024 and Forecast 2025 to 2035, By Chamber Type
    • Introduction / Key Findings
    • Historical Market Size Value (USD Million) & Volume (Units) Analysis By Chamber Type, 2020 to 2024
    • Current and Future Market Size Value (USD Million) & Volume (Units) Analysis and Forecast By Chamber Type, 2025 to 2035
      • External Vacuum
      • Single Chamber
      • Double Chamber
      • Inline Conveyor
    • Y-o-Y Growth Trend Analysis By Chamber Type, 2020 to 2024
    • Absolute $ Opportunity Analysis By Chamber Type, 2025 to 2035
  7. Global Analysis 2020 to 2024 and Forecast 2025 to 2035, By Pressure Control
    • Introduction / Key Findings
    • Historical Market Size Value (USD Million) & Volume (Units) Analysis By Pressure Control, 2020 to 2024
    • Current and Future Market Size Value (USD Million) & Volume (Units) Analysis and Forecast By Pressure Control, 2025 to 2035
      • Manual Pressure Setting
      • Digital Pressure Programming
      • Sensor-driven Adaptive Control
    • Y-o-Y Growth Trend Analysis By Pressure Control, 2020 to 2024
    • Absolute $ Opportunity Analysis By Pressure Control, 2025 to 2035
  8. Global Analysis 2020 to 2024 and Forecast 2025 to 2035, By Sealing Type
    • Introduction / Key Findings
    • Historical Market Size Value (USD Million) & Volume (Units) Analysis By Sealing Type, 2020 to 2024
    • Current and Future Market Size Value (USD Million) & Volume (Units) Analysis and Forecast By Sealing Type, 2025 to 2035
      • Single Seal
      • Double Seal
      • Gas Flush Option
    • Y-o-Y Growth Trend Analysis By Sealing Type, 2020 to 2024
    • Absolute $ Opportunity Analysis By Sealing Type, 2025 to 2035
  9. Global Analysis 2020 to 2024 and Forecast 2025 to 2035, By Application
    • Introduction / Key Findings
    • Historical Market Size Value (USD Million) & Volume (Units) Analysis By Application, 2020 to 2024
    • Current and Future Market Size Value (USD Million) & Volume (Units) Analysis and Forecast By Application, 2025 to 2035
      • Perishables
      • Medical Instruments
      • Electronics Packaging
    • Y-o-Y Growth Trend Analysis By Application, 2020 to 2024
    • Absolute $ Opportunity Analysis By Application, 2025 to 2035
  10. Global Analysis 2020 to 2024 and Forecast 2025 to 2035, By End-Use Industry
    • Introduction / Key Findings
    • Historical Market Size Value (USD Million) & Volume (Units) Analysis By End-Use Industry, 2020 to 2024
    • Current and Future Market Size Value (USD Million) & Volume (Units) Analysis and Forecast By End-Use Industry, 2025 to 2035
      • Food Processing
      • Pharma
      • Electronics
      • Industrial Tools
    • Y-o-Y Growth Trend Analysis By End-Use Industry, 2020 to 2024
    • Absolute $ Opportunity Analysis By End-Use Industry, 2025 to 2035
  11. Global Analysis 2020 to 2024 and Forecast 2025 to 2035, By Region
    • Introduction
    • Historical Market Size Value (USD Million) & Volume (Units) Analysis By Region, 2020 to 2024
    • Current Market Size Value (USD Million) & Volume (Units) Analysis and Forecast By Region, 2025 to 2035
      • North America
      • Latin America
      • Europe
      • East Asia
      • South Asia
      • Oceania
      • MEA
    • Market Attractiveness Analysis By Region
  12. North America Analysis 2020 to 2024 and Forecast 2025 to 2035, By Country
    • Historical Market Size Value (USD Million) & Volume (Units) Trend Analysis By Market Taxonomy, 2020 to 2024
    • Market Size Value (USD Million) & Volume (Units) Forecast By Market Taxonomy, 2025 to 2035
      • By Country
        • USA
        • Canada
      • By Chamber Type
      • By Pressure Control
      • By Sealing Type
      • By Application
      • By End-Use Industry
    • Market Attractiveness Analysis
      • By Country
      • By Chamber Type
      • By Pressure Control
      • By Sealing Type
      • By Application
      • By End-Use Industry
    • Key Takeaways
  13. Latin America Analysis 2020 to 2024 and Forecast 2025 to 2035, By Country
    • Historical Market Size Value (USD Million) & Volume (Units) Trend Analysis By Market Taxonomy, 2020 to 2024
    • Market Size Value (USD Million) & Volume (Units) Forecast By Market Taxonomy, 2025 to 2035
      • By Country
        • Brazil
        • Mexico
        • Argentina
        • Chile
        • Peru
        • Rest of Latin America
      • By Chamber Type
      • By Pressure Control
      • By Sealing Type
      • By Application
      • By End-Use Industry
    • Market Attractiveness Analysis
      • By Country
      • By Chamber Type
      • By Pressure Control
      • By Sealing Type
      • By Application
      • By End-Use Industry
    • Key Takeaways
  14. Europe Analysis 2020 to 2024 and Forecast 2025 to 2035, By Country
    • Historical Market Size Value (USD Million) & Volume (Units) Trend Analysis By Market Taxonomy, 2020 to 2024
    • Market Size Value (USD Million) & Volume (Units) Forecast By Market Taxonomy, 2025 to 2035
      • By Country
        • Germany
        • Italy
        • France
        • UK
        • Spain
        • Russia
        • BENELUX
        • Rest of Europe
      • By Chamber Type
      • By Pressure Control
      • By Sealing Type
      • By Application
      • By End-Use Industry
    • Market Attractiveness Analysis
      • By Country
      • By Chamber Type
      • By Pressure Control
      • By Sealing Type
      • By Application
      • By End-Use Industry
    • Key Takeaways
  15. East Asia Analysis 2020 to 2024 and Forecast 2025 to 2035, By Country
    • Historical Market Size Value (USD Million) & Volume (Units) Trend Analysis By Market Taxonomy, 2020 to 2024
    • Market Size Value (USD Million) & Volume (Units) Forecast By Market Taxonomy, 2025 to 2035
      • By Country
        • China
        • Japan
        • South Korea
      • By Chamber Type
      • By Pressure Control
      • By Sealing Type
      • By Application
      • By End-Use Industry
    • Market Attractiveness Analysis
      • By Country
      • By Chamber Type
      • By Pressure Control
      • By Sealing Type
      • By Application
      • By End-Use Industry
    • Key Takeaways
  16. South Asia Analysis 2020 to 2024 and Forecast 2025 to 2035, By Country
    • Historical Market Size Value (USD Million) & Volume (Units) Trend Analysis By Market Taxonomy, 2020 to 2024
    • Market Size Value (USD Million) & Volume (Units) Forecast By Market Taxonomy, 2025 to 2035
      • By Country
        • India
        • Thailand
        • Malaysia
        • Indonesia
        • Rest of South Asia
      • By Chamber Type
      • By Pressure Control
      • By Sealing Type
      • By Application
      • By End-Use Industry
    • Market Attractiveness Analysis
      • By Country
      • By Chamber Type
      • By Pressure Control
      • By Sealing Type
      • By Application
      • By End-Use Industry
    • Key Takeaways
  17. Oceania Analysis 2020 to 2024 and Forecast 2025 to 2035, By Country
    • Historical Market Size Value (USD Million) & Volume (Units) Trend Analysis By Market Taxonomy, 2020 to 2024
    • Market Size Value (USD Million) & Volume (Units) Forecast By Market Taxonomy, 2025 to 2035
      • By Country
        • Australia
        • New Zealand
      • By Chamber Type
      • By Pressure Control
      • By Sealing Type
      • By Application
      • By End-Use Industry
    • Market Attractiveness Analysis
      • By Country
      • By Chamber Type
      • By Pressure Control
      • By Sealing Type
      • By Application
      • By End-Use Industry
    • Key Takeaways
  18. MEA Analysis 2020 to 2024 and Forecast 2025 to 2035, By Country
    • Historical Market Size Value (USD Million) & Volume (Units) Trend Analysis By Market Taxonomy, 2020 to 2024
    • Market Size Value (USD Million) & Volume (Units) Forecast By Market Taxonomy, 2025 to 2035
      • By Country
        • GCC
        • Rest of MEA
      • By Chamber Type
      • By Pressure Control
      • By Sealing Type
      • By Application
      • By End-Use Industry
    • Market Attractiveness Analysis
      • By Country
      • By Chamber Type
      • By Pressure Control
      • By Sealing Type
      • By Application
      • By End-Use Industry
    • Key Takeaways
  19. Key Countries Analysis
    • USA
      • Pricing Analysis
      • Market Share Analysis, 2024
        • By Chamber Type
        • By Pressure Control
        • By Sealing Type
        • By Application
        • By End-Use Industry
    • Canada
      • Pricing Analysis
      • Market Share Analysis, 2024
        • By Chamber Type
        • By Pressure Control
        • By Sealing Type
        • By Application
        • By End-Use Industry
    • Brazil
      • Pricing Analysis
      • Market Share Analysis, 2024
        • By Chamber Type
        • By Pressure Control
        • By Sealing Type
        • By Application
        • By End-Use Industry
    • Mexico
      • Pricing Analysis
      • Market Share Analysis, 2024
        • By Chamber Type
        • By Pressure Control
        • By Sealing Type
        • By Application
        • By End-Use Industry
    • Argentina
      • Pricing Analysis
      • Market Share Analysis, 2024
        • By Chamber Type
        • By Pressure Control
        • By Sealing Type
        • By Application
        • By End-Use Industry
  20. Market Structure Analysis
    • Competition Dashboard
    • Competition Benchmarking
    • Market Share Analysis of Top Players
      • By Regional
      • By Chamber Type
      • By Pressure Control
      • By Sealing Type
      • By Application
      • By End-Use Industry
  21. Competition Analysis
    • Competition Deep Dive
      • Avid ARMOR
        • Overview
        • Product Portfolio
        • Profitability by Market Segments (Product/Age /Sales Channel/Region)
        • Sales Footprint
        • Strategy Overview
          • Marketing Strategy
          • Product Strategy
          • Channel Strategy
      • VAC Master
        • Overview
        • Product Portfolio
        • Profitability by Market Segments (Product/Age /Sales Channel/Region)
        • Sales Footprint
        • Strategy Overview
          • Marketing Strategy
          • Product Strategy
          • Channel Strategy
      • Nesco
        • Overview
        • Product Portfolio
        • Profitability by Market Segments (Product/Age /Sales Channel/Region)
        • Sales Footprint
        • Strategy Overview
          • Marketing Strategy
          • Product Strategy
          • Channel Strategy
      • AmeriVacS Manufacturing, Inc.,
        • Overview
        • Product Portfolio
        • Profitability by Market Segments (Product/Age /Sales Channel/Region)
        • Sales Footprint
        • Strategy Overview
          • Marketing Strategy
          • Product Strategy
          • Channel Strategy
      • PAC Machinery
        • Overview
        • Product Portfolio
        • Profitability by Market Segments (Product/Age /Sales Channel/Region)
        • Sales Footprint
        • Strategy Overview
          • Marketing Strategy
          • Product Strategy
          • Channel Strategy
      • Weston Products, LLC
        • Overview
        • Product Portfolio
        • Profitability by Market Segments (Product/Age /Sales Channel/Region)
        • Sales Footprint
        • Strategy Overview
          • Marketing Strategy
          • Product Strategy
          • Channel Strategy
      • Bernhardt SAS
        • Overview
        • Product Portfolio
        • Profitability by Market Segments (Product/Age /Sales Channel/Region)
        • Sales Footprint
        • Strategy Overview
          • Marketing Strategy
          • Product Strategy
          • Channel Strategy
      • Boss Vakuum
        • Overview
        • Product Portfolio
        • Profitability by Market Segments (Product/Age /Sales Channel/Region)
        • Sales Footprint
        • Strategy Overview
          • Marketing Strategy
          • Product Strategy
          • Channel Strategy
      • PlexPack
        • Overview
        • Product Portfolio
        • Profitability by Market Segments (Product/Age /Sales Channel/Region)
        • Sales Footprint
        • Strategy Overview
          • Marketing Strategy
          • Product Strategy
          • Channel Strategy
  22. Assumptions & Acronyms Used
  23. Research Methodology

List of Tables

  • Table 1: Global Value (USD Million) Forecast by Region, 2020-2035
  • Table 2: Global Volume (Units) Forecast by Region, 2020-2035
  • Table 3: Global Value (USD Million) Forecast by By Chamber Type, 2020-2035
  • Table 4: Global Volume (Units) Forecast by By Chamber Type, 2020-2035
  • Table 5: Global Value (USD Million) Forecast by By Pressure Control, 2020-2035
  • Table 6: Global Volume (Units) Forecast by By Pressure Control, 2020-2035
  • Table 7: Global Value (USD Million) Forecast by By Sealing Type, 2020-2035
  • Table 8: Global Volume (Units) Forecast by By Sealing Type, 2020-2035
  • Table 9: Global Value (USD Million) Forecast by By Application, 2020-2035
  • Table 10: Global Volume (Units) Forecast by By Application, 2020-2035
  • Table 11: Global Value (USD Million) Forecast by By End-Use Industry, 2020-2035
  • Table 12: Global Volume (Units) Forecast by By End-Use Industry, 2020-2035
  • Table 13: North America Value (USD Million) Forecast by Country, 2020-2035
  • Table 14: North America Volume (Units) Forecast by Country, 2020-2035
  • Table 15: North America Value (USD Million) Forecast by By Chamber Type, 2020-2035
  • Table 16: North America Volume (Units) Forecast by By Chamber Type, 2020-2035
  • Table 17: North America Value (USD Million) Forecast by By Pressure Control, 2020-2035
  • Table 18: North America Volume (Units) Forecast by By Pressure Control, 2020-2035
  • Table 19: North America Value (USD Million) Forecast by By Sealing Type, 2020-2035
  • Table 20: North America Volume (Units) Forecast by By Sealing Type, 2020-2035
  • Table 21: North America Value (USD Million) Forecast by By Application, 2020-2035
  • Table 22: North America Volume (Units) Forecast by By Application, 2020-2035
  • Table 23: North America Value (USD Million) Forecast by By End-Use Industry, 2020-2035
  • Table 24: North America Volume (Units) Forecast by By End-Use Industry, 2020-2035
  • Table 25: Latin America Value (USD Million) Forecast by Country, 2020-2035
  • Table 26: Latin America Volume (Units) Forecast by Country, 2020-2035
  • Table 27: Latin America Value (USD Million) Forecast by By Chamber Type, 2020-2035
  • Table 28: Latin America Volume (Units) Forecast by By Chamber Type, 2020-2035
  • Table 29: Latin America Value (USD Million) Forecast by By Pressure Control, 2020-2035
  • Table 30: Latin America Volume (Units) Forecast by By Pressure Control, 2020-2035
  • Table 31: Latin America Value (USD Million) Forecast by By Sealing Type, 2020-2035
  • Table 32: Latin America Volume (Units) Forecast by By Sealing Type, 2020-2035
  • Table 33: Latin America Value (USD Million) Forecast by By Application, 2020-2035
  • Table 34: Latin America Volume (Units) Forecast by By Application, 2020-2035
  • Table 35: Latin America Value (USD Million) Forecast by By End-Use Industry, 2020-2035
  • Table 36: Latin America Volume (Units) Forecast by By End-Use Industry, 2020-2035
  • Table 37: Europe Value (USD Million) Forecast by Country, 2020-2035
  • Table 38: Europe Volume (Units) Forecast by Country, 2020-2035
  • Table 39: Europe Value (USD Million) Forecast by By Chamber Type, 2020-2035
  • Table 40: Europe Volume (Units) Forecast by By Chamber Type, 2020-2035
  • Table 41: Europe Value (USD Million) Forecast by By Pressure Control, 2020-2035
  • Table 42: Europe Volume (Units) Forecast by By Pressure Control, 2020-2035
  • Table 43: Europe Value (USD Million) Forecast by By Sealing Type, 2020-2035
  • Table 44: Europe Volume (Units) Forecast by By Sealing Type, 2020-2035
  • Table 45: Europe Value (USD Million) Forecast by By Application, 2020-2035
  • Table 46: Europe Volume (Units) Forecast by By Application, 2020-2035
  • Table 47: Europe Value (USD Million) Forecast by By End-Use Industry, 2020-2035
  • Table 48: Europe Volume (Units) Forecast by By End-Use Industry, 2020-2035
  • Table 49: East Asia Value (USD Million) Forecast by Country, 2020-2035
  • Table 50: East Asia Volume (Units) Forecast by Country, 2020-2035
  • Table 51: East Asia Value (USD Million) Forecast by By Chamber Type, 2020-2035
  • Table 52: East Asia Volume (Units) Forecast by By Chamber Type, 2020-2035
  • Table 53: East Asia Value (USD Million) Forecast by By Pressure Control, 2020-2035
  • Table 54: East Asia Volume (Units) Forecast by By Pressure Control, 2020-2035
  • Table 55: East Asia Value (USD Million) Forecast by By Sealing Type, 2020-2035
  • Table 56: East Asia Volume (Units) Forecast by By Sealing Type, 2020-2035
  • Table 57: East Asia Value (USD Million) Forecast by By Application, 2020-2035
  • Table 58: East Asia Volume (Units) Forecast by By Application, 2020-2035
  • Table 59: East Asia Value (USD Million) Forecast by By End-Use Industry, 2020-2035
  • Table 60: East Asia Volume (Units) Forecast by By End-Use Industry, 2020-2035
  • Table 61: South Asia Value (USD Million) Forecast by Country, 2020-2035
  • Table 62: South Asia Volume (Units) Forecast by Country, 2020-2035
  • Table 63: South Asia Value (USD Million) Forecast by By Chamber Type, 2020-2035
  • Table 64: South Asia Volume (Units) Forecast by By Chamber Type, 2020-2035
  • Table 65: South Asia Value (USD Million) Forecast by By Pressure Control, 2020-2035
  • Table 66: South Asia Volume (Units) Forecast by By Pressure Control, 2020-2035
  • Table 67: South Asia Value (USD Million) Forecast by By Sealing Type, 2020-2035
  • Table 68: South Asia Volume (Units) Forecast by By Sealing Type, 2020-2035
  • Table 69: South Asia Value (USD Million) Forecast by By Application, 2020-2035
  • Table 70: South Asia Volume (Units) Forecast by By Application, 2020-2035
  • Table 71: South Asia Value (USD Million) Forecast by By End-Use Industry, 2020-2035
  • Table 72: South Asia Volume (Units) Forecast by By End-Use Industry, 2020-2035
  • Table 73: Oceania Value (USD Million) Forecast by Country, 2020-2035
  • Table 74: Oceania Volume (Units) Forecast by Country, 2020-2035
  • Table 75: Oceania Value (USD Million) Forecast by By Chamber Type, 2020-2035
  • Table 76: Oceania Volume (Units) Forecast by By Chamber Type, 2020-2035
  • Table 77: Oceania Value (USD Million) Forecast by By Pressure Control, 2020-2035
  • Table 78: Oceania Volume (Units) Forecast by By Pressure Control, 2020-2035
  • Table 79: Oceania Value (USD Million) Forecast by By Sealing Type, 2020-2035
  • Table 80: Oceania Volume (Units) Forecast by By Sealing Type, 2020-2035
  • Table 81: Oceania Value (USD Million) Forecast by By Application, 2020-2035
  • Table 82: Oceania Volume (Units) Forecast by By Application, 2020-2035
  • Table 83: Oceania Value (USD Million) Forecast by By End-Use Industry, 2020-2035
  • Table 84: Oceania Volume (Units) Forecast by By End-Use Industry, 2020-2035
  • Table 85: MEA Value (USD Million) Forecast by Country, 2020-2035
  • Table 86: MEA Volume (Units) Forecast by Country, 2020-2035
  • Table 87: MEA Value (USD Million) Forecast by By Chamber Type, 2020-2035
  • Table 88: MEA Volume (Units) Forecast by By Chamber Type, 2020-2035
  • Table 89: MEA Value (USD Million) Forecast by By Pressure Control, 2020-2035
  • Table 90: MEA Volume (Units) Forecast by By Pressure Control, 2020-2035
  • Table 91: MEA Value (USD Million) Forecast by By Sealing Type, 2020-2035
  • Table 92: MEA Volume (Units) Forecast by By Sealing Type, 2020-2035
  • Table 93: MEA Value (USD Million) Forecast by By Application, 2020-2035
  • Table 94: MEA Volume (Units) Forecast by By Application, 2020-2035
  • Table 95: MEA Value (USD Million) Forecast by By End-Use Industry, 2020-2035
  • Table 96: MEA Volume (Units) Forecast by By End-Use Industry, 2020-2035

List of Figures

  • Figure 1: Global Volume (Units) Forecast 2020-2035
  • Figure 2: Global Pricing Analysis
  • Figure 3: Global Value (USD Million) Forecast 2020-2035
  • Figure 4: Global Value Share and BPS Analysis by By Chamber Type, 2025 and 2035
  • Figure 5: Global Y-o-Y Growth Comparison by By Chamber Type, 2025-2035
  • Figure 6: Global Attractiveness Analysis by By Chamber Type
  • Figure 7: Global Value Share and BPS Analysis by By Pressure Control, 2025 and 2035
  • Figure 8: Global Y-o-Y Growth Comparison by By Pressure Control, 2025-2035
  • Figure 9: Global Attractiveness Analysis by By Pressure Control
  • Figure 10: Global Value Share and BPS Analysis by By Sealing Type, 2025 and 2035
  • Figure 11: Global Y-o-Y Growth Comparison by By Sealing Type, 2025-2035
  • Figure 12: Global Attractiveness Analysis by By Sealing Type
  • Figure 13: Global Value Share and BPS Analysis by By Application, 2025 and 2035
  • Figure 14: Global Y-o-Y Growth Comparison by By Application, 2025-2035
  • Figure 15: Global Attractiveness Analysis by By Application
  • Figure 16: Global Value Share and BPS Analysis by By End-Use Industry, 2025 and 2035
  • Figure 17: Global Y-o-Y Growth Comparison by By End-Use Industry, 2025-2035
  • Figure 18: Global Attractiveness Analysis by By End-Use Industry
  • Figure 19: Global Value (USD Million) Share and BPS Analysis by Region, 2025 and 2035
  • Figure 20: Global Y-o-Y Growth Comparison by Region, 2025-2035
  • Figure 21: Global Attractiveness Analysis by Region
  • Figure 22: North America Incremental $ Opportunity, 2025-2035
  • Figure 23: Latin America Incremental $ Opportunity, 2025-2035
  • Figure 24: Europe Incremental $ Opportunity, 2025-2035
  • Figure 25: East Asia Incremental $ Opportunity, 2025-2035
  • Figure 26: South Asia Incremental $ Opportunity, 2025-2035
  • Figure 27: Oceania Incremental $ Opportunity, 2025-2035
  • Figure 28: MEA Incremental $ Opportunity, 2025-2035
  • Figure 29: North America Value Share and BPS Analysis by Country, 2025 and 2035
  • Figure 30: North America Value Share and BPS Analysis by By Chamber Type, 2025 and 2035
  • Figure 31: North America Y-o-Y Growth Comparison by By Chamber Type, 2025-2035
  • Figure 32: North America Attractiveness Analysis by By Chamber Type
  • Figure 33: North America Value Share and BPS Analysis by By Pressure Control, 2025 and 2035
  • Figure 34: North America Y-o-Y Growth Comparison by By Pressure Control, 2025-2035
  • Figure 35: North America Attractiveness Analysis by By Pressure Control
  • Figure 36: North America Value Share and BPS Analysis by By Sealing Type, 2025 and 2035
  • Figure 37: North America Y-o-Y Growth Comparison by By Sealing Type, 2025-2035
  • Figure 38: North America Attractiveness Analysis by By Sealing Type
  • Figure 39: North America Value Share and BPS Analysis by By Application, 2025 and 2035
  • Figure 40: North America Y-o-Y Growth Comparison by By Application, 2025-2035
  • Figure 41: North America Attractiveness Analysis by By Application
  • Figure 42: North America Value Share and BPS Analysis by By End-Use Industry, 2025 and 2035
  • Figure 43: North America Y-o-Y Growth Comparison by By End-Use Industry, 2025-2035
  • Figure 44: North America Attractiveness Analysis by By End-Use Industry
  • Figure 45: Latin America Value Share and BPS Analysis by Country, 2025 and 2035
  • Figure 46: Latin America Value Share and BPS Analysis by By Chamber Type, 2025 and 2035
  • Figure 47: Latin America Y-o-Y Growth Comparison by By Chamber Type, 2025-2035
  • Figure 48: Latin America Attractiveness Analysis by By Chamber Type
  • Figure 49: Latin America Value Share and BPS Analysis by By Pressure Control, 2025 and 2035
  • Figure 50: Latin America Y-o-Y Growth Comparison by By Pressure Control, 2025-2035
  • Figure 51: Latin America Attractiveness Analysis by By Pressure Control
  • Figure 52: Latin America Value Share and BPS Analysis by By Sealing Type, 2025 and 2035
  • Figure 53: Latin America Y-o-Y Growth Comparison by By Sealing Type, 2025-2035
  • Figure 54: Latin America Attractiveness Analysis by By Sealing Type
  • Figure 55: Latin America Value Share and BPS Analysis by By Application, 2025 and 2035
  • Figure 56: Latin America Y-o-Y Growth Comparison by By Application, 2025-2035
  • Figure 57: Latin America Attractiveness Analysis by By Application
  • Figure 58: Latin America Value Share and BPS Analysis by By End-Use Industry, 2025 and 2035
  • Figure 59: Latin America Y-o-Y Growth Comparison by By End-Use Industry, 2025-2035
  • Figure 60: Latin America Attractiveness Analysis by By End-Use Industry
  • Figure 61: Europe Value Share and BPS Analysis by Country, 2025 and 2035
  • Figure 62: Europe Value Share and BPS Analysis by By Chamber Type, 2025 and 2035
  • Figure 63: Europe Y-o-Y Growth Comparison by By Chamber Type, 2025-2035
  • Figure 64: Europe Attractiveness Analysis by By Chamber Type
  • Figure 65: Europe Value Share and BPS Analysis by By Pressure Control, 2025 and 2035
  • Figure 66: Europe Y-o-Y Growth Comparison by By Pressure Control, 2025-2035
  • Figure 67: Europe Attractiveness Analysis by By Pressure Control
  • Figure 68: Europe Value Share and BPS Analysis by By Sealing Type, 2025 and 2035
  • Figure 69: Europe Y-o-Y Growth Comparison by By Sealing Type, 2025-2035
  • Figure 70: Europe Attractiveness Analysis by By Sealing Type
  • Figure 71: Europe Value Share and BPS Analysis by By Application, 2025 and 2035
  • Figure 72: Europe Y-o-Y Growth Comparison by By Application, 2025-2035
  • Figure 73: Europe Attractiveness Analysis by By Application
  • Figure 74: Europe Value Share and BPS Analysis by By End-Use Industry, 2025 and 2035
  • Figure 75: Europe Y-o-Y Growth Comparison by By End-Use Industry, 2025-2035
  • Figure 76: Europe Attractiveness Analysis by By End-Use Industry
  • Figure 77: East Asia Value Share and BPS Analysis by Country, 2025 and 2035
  • Figure 78: East Asia Value Share and BPS Analysis by By Chamber Type, 2025 and 2035
  • Figure 79: East Asia Y-o-Y Growth Comparison by By Chamber Type, 2025-2035
  • Figure 80: East Asia Attractiveness Analysis by By Chamber Type
  • Figure 81: East Asia Value Share and BPS Analysis by By Pressure Control, 2025 and 2035
  • Figure 82: East Asia Y-o-Y Growth Comparison by By Pressure Control, 2025-2035
  • Figure 83: East Asia Attractiveness Analysis by By Pressure Control
  • Figure 84: East Asia Value Share and BPS Analysis by By Sealing Type, 2025 and 2035
  • Figure 85: East Asia Y-o-Y Growth Comparison by By Sealing Type, 2025-2035
  • Figure 86: East Asia Attractiveness Analysis by By Sealing Type
  • Figure 87: East Asia Value Share and BPS Analysis by By Application, 2025 and 2035
  • Figure 88: East Asia Y-o-Y Growth Comparison by By Application, 2025-2035
  • Figure 89: East Asia Attractiveness Analysis by By Application
  • Figure 90: East Asia Value Share and BPS Analysis by By End-Use Industry, 2025 and 2035
  • Figure 91: East Asia Y-o-Y Growth Comparison by By End-Use Industry, 2025-2035
  • Figure 92: East Asia Attractiveness Analysis by By End-Use Industry
  • Figure 93: South Asia Value Share and BPS Analysis by Country, 2025 and 2035
  • Figure 94: South Asia Value Share and BPS Analysis by By Chamber Type, 2025 and 2035
  • Figure 95: South Asia Y-o-Y Growth Comparison by By Chamber Type, 2025-2035
  • Figure 96: South Asia Attractiveness Analysis by By Chamber Type
  • Figure 97: South Asia Value Share and BPS Analysis by By Pressure Control, 2025 and 2035
  • Figure 98: South Asia Y-o-Y Growth Comparison by By Pressure Control, 2025-2035
  • Figure 99: South Asia Attractiveness Analysis by By Pressure Control
  • Figure 100: South Asia Value Share and BPS Analysis by By Sealing Type, 2025 and 2035
  • Figure 101: South Asia Y-o-Y Growth Comparison by By Sealing Type, 2025-2035
  • Figure 102: South Asia Attractiveness Analysis by By Sealing Type
  • Figure 103: South Asia Value Share and BPS Analysis by By Application, 2025 and 2035
  • Figure 104: South Asia Y-o-Y Growth Comparison by By Application, 2025-2035
  • Figure 105: South Asia Attractiveness Analysis by By Application
  • Figure 106: South Asia Value Share and BPS Analysis by By End-Use Industry, 2025 and 2035
  • Figure 107: South Asia Y-o-Y Growth Comparison by By End-Use Industry, 2025-2035
  • Figure 108: South Asia Attractiveness Analysis by By End-Use Industry
  • Figure 109: Oceania Value Share and BPS Analysis by Country, 2025 and 2035
  • Figure 110: Oceania Value Share and BPS Analysis by By Chamber Type, 2025 and 2035
  • Figure 111: Oceania Y-o-Y Growth Comparison by By Chamber Type, 2025-2035
  • Figure 112: Oceania Attractiveness Analysis by By Chamber Type
  • Figure 113: Oceania Value Share and BPS Analysis by By Pressure Control, 2025 and 2035
  • Figure 114: Oceania Y-o-Y Growth Comparison by By Pressure Control, 2025-2035
  • Figure 115: Oceania Attractiveness Analysis by By Pressure Control
  • Figure 116: Oceania Value Share and BPS Analysis by By Sealing Type, 2025 and 2035
  • Figure 117: Oceania Y-o-Y Growth Comparison by By Sealing Type, 2025-2035
  • Figure 118: Oceania Attractiveness Analysis by By Sealing Type
  • Figure 119: Oceania Value Share and BPS Analysis by By Application, 2025 and 2035
  • Figure 120: Oceania Y-o-Y Growth Comparison by By Application, 2025-2035
  • Figure 121: Oceania Attractiveness Analysis by By Application
  • Figure 122: Oceania Value Share and BPS Analysis by By End-Use Industry, 2025 and 2035
  • Figure 123: Oceania Y-o-Y Growth Comparison by By End-Use Industry, 2025-2035
  • Figure 124: Oceania Attractiveness Analysis by By End-Use Industry
  • Figure 125: MEA Value Share and BPS Analysis by Country, 2025 and 2035
  • Figure 126: MEA Value Share and BPS Analysis by By Chamber Type, 2025 and 2035
  • Figure 127: MEA Y-o-Y Growth Comparison by By Chamber Type, 2025-2035
  • Figure 128: MEA Attractiveness Analysis by By Chamber Type
  • Figure 129: MEA Value Share and BPS Analysis by By Pressure Control, 2025 and 2035
  • Figure 130: MEA Y-o-Y Growth Comparison by By Pressure Control, 2025-2035
  • Figure 131: MEA Attractiveness Analysis by By Pressure Control
  • Figure 132: MEA Value Share and BPS Analysis by By Sealing Type, 2025 and 2035
  • Figure 133: MEA Y-o-Y Growth Comparison by By Sealing Type, 2025-2035
  • Figure 134: MEA Attractiveness Analysis by By Sealing Type
  • Figure 135: MEA Value Share and BPS Analysis by By Application, 2025 and 2035
  • Figure 136: MEA Y-o-Y Growth Comparison by By Application, 2025-2035
  • Figure 137: MEA Attractiveness Analysis by By Application
  • Figure 138: MEA Value Share and BPS Analysis by By End-Use Industry, 2025 and 2035
  • Figure 139: MEA Y-o-Y Growth Comparison by By End-Use Industry, 2025-2035
  • Figure 140: MEA Attractiveness Analysis by By End-Use Industry
  • Figure 141: Global - Tier Structure Analysis
  • Figure 142: Global - Company Share Analysis

Frequently Asked Questions

How big is the pressure-controlled vacuum sealers market in 2025?

The global pressure-controlled vacuum sealers market is estimated to be valued at USD 3.1 billion in 2025.

What will be the size of the pressure-controlled vacuum sealers market in 2035?

The market size for the pressure-controlled vacuum sealers market is projected to reach USD 6.9 billion by 2035.

How much will be the pressure-controlled vacuum sealers market growth between 2025 and 2035?

The pressure-controlled vacuum sealers market is expected to grow at a CAGR of 8.3% between 2025 and 2035.

What are the key product types in the pressure-controlled vacuum sealers market?

The key product types in the pressure-controlled vacuum sealers market include single chamber sealers, double chamber sealers, external vacuum sealers, and belt-type continuous vacuum sealers.

Which product segment is expected to contribute significant share in the pressure-controlled vacuum sealers market in 2025?

In terms of product type, the single chamber segment is expected to account for the highest share of 43.8% in the pressure-controlled vacuum sealers market in 2025.

Explore Similar Insights

Future Market Insights

Pressure-Controlled Vacuum Sealers Market