Vacuum Fiber Feedthrough Flanges Market Forecast and Outlook 2025 to 2035

The global vacuum fiber feedthrough flanges market is valued at USD 84.8 million in 2025. It is slated to reach USD 133 million by 2035, recording an absolute increase of USD 48.2 million over the forecast period. This translates into a total growth of 56.8%, with the market forecast to expand at a compound annual growth rate (CAGR) of 4.6% between 2025 and 2035. The overall market size is expected to grow by nearly 1.57X during the same period, supported by increasing demand for precision vacuum components in semiconductor manufacturing and advanced research applications, growing adoption of fiber optic sensing systems in controlled environments, and rising emphasis on hermetic sealing solutions that maintain vacuum integrity across diverse medical equipment, aerospace, and scientific instrumentation applications.

Between 2025 and 2030, the vacuum fiber feedthrough flanges market is projected to expand from USD 84.8 million to USD 106.2 million, resulting in a value increase of USD 21.4 million, which represents 44.4% of the total forecast growth for the decade. This phase of development will be shaped by increasing semiconductor fabrication capacity expansion requiring vacuum chamber instrumentation, rising adoption of fiber optic monitoring systems in medical devices, and growing utilization of vacuum feedthrough technologies in aerospace testing facilities. Equipment manufacturers and research institutions are expanding their vacuum system capabilities to address the growing demand for reliable fiber transmission solutions that ensure signal integrity and environmental isolation while meeting stringent contamination control requirements.

Quick Stats for Vacuum Fiber Feedthrough Flanges Market

  • Vacuum Fiber Feedthrough Flanges Market Value (2025): USD 84.8 million
  • Vacuum Fiber Feedthrough Flanges Market Forecast Value (2035): USD 133 million
  • Vacuum Fiber Feedthrough Flanges Market Forecast CAGR: 4.6%
  • Leading Product Type in Vacuum Fiber Feedthrough Flanges Market: Standard Type
  • Key Growth Regions in Vacuum Fiber Feedthrough Flanges Market: East Asia, Europe, and North America
  • Key Players in Vacuum Fiber Feedthrough Flanges Market: Thorlabs, Diamond SA, SQS, Hositrad, Engionic

Vacuum Fiber Feedthrough Flanges Market Market Value Analysis

From 2030 to 2035, the market is forecast to grow from USD 106.2 million to USD 133 million, adding another USD 26.8 million, which constitutes 55.6% of the overall ten-year expansion. This period is expected to be characterized by the expansion of quantum computing research requiring specialized vacuum environments with optical access, the development of advanced space instrumentation utilizing fiber optic telemetry systems, and the growth of precision manufacturing applications incorporating real-time fiber sensing in vacuum processes. The growing adoption of Industry 4.0 technologies and smart manufacturing systems will drive demand for vacuum fiber feedthrough flanges with enhanced performance characteristics and customization capabilities.

Between 2020 and 2025, the vacuum fiber feedthrough flanges market experienced steady growth, driven by increasing semiconductor industry investment in advanced manufacturing equipment and growing recognition of fiber feedthrough flanges as essential components for enabling optical measurements, sensor integration, and data transmission in vacuum environments. The market developed as process engineers and instrumentation specialists recognized the potential for hermetic fiber feedthrough technology to provide reliable optical access to vacuum chambers while maintaining pressure integrity, preventing contamination ingress, and supporting critical measurement requirements. Technological advancement in sealing technologies and optical interface designs began emphasizing the critical importance of maintaining transmission efficiency and mechanical stability in demanding vacuum applications and thermal cycling conditions.

Vacuum Fiber Feedthrough Flanges Market Key Takeaways

Metric Value
Estimated Value in (2025E) USD 84.8 million
Forecast Value in (2035F) USD 133 million
Forecast CAGR (2025 to 2035) 4.6%

Why is the Vacuum Fiber Feedthrough Flanges Market Growing?

Market expansion is being supported by the increasing global demand for advanced semiconductor manufacturing equipment and scientific research instrumentation driven by technology miniaturization and performance requirements, alongside the corresponding need for specialized vacuum components that can enable fiber optic communication, integrate sensor systems, and maintain hermetic sealing across various thin film deposition, plasma processing, and analytical instrument applications. Modern semiconductor fabs and research laboratories are increasingly focused on implementing vacuum fiber feedthrough solutions that can provide reliable optical access, support multi-fiber configurations, and deliver consistent performance in high vacuum and ultra-high vacuum environments.

The growing emphasis on process monitoring and real-time diagnostics is driving demand for vacuum feedthrough flanges that can support in-situ measurement systems, enable remote sensing capabilities, and ensure comprehensive data collection without compromising vacuum integrity. Equipment manufacturers' preference for components that combine hermetic sealing performance with optical transmission efficiency and installation flexibility is creating opportunities for innovative feedthrough implementations. The rising influence of space exploration initiatives and quantum technology development is also contributing to increased adoption of vacuum fiber feedthroughs that can provide reliable optical connections without compromising system cleanliness or measurement accuracy.

What Are the Key Segments Driving Growth in the Vacuum Fiber Feedthrough Flanges Market?

The market is segmented by product type, application, and region. By product type, the market is divided into standard type and customized type. Based on application, the market is categorized into medical equipment, semiconductors, aerospace, and others. Regionally, the market is divided into East Asia, Europe, North America, South Asia, Latin America, Middle East & Africa, and Eastern Europe.
By Product Type, the Standard Type Segment Leads the Market

Vacuum Fiber Feedthrough Flanges Market Analysis By Product Type

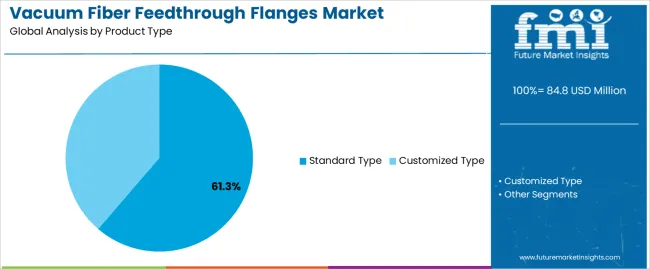
The standard type segment is projected to maintain its leading position in the vacuum fiber feedthrough flanges market in 2025 with a 61.3% market share, reaffirming its role as the preferred product configuration for common vacuum system requirements and general-purpose applications. Research laboratories and equipment manufacturers increasingly utilize standard feedthrough flanges for their compatibility with industry-standard vacuum flanges, readily available specifications, and proven reliability in routine vacuum applications while offering cost-effective solutions. Standard type technology's established design parameters and broad applicability directly address the market requirements for reliable fiber transmission across diverse vacuum systems and pressure ranges without requiring specialized engineering or extended delivery times.

This product type segment forms the foundation of vacuum system instrumentation, as it represents the configuration with the greatest installed base and established supply channels across multiple research facilities and manufacturing operations. Scientific equipment investments in vacuum technology infrastructure continue to strengthen adoption among equipment integrators and end-users. With increasing demand for standardized components that reduce procurement complexity and support interchangeability, standard type feedthroughs align with both operational efficiency objectives and inventory management requirements, making them the central component of comprehensive vacuum system strategies.
By Application, the Medical Equipment Segment Dominates Market Demand

Vacuum Fiber Feedthrough Flanges Market Analysis By Application

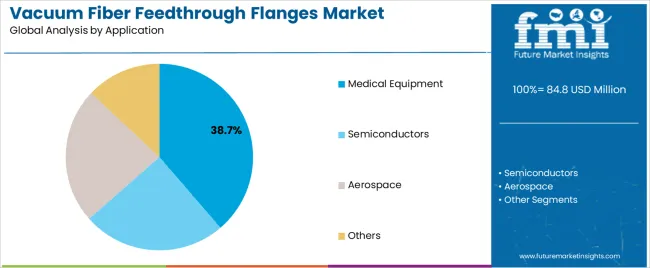
The medical equipment application segment is projected to represent the largest share of vacuum fiber feedthrough flanges demand in 2025 with a 38.7% market share, underscoring its critical role as the primary driver for feedthrough adoption across analytical instruments, diagnostic systems, and therapeutic equipment requiring fiber optic sensing and vacuum environments. Medical device manufacturers prefer vacuum fiber feedthrough flanges due to their hermetic sealing capabilities for sterile environments, biocompatibility of sealing materials, and ability to integrate fiber optic monitoring systems while supporting regulatory compliance and patient safety requirements. Positioned as essential components for advanced medical instrumentation, vacuum fiber feedthrough flanges offer both functional performance and quality assurance benefits.

The segment is supported by continuous innovation in medical diagnostic technologies and the growing implementation of fiber optic sensing systems that enable minimally invasive procedures with enhanced measurement capabilities and real-time monitoring functions. Additionally, medical equipment manufacturers are investing in sophisticated instrumentation programs to support precision therapy delivery, advanced imaging modalities, and diagnostic accuracy improvements that require reliable vacuum-to-atmosphere fiber transitions. As medical technology advances and diagnostic capabilities expand, the medical equipment application will continue to dominate the market while supporting advanced sensing integration and equipment performance optimization strategies.

What are the Drivers, Restraints, and Key Trends of the Vacuum Fiber Feedthrough Flanges Market?

The vacuum fiber feedthrough flanges market is advancing steadily due to increasing demand for semiconductor process equipment driven by chip manufacturing capacity expansion and growing adoption of fiber optic sensing technologies in vacuum environments that require specialized components providing hermetic sealing and optical transmission capabilities across diverse thin film deposition, analytical instrumentation, medical diagnostics, and aerospace testing applications. The market faces challenges, including high precision manufacturing requirements and associated production costs, competition from alternative vacuum transmission methods and wireless sensing solutions, and technical constraints related to thermal expansion compatibility and long-term sealing reliability in extreme operating conditions. Innovation in sealing materials and fiber interface technologies continues to influence product development and market expansion patterns.

Expansion of Semiconductor Manufacturing Capacity and Process Monitoring Requirements

The growing expansion of semiconductor fabrication facilities is driving demand for specialized vacuum feedthrough components that enable in-situ process monitoring, support advanced metrology systems, and facilitate real-time plasma diagnostics in deposition and etching chambers. Semiconductor applications require vacuum fiber feedthroughs that maintain ultra-high vacuum integrity while delivering low signal attenuation and minimal outgassing characteristics suitable for cleanroom environments. Equipment manufacturers are increasingly recognizing the advantages of fiber optic instrumentation for electromagnetic interference immunity, temperature monitoring capabilities, and remote sensing applications, creating opportunities for specialized feedthrough designs optimized for semiconductor tool integration and process control requirements.

Integration of Advanced Sealing Technologies and Material Innovations

Modern vacuum feedthrough manufacturers are incorporating advanced glass-to-metal sealing techniques, specialized epoxy formulations, and engineered ceramic materials to enhance hermetic performance, extend temperature operating ranges, and support comprehensive reliability requirements through optimized thermal expansion matching and stress management. Leading companies are developing proprietary sealing processes for multi-fiber configurations, implementing quality control protocols for leak detection and verification, and advancing material selections that accommodate various fiber types and connector interfaces. These developments improve product capabilities while enabling new market opportunities, including cryogenic applications, high-temperature processing environments, and radiation-resistant instrumentation systems. Advanced material integration also allows manufacturers to support comprehensive performance specifications and application diversity beyond traditional vacuum component limitations.

Development of Customized Solutions for Specialized Research and Space Applications

The expansion of quantum computing research, space exploration missions, and advanced physics experiments is driving demand for customized vacuum fiber feedthrough designs that address unique environmental challenges, accommodate specific mounting configurations, and support specialized fiber types including single-mode, multi-mode, and specialty optical fibers. These applications require engineering collaboration for custom flange sizes, multiple fiber arrangements, and integrated connector systems that meet specific performance criteria, creating premium market segments with differentiated technical requirements and service models. Manufacturers are investing in application engineering capabilities and prototyping resources to serve emerging technology sectors while supporting innovation in scientific research and space instrumentation development.

How Are Global Trends Impacting the Vacuum Fiber Feedthrough Flanges Market in Key Countries?

Vacuum Fiber Feedthrough Flanges Market Cagr Analysis By Country

Country CAGR (2025-2035)
China 6.2%
India 5.8%
Germany 5.3%
Brazil 4.8%
United States 4.4%
United Kingdom 3.9%
Japan 3.5%

The vacuum fiber feedthrough flanges market is experiencing solid growth globally, with China leading at a 6.2% CAGR through 2035, driven by expanding semiconductor manufacturing capacity, growing scientific research infrastructure, and increasing investment in advanced instrumentation systems. India follows at 5.8%, supported by developing semiconductor fabrication facilities, expanding medical device manufacturing, and rising research institution capabilities. Germany shows growth at 5.3%, emphasizing precision manufacturing excellence, photonics industry strength, and advanced vacuum technology development. Brazil demonstrates 4.8% growth, supported by scientific research expansion, medical equipment production, and aerospace industry development.

The United States records 4.4%, focusing on semiconductor manufacturing leadership, space exploration programs, and advanced research facility investments. The United Kingdom exhibits 3.9% growth, emphasizing scientific research capabilities, medical technology innovation, and precision engineering expertise. Japan shows 3.5% growth, supported by semiconductor equipment manufacturing, scientific instrumentation excellence, and quality-focused production standards.

The report covers an in-depth analysis of 40+ countries, the top-performing countries are highlighted below.
What Role Does China Play in Advancing Vacuum Fiber Feedthrough Flanges Technology?

Vacuum Fiber Feedthrough Flanges Market Country Value Analysis

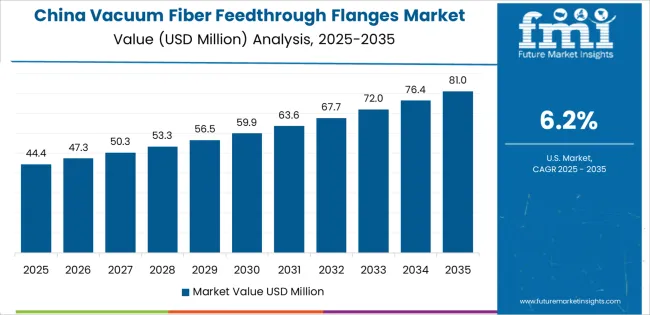
Revenue from vacuum fiber feedthrough flanges in China is projected to exhibit exceptional growth with a CAGR of 6.2% through 2035, driven by massive semiconductor manufacturing capacity expansion and rapidly growing scientific research infrastructure supported by government Made in China 2025 initiatives and national technology development programs. The country's substantial investment in advanced manufacturing equipment and increasing emphasis on indigenous technology development are creating significant demand for vacuum component solutions. Major semiconductor equipment manufacturers and research institutions are establishing comprehensive supply chains to serve both domestic production facilities and international markets.

  • Government support for semiconductor industry development and scientific research infrastructure is driving demand for vacuum fiber feedthrough flanges throughout major technology clusters and research centers across semiconductor fabs, national laboratories, and university research facilities.
  • Strong photonics industry growth and an expanding network of advanced manufacturing facilities are supporting the rapid adoption of fiber optic instrumentation systems among equipment manufacturers seeking enhanced process control and monitoring capabilities.

Why Is India Becoming a Key Market for Vacuum Fiber Feedthrough Flanges?

Revenue from vacuum fiber feedthrough flanges in India is expanding at a CAGR of 5.8%, supported by the country's developing semiconductor fabrication capabilities, expanding medical device manufacturing sector, and increasing investment in scientific research infrastructure across government laboratories and academic institutions. The country's comprehensive technology development programs and rising emphasis on advanced manufacturing are driving demand for specialized vacuum components throughout emerging technology sectors. Leading equipment manufacturers and research organizations are establishing procurement channels and technical partnerships to address growing instrumentation requirements.

  • Rising semiconductor assembly operations and expanding electronics manufacturing are creating opportunities for vacuum feedthrough adoption across clean room facilities, testing laboratories, and production equipment installations in major technology parks and industrial zones.
  • Growing government focus on scientific research capabilities and Make in India initiatives is driving investment in laboratory instrumentation among research institutions seeking advanced measurement systems and process monitoring technologies.

What Are the Key Growth Drivers for Vacuum Fiber Feedthrough Flanges in Germany?

Revenue from vacuum fiber feedthrough flanges in Germany is expanding at a CAGR of 5.3%, supported by the country's photonics industry excellence, precision vacuum component manufacturing, and strong research infrastructure serving advanced physics experiments and industrial process development. The nation's engineering capabilities and technology innovation focus are driving sophisticated vacuum feedthrough implementations throughout research and industrial sectors. Leading vacuum technology companies and research institutions are investing extensively in component development and application engineering for specialized requirements.

  • Advanced research facility requirements and precision manufacturing applications are creating demand for high-specification vacuum feedthroughs among scientific institutions, technology companies, and equipment manufacturers seeking optimized optical access solutions.
  • Strong photonics industry presence and growing emphasis on quantum technology development are supporting the adoption of specialized vacuum components across research laboratories throughout major technology regions.

What Are the Key Factors Driving Vacuum Fiber Feedthrough Flanges Demand in Brazil?

Revenue from vacuum fiber feedthrough flanges in Brazil is expanding at a CAGR of 4.8%, supported by the country's expanding scientific research capabilities, developing medical equipment manufacturing sector, and growing aerospace industry requiring vacuum testing facilities. Brazil's research infrastructure development and technology sector growth are driving demand for vacuum component solutions. Research institutions and medical device companies are investing in equipment capabilities to serve domestic research programs and regional manufacturing operations.

  • Scientific research expansion and national laboratory infrastructure development are creating demand for vacuum instrumentation components among research facilities conducting materials science, physics experiments, and advanced technology development programs.
  • Growing medical device manufacturing and expanding aerospace testing capabilities are supporting the adoption of vacuum fiber feedthroughs in diagnostic equipment production, therapeutic device development, and component testing facilities across major industrial centers.

What Are the Key Trends Driving Vacuum Fiber Feedthrough Flanges Demand in the U.S.?

Revenue from vacuum fiber feedthrough flanges in the United States is expanding at a CAGR of 4.4%, supported by the country's semiconductor manufacturing leadership, extensive space exploration programs, and comprehensive research infrastructure spanning national laboratories, universities, and private research facilities. The nation's technology innovation ecosystem and advanced manufacturing capabilities are driving demand for sophisticated vacuum feedthrough solutions. Semiconductor equipment manufacturers and aerospace companies are investing in component procurement and custom development to serve both commercial and government applications.

  • Advanced semiconductor manufacturing requirements and process monitoring initiatives are creating demand for precision vacuum feedthroughs among equipment manufacturers producing deposition systems, etching tools, and analytical instruments.
  • Strong space exploration programs and growing commercial space sector are driving adoption of specialized vacuum components in satellite systems, spacecraft instrumentation, and ground-based testing facilities across aerospace industry clusters.

What Are the Key Growth Drivers in the Vacuum Fiber Feedthrough Flanges Market in the UK?

Revenue from vacuum fiber feedthrough flanges in the United Kingdom is expanding at a CAGR of 3.9%, driven by the country's scientific research capabilities, medical technology innovation, and precision engineering expertise supporting advanced instrumentation development for research and industrial applications. The United Kingdom's research institution strength and technology sector capabilities are driving demand for specialized vacuum components. University research groups and medical device developers are investing in advanced instrumentation systems incorporating fiber optic sensing technologies.
  • Advanced scientific research requirements and precision measurement applications are creating opportunities for vacuum feedthrough utilization throughout particle physics facilities, materials research centers, and national laboratory installations.
  • Strong medical technology sector and diagnostic equipment innovation are driving adoption of hermetic fiber feedthrough components in analytical instruments, therapeutic systems, and research equipment meeting regulatory standards and performance requirements.

What Are the Key Trends Shaping Vacuum Fiber Feedthrough Flanges Demand in Japan?

Vacuum Fiber Feedthrough Flanges Market Japan Market Share Analysis By Product Type

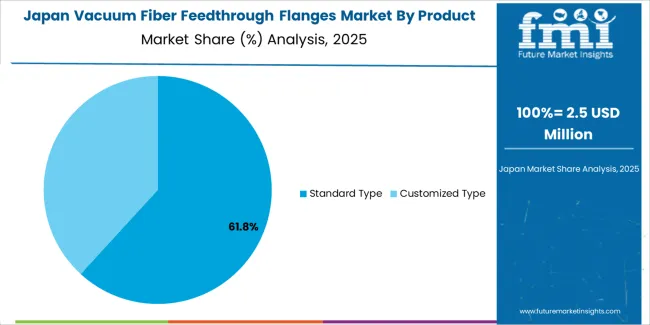
Revenue from vacuum fiber feedthrough flanges in Japan is expanding at a CAGR of 3.5%, supported by the country's semiconductor equipment manufacturing leadership, scientific instrumentation excellence, and precision component production capabilities serving domestic and international markets. Japan's technological sophistication and quality manufacturing standards are driving demand for high-precision vacuum feedthrough products. Leading equipment manufacturers and research institutions are investing in component integration for advanced systems and specialized applications.
  • Advanced semiconductor equipment production and precision manufacturing requirements are creating demand for high-quality vacuum feedthrough components throughout equipment assembly operations, process tool manufacturing, and analytical instrument production facilities.
  • Strong scientific instrumentation tradition and research facility infrastructure are driving adoption of reliable vacuum components in physics experiments, materials characterization systems, and advanced measurement equipment meeting rigorous performance specifications.

How Are Different European Countries Contributing to Vacuum Fiber Feedthrough Flanges Growth?

Vacuum Fiber Feedthrough Flanges Market Europe Country Market Share Analysis, 2025 & 2035

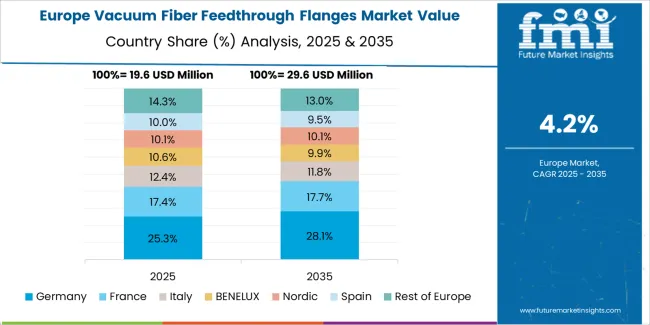
The vacuum fiber feedthrough flanges market in Europe is projected to grow from USD 29.2 million in 2025 to USD 44.5 million by 2035, registering a CAGR of 4.3% over the forecast period. Germany is expected to maintain leadership with a 31.4% market share in 2025, moderating to 30.9% by 2035, supported by photonics industry strength, precision vacuum component manufacturing, and advanced research infrastructure.

The United Kingdom follows with 18.7% in 2025, projected at 18.4% by 2035, driven by scientific research excellence, medical technology development, and precision engineering capabilities. France holds 16.2% in 2025, rising to 16.4% by 2035 on the back of research facility investments, aerospace industry requirements, and semiconductor development initiatives. Italy commands 11.5% in 2025, increasing slightly to 11.7% by 2035, while Spain accounts for 8.3% in 2025, reaching 8.5% by 2035 aided by research infrastructure expansion and medical equipment production.

The Netherlands maintains 4.9% in 2025, up to 5% by 2035 due to photonics research capabilities and precision manufacturing expertise. The Rest of Europe region, including Nordics, Central & Eastern Europe, and other markets, is anticipated to hold 9% in 2025 and 9.1% by 2035, reflecting steady advancement in research infrastructure, semiconductor manufacturing development, and scientific instrumentation adoption.

What Strategies Are Leading Companies Using to Compete in the Vacuum Fiber Feedthrough Flanges Market?

The vacuum fiber feedthrough flanges market is characterized by competition among specialized vacuum component manufacturers, precision optics companies, and diversified instrumentation suppliers. Companies are investing in sealing technology development, custom engineering capabilities, product portfolio expansion, and quality assurance systems to deliver reliable, high-performance, and application-specific vacuum fiber feedthrough solutions. Innovation in hermetic sealing methods, multi-fiber configurations, and thermal management designs is central to strengthening market position and competitive advantage.

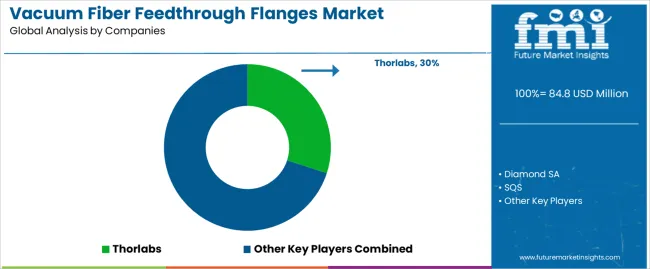
Thorlabs leads the market with comprehensive photonics and optomechanical components with a focus on vacuum-compatible fiber optics, standardized feedthrough products, and global distribution capabilities across diverse research and industrial applications. Diamond SA provides precision hermetic sealing solutions with emphasis on custom feedthrough designs, multi-fiber configurations, and aerospace-grade components. SQS delivers specialized vacuum feedthrough products with focus on semiconductor applications and high-vacuum performance. Hositrad offers fiber optic feedthrough systems with emphasis on medical equipment integration and regulatory compliance. Engionic provides engineered vacuum components with focus on custom solutions and application engineering support.

Solid Sealing Technology specializes in hermetic sealing components for vacuum and pressure applications. SEDI-ATI Fibres Optiques focuses on fiber optic component manufacturing including vacuum feedthrough solutions. OEfind provides precision optical components and vacuum-compatible fiber products. Deben UK offers scientific instrumentation components including specialized feedthrough designs. Shenzhen Xinray Technology emphasizes vacuum component manufacturing for Asian markets. Shanghai YiNGUAN Semiconductor Technology provides semiconductor equipment components including fiber feedthrough systems. Photon Technology delivers photonics components and vacuum-compatible optical solutions for research applications.

Vacuum Fiber Feedthrough Flanges Market - Stakeholder Contribution Framework

Vacuum fiber feedthrough flanges represent a specialized component segment within vacuum technology and optical instrumentation, projected to grow from USD 84.8 million in 2025 to USD 133 million by 2035 at a 4.6% CAGR. These precision-engineered components serve as critical interface elements enabling fiber optic signal transmission into vacuum environments where hermetic sealing, optical transmission integrity, and environmental isolation are essential. Market expansion is driven by increasing semiconductor manufacturing capacity, growing adoption of fiber optic sensing systems, expanding space exploration programs, and rising implementation of advanced diagnostic technologies across diverse medical equipment, semiconductor processing, aerospace testing, and scientific research applications.

How Industry Regulators Could Strengthen Quality Standards and Application Safety?

  • Performance Specification Standards: Establish comprehensive technical requirements for vacuum fiber feedthrough flanges, including leak rate specifications, optical transmission parameters, pressure rating requirements, and material compatibility standards that ensure consistent performance across semiconductor, medical, and aerospace applications.
  • Quality Certification Programs: Develop regulatory frameworks for component qualification including leak testing protocols, thermal cycling validation, optical performance verification, and materials certification that support quality assurance and application reliability.
  • Application-Specific Guidelines: Create specialized standards for medical device feedthroughs addressing biocompatibility requirements, sterilization compatibility, and patient safety considerations specific to diagnostic and therapeutic equipment applications.
  • Contamination Control Standards: Implement requirements for component cleanliness, outgassing characteristics, and particle generation limits that support semiconductor manufacturing cleanroom requirements and ultra-high vacuum applications.
  • Traceability Requirements: Establish documentation standards for material certifications, manufacturing processes, and quality testing that enable component traceability and support regulatory compliance in critical applications.

How Industry Associations Could Advance Technical Knowledge and Best Practices?

  • Installation Guidelines Development: Develop comprehensive technical standards for feedthrough selection, flange mounting, fiber preparation, and leak checking procedures that ensure proper installation, optimal performance, and long-term reliability across diverse applications.
  • Performance Testing Standards: Establish standardized methodologies for leak rate measurement, optical loss assessment, thermal cycling evaluation, and pressure testing that facilitate objective product comparison and quality verification.
  • Technical Training Programs: Create specialized education initiatives for equipment engineers, vacuum technicians, and instrumentation specialists covering feedthrough technologies, installation techniques, troubleshooting methods, and maintenance procedures across semiconductor, medical, and research applications.
  • Application Best Practices: Implement industry-wide recommendations for fiber type selection, connector configuration, thermal management, and integration techniques that optimize system performance while preventing common failure modes.
  • Cross-Industry Collaboration: Facilitate knowledge exchange between vacuum equipment manufacturers, fiber optic suppliers, end-user industries, and research institutions to advance technology understanding, address application challenges, and disseminate successful implementation experiences.

How Feedthrough Manufacturers Could Drive Innovation and Customer Success?

  • Advanced Sealing Technologies: Invest in research programs developing improved hermetic sealing methods, including optimized glass-to-metal seals, advanced epoxy formulations, and ceramic sealing technologies that enhance reliability while expanding temperature and pressure capabilities.
  • Custom Design Capabilities: Develop engineering resources, rapid prototyping capabilities, and application expertise that enable customized feedthrough solutions addressing specific customer requirements including unique flange sizes, multiple fiber configurations, and specialized connector interfaces.
  • Quality Assurance Systems: Implement rigorous manufacturing controls, comprehensive testing protocols, and statistical process control that ensure consistent product quality, reliability, and performance across production batches.
  • Technical Support Services: Establish customer assistance programs providing application engineering consultation, installation guidance, troubleshooting support, and performance optimization recommendations that strengthen customer relationships and ensure successful implementations.
  • Product Development Programs: Advance next-generation feedthrough designs incorporating multi-fiber density improvements, integrated connector systems, simplified installation features, and enhanced thermal management that address evolving market requirements.

How End-User Organizations Could Optimize Component Selection and System Performance?

  • Requirements Assessment: Conduct comprehensive evaluations of vacuum level requirements, fiber types, connector preferences, thermal environments, and mounting constraints to select appropriate feedthrough specifications that meet application needs while managing costs.
  • Installation Quality Control: Implement standardized procedures for feedthrough installation, fiber preparation, leak checking, and optical testing that ensure proper system integration, hermetic performance, and signal integrity.
  • Preventive Maintenance Programs: Develop inspection protocols, performance monitoring procedures, and periodic verification testing that maintain feedthrough reliability, identify potential issues, and prevent unexpected failures in critical applications.
  • Supplier Partnerships: Establish collaborative relationships with feedthrough manufacturers for technical consultation, custom development projects, and application support that address specific challenges and optimize component performance.
  • Performance Documentation: Maintain detailed records of feedthrough specifications, installation procedures, performance testing, and maintenance history that support troubleshooting activities, system upgrades, and knowledge retention.

How Research Institutions Could Enable Technology Advancement?

  • Fundamental Research: Conduct scientific investigations into hermetic sealing mechanisms, thermal stress analysis, optical transmission characteristics, and material compatibility that advance understanding and enable breakthrough innovations in feedthrough technology.
  • Materials Development: Investigate novel sealing materials, fiber coating systems, and flange materials that improve performance characteristics, extend environmental capabilities, and enable new application possibilities.
  • Application Innovation: Explore emerging applications for vacuum fiber feedthroughs in quantum computing systems, space exploration instruments, advanced plasma diagnostics, and next-generation medical devices that create new market opportunities.
  • Testing Methodology Development: Develop advanced characterization techniques, accelerated life testing protocols, and failure analysis methods that improve product qualification and reliability prediction capabilities.
  • Knowledge Dissemination: Facilitate technology advancement through technical publications, conference presentations, collaborative research programs, and industry partnerships that accelerate innovation adoption and strengthen research-industry collaboration.

How Equipment Integrators Could Support Market Development?
  • System Design Expertise: Provide engineering capabilities for integrating vacuum fiber feedthroughs into semiconductor tools, analytical instruments, and medical devices that optimize component selection and system performance.
  • Installation Services: Offer professional installation, fiber preparation, connector termination, and system verification that ensure proper feedthrough implementation and reliable operation.
  • Technical Documentation: Develop comprehensive specifications, installation instructions, and maintenance procedures that support end-user operations and service activities.
  • Training Programs: Create education initiatives for customer personnel covering system operation, maintenance requirements, troubleshooting techniques, and safety procedures specific to vacuum fiber feedthrough applications.
  • After-Sales Support: Establish service capabilities providing technical assistance, component replacement, system upgrades, and performance optimization that maintain customer system functionality and extend operational life.

Who Are the Key Players in the Vacuum Fiber Feedthrough Flanges Market?

Vacuum Fiber Feedthrough Flanges Market Analysis By Company

  • Thorlabs
  • Diamond SA
  • SQS
  • Hositrad
  • Engionic
  • Solid Sealing Technology
  • SEDI-ATI Fibres Optiques
  • OEfind
  • Deben UK
  • Shenzhen Xinray Technology
  • Shanghai YiNGUAN Semiconductor Technology
  • Photon Technology

Scope of the Report

Items Values
Quantitative Units (2025) USD 84.8 million
Product Type Standard Type, Customized Type
Application Medical Equipment, Semiconductors, Aerospace, Others
Regions Covered East Asia, Europe, North America, South Asia, Latin America, Middle East & Africa, Eastern Europe
Countries Covered China, India, Germany, Brazil, United States, United Kingdom, Japan, and 40+ countries
Key Companies Profiled Thorlabs, Diamond SA, SQS, Hositrad, Engionic
Additional Attributes Dollar sales by product type and application category, regional demand trends, competitive landscape, technological advancements in hermetic sealing, custom design capabilities, optical performance optimization, and application integration strategies

Vacuum Fiber Feedthrough Flanges Market by Segments

Product Type:

  • Standard Type
  • Customized Type

Application:

  • Medical Equipment
  • Semiconductors
  • Aerospace
  • Others

Region:

East Asia

  • China
  • Japan
  • South Korea
  • Taiwan
  • Rest of East Asia

Europe

  • Germany
  • United Kingdom
  • France
  • Italy
  • Spain
  • Netherlands
  • Nordic
  • BENELUX
  • Rest of Europe

North America

  • United States
  • Canada
  • Mexico

South Asia

  • India
  • Pakistan
  • Bangladesh
  • Rest of South Asia

Latin America

  • Brazil
  • Argentina
  • Chile
  • Rest of Latin America

Middle East & Africa

  • Kingdom of Saudi Arabia
  • Other GCC Countries
  • Turkey
  • South Africa
  • Other African Union
  • Rest of Middle East & Africa

Eastern Europe

  • Russia
  • Poland
  • Czech Republic
  • Rest of Eastern Europe

Frequently Asked Questions

How big is the vacuum fiber feedthrough flanges market in 2025?

The global vacuum fiber feedthrough flanges market is estimated to be valued at USD 84.8 million in 2025.

What will be the size of vacuum fiber feedthrough flanges market in 2035?

The market size for the vacuum fiber feedthrough flanges market is projected to reach USD 133.0 million by 2035.

How much will be the vacuum fiber feedthrough flanges market growth between 2025 and 2035?

The vacuum fiber feedthrough flanges market is expected to grow at a 4.6% CAGR between 2025 and 2035.

What are the key product types in the vacuum fiber feedthrough flanges market?

The key product types in vacuum fiber feedthrough flanges market are standard type and customized type.

Which application segment to contribute significant share in the vacuum fiber feedthrough flanges market in 2025?

In terms of application, medical equipment segment to command 38.7% share in the vacuum fiber feedthrough flanges market in 2025.

Table of Content

  1. Executive Summary
    • Global Market Outlook
    • Demand to side Trends
    • Supply to side Trends
    • Technology Roadmap Analysis
    • Analysis and Recommendations
  2. Market Overview
    • Market Coverage / Taxonomy
    • Market Definition / Scope / Limitations
  3. Market Background
    • Market Dynamics
      • Drivers
      • Restraints
      • Opportunity
      • Trends
    • Scenario Forecast
      • Demand in Optimistic Scenario
      • Demand in Likely Scenario
      • Demand in Conservative Scenario
    • Opportunity Map Analysis
    • Product Life Cycle Analysis
    • Supply Chain Analysis
    • Investment Feasibility Matrix
    • Value Chain Analysis
    • PESTLE and Porter’s Analysis
    • Regulatory Landscape
    • Regional Parent Market Outlook
    • Production and Consumption Statistics
    • Import and Export Statistics
  4. Global Market Analysis 2020 to 2024 and Forecast, 2025 to 2035
    • Historical Market Size Value (USD Million) Analysis, 2020 to 2024
    • Current and Future Market Size Value (USD Million) Projections, 2025 to 2035
      • Y to o to Y Growth Trend Analysis
      • Absolute $ Opportunity Analysis
  5. Global Market Pricing Analysis 2020 to 2024 and Forecast 2025 to 2035
  6. Global Market Analysis 2020 to 2024 and Forecast 2025 to 2035, By Product Type
    • Introduction / Key Findings
    • Historical Market Size Value (USD Million) Analysis By Product Type , 2020 to 2024
    • Current and Future Market Size Value (USD Million) Analysis and Forecast By Product Type , 2025 to 2035
      • Standard Type
      • Customized Type
    • Y to o to Y Growth Trend Analysis By Product Type , 2020 to 2024
    • Absolute $ Opportunity Analysis By Product Type , 2025 to 2035
  7. Global Market Analysis 2020 to 2024 and Forecast 2025 to 2035, By Application
    • Introduction / Key Findings
    • Historical Market Size Value (USD Million) Analysis By Application, 2020 to 2024
    • Current and Future Market Size Value (USD Million) Analysis and Forecast By Application, 2025 to 2035
      • Medical Equipment
      • Semiconductors
      • Aerospace
      • Others
    • Y to o to Y Growth Trend Analysis By Application, 2020 to 2024
    • Absolute $ Opportunity Analysis By Application, 2025 to 2035
  8. Global Market Analysis 2020 to 2024 and Forecast 2025 to 2035, By Region
    • Introduction
    • Historical Market Size Value (USD Million) Analysis By Region, 2020 to 2024
    • Current Market Size Value (USD Million) Analysis and Forecast By Region, 2025 to 2035
      • North America
      • Latin America
      • Western Europe
      • Eastern Europe
      • East Asia
      • South Asia and Pacific
      • Middle East & Africa
    • Market Attractiveness Analysis By Region
  9. North America Market Analysis 2020 to 2024 and Forecast 2025 to 2035, By Country
    • Historical Market Size Value (USD Million) Trend Analysis By Market Taxonomy, 2020 to 2024
    • Market Size Value (USD Million) Forecast By Market Taxonomy, 2025 to 2035
      • By Country
        • USA
        • Canada
        • Mexico
      • By Product Type
      • By Application
    • Market Attractiveness Analysis
      • By Country
      • By Product Type
      • By Application
    • Key Takeaways
  10. Latin America Market Analysis 2020 to 2024 and Forecast 2025 to 2035, By Country
    • Historical Market Size Value (USD Million) Trend Analysis By Market Taxonomy, 2020 to 2024
    • Market Size Value (USD Million) Forecast By Market Taxonomy, 2025 to 2035
      • By Country
        • Brazil
        • Chile
        • Rest of Latin America
      • By Product Type
      • By Application
    • Market Attractiveness Analysis
      • By Country
      • By Product Type
      • By Application
    • Key Takeaways
  11. Western Europe Market Analysis 2020 to 2024 and Forecast 2025 to 2035, By Country
    • Historical Market Size Value (USD Million) Trend Analysis By Market Taxonomy, 2020 to 2024
    • Market Size Value (USD Million) Forecast By Market Taxonomy, 2025 to 2035
      • By Country
        • Germany
        • UK
        • Italy
        • Spain
        • France
        • Nordic
        • BENELUX
        • Rest of Western Europe
      • By Product Type
      • By Application
    • Market Attractiveness Analysis
      • By Country
      • By Product Type
      • By Application
    • Key Takeaways
  12. Eastern Europe Market Analysis 2020 to 2024 and Forecast 2025 to 2035, By Country
    • Historical Market Size Value (USD Million) Trend Analysis By Market Taxonomy, 2020 to 2024
    • Market Size Value (USD Million) Forecast By Market Taxonomy, 2025 to 2035
      • By Country
        • Russia
        • Poland
        • Hungary
        • Balkan & Baltic
        • Rest of Eastern Europe
      • By Product Type
      • By Application
    • Market Attractiveness Analysis
      • By Country
      • By Product Type
      • By Application
    • Key Takeaways
  13. East Asia Market Analysis 2020 to 2024 and Forecast 2025 to 2035, By Country
    • Historical Market Size Value (USD Million) Trend Analysis By Market Taxonomy, 2020 to 2024
    • Market Size Value (USD Million) Forecast By Market Taxonomy, 2025 to 2035
      • By Country
        • China
        • Japan
        • South Korea
      • By Product Type
      • By Application
    • Market Attractiveness Analysis
      • By Country
      • By Product Type
      • By Application
    • Key Takeaways
  14. South Asia and Pacific Market Analysis 2020 to 2024 and Forecast 2025 to 2035, By Country
    • Historical Market Size Value (USD Million) Trend Analysis By Market Taxonomy, 2020 to 2024
    • Market Size Value (USD Million) Forecast By Market Taxonomy, 2025 to 2035
      • By Country
        • India
        • ASEAN
        • Australia & New Zealand
        • Rest of South Asia and Pacific
      • By Product Type
      • By Application
    • Market Attractiveness Analysis
      • By Country
      • By Product Type
      • By Application
    • Key Takeaways
  15. Middle East & Africa Market Analysis 2020 to 2024 and Forecast 2025 to 2035, By Country
    • Historical Market Size Value (USD Million) Trend Analysis By Market Taxonomy, 2020 to 2024
    • Market Size Value (USD Million) Forecast By Market Taxonomy, 2025 to 2035
      • By Country
        • Kingdom of Saudi Arabia
        • Other GCC Countries
        • Turkiye
        • South Africa
        • Other African Union
        • Rest of Middle East & Africa
      • By Product Type
      • By Application
    • Market Attractiveness Analysis
      • By Country
      • By Product Type
      • By Application
    • Key Takeaways
  16. Key Countries Market Analysis
    • USA
      • Pricing Analysis
      • Market Share Analysis, 2024
        • By Product Type
        • By Application
    • Canada
      • Pricing Analysis
      • Market Share Analysis, 2024
        • By Product Type
        • By Application
    • Mexico
      • Pricing Analysis
      • Market Share Analysis, 2024
        • By Product Type
        • By Application
    • Brazil
      • Pricing Analysis
      • Market Share Analysis, 2024
        • By Product Type
        • By Application
    • Chile
      • Pricing Analysis
      • Market Share Analysis, 2024
        • By Product Type
        • By Application
    • Germany
      • Pricing Analysis
      • Market Share Analysis, 2024
        • By Product Type
        • By Application
    • UK
      • Pricing Analysis
      • Market Share Analysis, 2024
        • By Product Type
        • By Application
    • Italy
      • Pricing Analysis
      • Market Share Analysis, 2024
        • By Product Type
        • By Application
    • Spain
      • Pricing Analysis
      • Market Share Analysis, 2024
        • By Product Type
        • By Application
    • France
      • Pricing Analysis
      • Market Share Analysis, 2024
        • By Product Type
        • By Application
    • India
      • Pricing Analysis
      • Market Share Analysis, 2024
        • By Product Type
        • By Application
    • ASEAN
      • Pricing Analysis
      • Market Share Analysis, 2024
        • By Product Type
        • By Application
    • Australia & New Zealand
      • Pricing Analysis
      • Market Share Analysis, 2024
        • By Product Type
        • By Application
    • China
      • Pricing Analysis
      • Market Share Analysis, 2024
        • By Product Type
        • By Application
    • Japan
      • Pricing Analysis
      • Market Share Analysis, 2024
        • By Product Type
        • By Application
    • South Korea
      • Pricing Analysis
      • Market Share Analysis, 2024
        • By Product Type
        • By Application
    • Russia
      • Pricing Analysis
      • Market Share Analysis, 2024
        • By Product Type
        • By Application
    • Poland
      • Pricing Analysis
      • Market Share Analysis, 2024
        • By Product Type
        • By Application
    • Hungary
      • Pricing Analysis
      • Market Share Analysis, 2024
        • By Product Type
        • By Application
    • Kingdom of Saudi Arabia
      • Pricing Analysis
      • Market Share Analysis, 2024
        • By Product Type
        • By Application
    • Turkiye
      • Pricing Analysis
      • Market Share Analysis, 2024
        • By Product Type
        • By Application
    • South Africa
      • Pricing Analysis
      • Market Share Analysis, 2024
        • By Product Type
        • By Application
  17. Market Structure Analysis
    • Competition Dashboard
    • Competition Benchmarking
    • Market Share Analysis of Top Players
      • By Regional
      • By Product Type
      • By Application
  18. Competition Analysis
    • Competition Deep Dive
      • Thorlabs
        • Overview
        • Product Portfolio
        • Profitability by Market Segments (Product/Age /Sales Channel/Region)
        • Sales Footprint
        • Strategy Overview
          • Marketing Strategy
          • Product Strategy
          • Channel Strategy
      • Diamond SA
      • SQS
      • Hositrad
      • Engionic
      • Solid Sealing Technology
      • SEDI-ATI Fibres Optiques
      • OEfind
      • Deben UK
      • Shenzhen Xinray Technology
      • Shanghai YiNGUAN Semiconductor Technology
      • Photon Technology
  19. Assumptions & Acronyms Used
  20. Research Methodology

List of Tables

  • Table 1: Global Market Value (USD Million) Forecast by Region, 2020 to 2035
  • Table 2: Global Market Value (USD Million) Forecast by Product Type , 2020 to 2035
  • Table 3: Global Market Value (USD Million) Forecast by Application, 2020 to 2035
  • Table 4: North America Market Value (USD Million) Forecast by Country, 2020 to 2035
  • Table 5: North America Market Value (USD Million) Forecast by Product Type , 2020 to 2035
  • Table 6: North America Market Value (USD Million) Forecast by Application, 2020 to 2035
  • Table 7: Latin America Market Value (USD Million) Forecast by Country, 2020 to 2035
  • Table 8: Latin America Market Value (USD Million) Forecast by Product Type , 2020 to 2035
  • Table 9: Latin America Market Value (USD Million) Forecast by Application, 2020 to 2035
  • Table 10: Western Europe Market Value (USD Million) Forecast by Country, 2020 to 2035
  • Table 11: Western Europe Market Value (USD Million) Forecast by Product Type , 2020 to 2035
  • Table 12: Western Europe Market Value (USD Million) Forecast by Application, 2020 to 2035
  • Table 13: Eastern Europe Market Value (USD Million) Forecast by Country, 2020 to 2035
  • Table 14: Eastern Europe Market Value (USD Million) Forecast by Product Type , 2020 to 2035
  • Table 15: Eastern Europe Market Value (USD Million) Forecast by Application, 2020 to 2035
  • Table 16: East Asia Market Value (USD Million) Forecast by Country, 2020 to 2035
  • Table 17: East Asia Market Value (USD Million) Forecast by Product Type , 2020 to 2035
  • Table 18: East Asia Market Value (USD Million) Forecast by Application, 2020 to 2035
  • Table 19: South Asia and Pacific Market Value (USD Million) Forecast by Country, 2020 to 2035
  • Table 20: South Asia and Pacific Market Value (USD Million) Forecast by Product Type , 2020 to 2035
  • Table 21: South Asia and Pacific Market Value (USD Million) Forecast by Application, 2020 to 2035
  • Table 22: Middle East & Africa Market Value (USD Million) Forecast by Country, 2020 to 2035
  • Table 23: Middle East & Africa Market Value (USD Million) Forecast by Product Type , 2020 to 2035
  • Table 24: Middle East & Africa Market Value (USD Million) Forecast by Application, 2020 to 2035

List of Figures

  • Figure 1: Global Market Pricing Analysis
  • Figure 2: Global Market Value (USD Million) Forecast 2020-2035
  • Figure 3: Global Market Value Share and BPS Analysis by Product Type , 2025 and 2035
  • Figure 4: Global Market Y to o to Y Growth Comparison by Product Type , 2025-2035
  • Figure 5: Global Market Attractiveness Analysis by Product Type
  • Figure 6: Global Market Value Share and BPS Analysis by Application, 2025 and 2035
  • Figure 7: Global Market Y to o to Y Growth Comparison by Application, 2025-2035
  • Figure 8: Global Market Attractiveness Analysis by Application
  • Figure 9: Global Market Value (USD Million) Share and BPS Analysis by Region, 2025 and 2035
  • Figure 10: Global Market Y to o to Y Growth Comparison by Region, 2025-2035
  • Figure 11: Global Market Attractiveness Analysis by Region
  • Figure 12: North America Market Incremental Dollar Opportunity, 2025-2035
  • Figure 13: Latin America Market Incremental Dollar Opportunity, 2025-2035
  • Figure 14: Western Europe Market Incremental Dollar Opportunity, 2025-2035
  • Figure 15: Eastern Europe Market Incremental Dollar Opportunity, 2025-2035
  • Figure 16: East Asia Market Incremental Dollar Opportunity, 2025-2035
  • Figure 17: South Asia and Pacific Market Incremental Dollar Opportunity, 2025-2035
  • Figure 18: Middle East & Africa Market Incremental Dollar Opportunity, 2025-2035
  • Figure 19: North America Market Value Share and BPS Analysis by Country, 2025 and 2035
  • Figure 20: North America Market Value Share and BPS Analysis by Product Type , 2025 and 2035
  • Figure 21: North America Market Y to o to Y Growth Comparison by Product Type , 2025-2035
  • Figure 22: North America Market Attractiveness Analysis by Product Type
  • Figure 23: North America Market Value Share and BPS Analysis by Application, 2025 and 2035
  • Figure 24: North America Market Y to o to Y Growth Comparison by Application, 2025-2035
  • Figure 25: North America Market Attractiveness Analysis by Application
  • Figure 26: Latin America Market Value Share and BPS Analysis by Country, 2025 and 2035
  • Figure 27: Latin America Market Value Share and BPS Analysis by Product Type , 2025 and 2035
  • Figure 28: Latin America Market Y to o to Y Growth Comparison by Product Type , 2025-2035
  • Figure 29: Latin America Market Attractiveness Analysis by Product Type
  • Figure 30: Latin America Market Value Share and BPS Analysis by Application, 2025 and 2035
  • Figure 31: Latin America Market Y to o to Y Growth Comparison by Application, 2025-2035
  • Figure 32: Latin America Market Attractiveness Analysis by Application
  • Figure 33: Western Europe Market Value Share and BPS Analysis by Country, 2025 and 2035
  • Figure 34: Western Europe Market Value Share and BPS Analysis by Product Type , 2025 and 2035
  • Figure 35: Western Europe Market Y to o to Y Growth Comparison by Product Type , 2025-2035
  • Figure 36: Western Europe Market Attractiveness Analysis by Product Type
  • Figure 37: Western Europe Market Value Share and BPS Analysis by Application, 2025 and 2035
  • Figure 38: Western Europe Market Y to o to Y Growth Comparison by Application, 2025-2035
  • Figure 39: Western Europe Market Attractiveness Analysis by Application
  • Figure 40: Eastern Europe Market Value Share and BPS Analysis by Country, 2025 and 2035
  • Figure 41: Eastern Europe Market Value Share and BPS Analysis by Product Type , 2025 and 2035
  • Figure 42: Eastern Europe Market Y to o to Y Growth Comparison by Product Type , 2025-2035
  • Figure 43: Eastern Europe Market Attractiveness Analysis by Product Type
  • Figure 44: Eastern Europe Market Value Share and BPS Analysis by Application, 2025 and 2035
  • Figure 45: Eastern Europe Market Y to o to Y Growth Comparison by Application, 2025-2035
  • Figure 46: Eastern Europe Market Attractiveness Analysis by Application
  • Figure 47: East Asia Market Value Share and BPS Analysis by Country, 2025 and 2035
  • Figure 48: East Asia Market Value Share and BPS Analysis by Product Type , 2025 and 2035
  • Figure 49: East Asia Market Y to o to Y Growth Comparison by Product Type , 2025-2035
  • Figure 50: East Asia Market Attractiveness Analysis by Product Type
  • Figure 51: East Asia Market Value Share and BPS Analysis by Application, 2025 and 2035
  • Figure 52: East Asia Market Y to o to Y Growth Comparison by Application, 2025-2035
  • Figure 53: East Asia Market Attractiveness Analysis by Application
  • Figure 54: South Asia and Pacific Market Value Share and BPS Analysis by Country, 2025 and 2035
  • Figure 55: South Asia and Pacific Market Value Share and BPS Analysis by Product Type , 2025 and 2035
  • Figure 56: South Asia and Pacific Market Y to o to Y Growth Comparison by Product Type , 2025-2035
  • Figure 57: South Asia and Pacific Market Attractiveness Analysis by Product Type
  • Figure 58: South Asia and Pacific Market Value Share and BPS Analysis by Application, 2025 and 2035
  • Figure 59: South Asia and Pacific Market Y to o to Y Growth Comparison by Application, 2025-2035
  • Figure 60: South Asia and Pacific Market Attractiveness Analysis by Application
  • Figure 61: Middle East & Africa Market Value Share and BPS Analysis by Country, 2025 and 2035
  • Figure 62: Middle East & Africa Market Value Share and BPS Analysis by Product Type , 2025 and 2035
  • Figure 63: Middle East & Africa Market Y to o to Y Growth Comparison by Product Type , 2025-2035
  • Figure 64: Middle East & Africa Market Attractiveness Analysis by Product Type
  • Figure 65: Middle East & Africa Market Value Share and BPS Analysis by Application, 2025 and 2035
  • Figure 66: Middle East & Africa Market Y to o to Y Growth Comparison by Application, 2025-2035
  • Figure 67: Middle East & Africa Market Attractiveness Analysis by Application
  • Figure 68: Global Market - Tier Structure Analysis
  • Figure 69: Global Market - Company Share Analysis
Dashboard
Dashboard
Dashboard
Dashboard
Dashboard
Dashboard

Full Research Suite comprises of:

Market outlook & trends analysis

Market outlook & trends analysis

Interviews & case studies

Interviews & case studies

Strategic recommendations

Strategic recommendations

Vendor profiles & capabilities analysis

Vendor profiles & capabilities analysis

5-year forecasts

5-year forecasts

8 regions and 60+ country-level data splits

8 regions and 60+ country-level data splits

Market segment data splits

Market segment data splits

12 months of continuous data updates

12 months of continuous data updates

DELIVERED AS:

PDF EXCEL ONLINE

Full Research Suite


$5000

$7500

$10000

Buy Report Now
Similar Industry Reports

Similar Industry Reports

High-vacuum Fiber Feedthrough Flanges Market

High-vacuum Fiber Feedthrough Flanges Market Size and Share Forecast Outlook 2025 to 2035

Vacuum Tension Rolls Market

Vacuum Tension Rolls Market Size and Share Forecast Outlook 2025 to 2035

Vacuum Self-priming Mobile Pumping Station Market

Vacuum Self-priming Mobile Pumping Station Market Size and Share Forecast Outlook 2025 to 2035

Vacuum Skin Packaging Market

Vacuum Skin Packaging Market Size and Share Forecast Outlook 2025 to 2035

Vacuum-Refill Units Market

Vacuum-Refill Units Market Analysis - Size and Share Forecast Outlook 2025 to 2035

Vacuum Leak Detectors Market

Vacuum Leak Detectors Market Size and Share Forecast Outlook 2025 to 2035

Vacuum Insulation Panels Market

Vacuum Insulation Panels Market Size and Share Forecast Outlook 2025 to 2035

Vacuum Pressure Encapsulated Transformer Market

Vacuum Pressure Encapsulated Transformer Market Size and Share Forecast Outlook 2025 to 2035

Vacuum Insulated Medium Voltage Switchgear Market

Vacuum Insulated Medium Voltage Switchgear Market Size and Share Forecast Outlook 2025 to 2035

Vacuum Rated Motors Market

Vacuum Rated Motors Market Size and Share Forecast Outlook 2025 to 2035

Vacuum Concentrators Market

Vacuum Concentrators Market Size and Share Forecast Outlook 2025 to 2035

Vacuum Insulated Low Voltage Commercial Switchgear Market

Vacuum Insulated Low Voltage Commercial Switchgear Market Size and Share Forecast Outlook 2025 to 2035

Vacuum Pressure Impregnated (VPI) Transformer Market

Vacuum Pressure Impregnated (VPI) Transformer Market Size and Share Forecast Outlook 2025 to 2035

Vacuum Insulated Pipe Market

Vacuum Insulated Pipe Market Size and Share Forecast Outlook 2025 to 2035

Vacuum Therapy Devices Market

Vacuum Therapy Devices Market Size and Share Forecast Outlook 2025 to 2035

Vacuum Pressure Swing Adsorption Market

Vacuum Pressure Swing Adsorption Market Size and Share Forecast Outlook 2025 to 2035

Vacuum Grease Market

Vacuum Grease Market Size and Share Forecast Outlook 2025 to 2035

Vacuum Truck Market
Vacuum Truck Market

Vacuum Truck Market Size and Share Forecast Outlook 2025 to 2035

Vacuum Thermoformed Packaging Market

Vacuum Thermoformed Packaging Market Size and Share Forecast Outlook 2025 to 2035

Vacuum Insulated Switchgear Market

Vacuum Insulated Switchgear Market Size and Share Forecast Outlook 2025 to 2035

Future Market Insights

Vacuum Fiber Feedthrough Flanges Market

Chat With MaRIA

Chat With

MaRIA

Hi There, I am MaRIA, Your Market Research Intelligence Assistant. How may I help you?