Self-administered Parenteral Market Size and Share Forecast Outlook 2025 to 2035

The Self-administered Parenteral Market is estimated to be valued at USD 26556.0 million in 2025 and is projected to reach USD 42440.0 million by 2035, registering a compound annual growth rate (CAGR) of 4.8% over the forecast period.
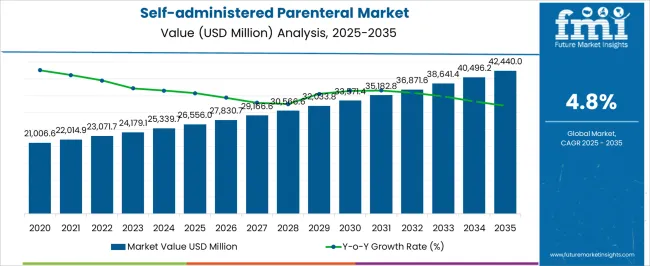
Quick Stats for Self-administered Parenteral Market

  • Self-administered Parenteral Market Industry Value (2025): USD 26556.0 million
  • Self-administered Parenteral Market Forecast Value (2035): USD 42440.0 million
  • Self-administered Parenteral Market Forecast CAGR: 4.8%
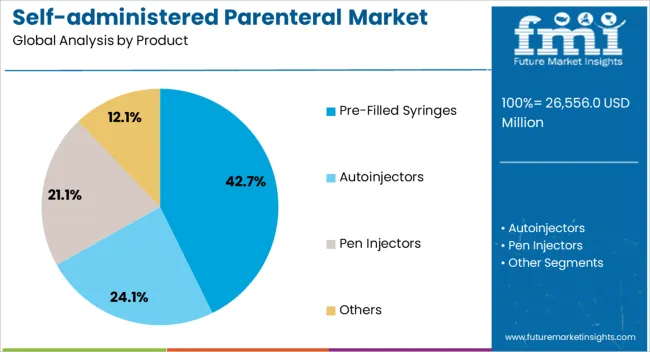
  • Leading Segment in Self-administered Parenteral Market in 2025: Pre-Filled Syringes (42.7%)
  • Key Growth Region in Self-administered Parenteral Market: North America, Asia-Pacific, Europe
  • Top Key Players in Self-administered Parenteral Market: Becton, Dickinson And Company, scPharmaceuticals, Harro Höfliger, Owen Mumford, Haselmeier, Stevanato Group, Ypsomed AG, Solteam Group, AstraZeneca, Enable Injections, CCBio, Phillips-Medisize Corporation, Sorrel Medical, Krontec Healthcare, Subcuject Aps, Ascendia Pharmaceuticals, West Pharmaceutical Services, Inc.

Self Administered Parenteral Market Market Value Analysis

Metric Value
Self-administered Parenteral Market Estimated Value in (2025 E) USD 26556.0 million
Self-administered Parenteral Market Forecast Value in (2035 F) USD 42440.0 million
Forecast CAGR (2025 to 2035) 4.8%

Rationale for Segmental Growth in the Self-Administered Parenteral Market

The self-administered parenteral market is advancing steadily, supported by the growing prevalence of chronic conditions requiring regular injections and the increasing emphasis on patient-centric healthcare solutions. Demand is fueled by the convenience of home-based administration, reducing dependence on hospital visits and lowering overall treatment costs. Technological advancements in device design, including improved safety mechanisms and ergonomic formats, have further accelerated adoption.

Rising awareness of self-care, along with healthcare system pressures to optimize resources, has reinforced the shift toward self-administered therapies. The market is also benefiting from greater access to biologics and biosimilars that require injectable delivery.

With expanding usage across therapeutic areas and ongoing innovation in pre-filled formats, the outlook remains robust. The market is expected to achieve consistent growth, underpinned by expanding healthcare accessibility and patient empowerment trends.
Segmental Analysis

Insights into the Pre-Filled Syringes Segment

Self Administered Parenteral Market Analysis By Product

The pre-filled syringes segment dominates the product category, accounting for approximately 42.70% share. This leadership is attributed to the convenience, precision, and reduced risk of contamination offered by pre-filled delivery systems.

These syringes eliminate the need for manual dose preparation, ensuring greater accuracy and safety for patients self-administering treatments. Pharmaceutical companies favor this format for biologics and vaccines, as it enhances stability and compliance.

The segment’s growth is also supported by favorable regulatory acceptance and increasing investments in advanced packaging technologies. With patient preference shifting toward devices that simplify administration, pre-filled syringes are projected to remain the leading format in the self-administered parenteral market.
Insights into the Diabetes Segment

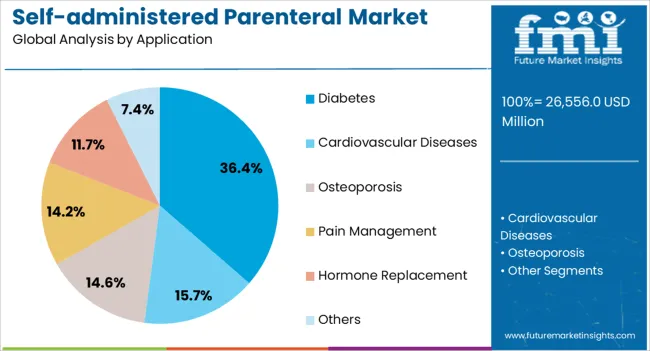
Self Administered Parenteral Market Analysis By Application

The diabetes segment leads the application category with approximately 36.40% share, reflecting the high demand for insulin and other injectable therapies in diabetes management. The global rise in diabetes prevalence has made self-administered injectables a cornerstone of treatment, enabling patients to manage their condition more effectively at home.

Devices tailored to insulin delivery, including pre-filled syringes and auto-injectors, have driven adoption. Healthcare systems encourage self-care for diabetes patients to reduce hospital burden, further supporting demand.

With continuous advancements in delivery technologies and expanding patient education programs, the diabetes segment is expected to maintain its dominant share across the application landscape.
Insights into the Disposable Segment

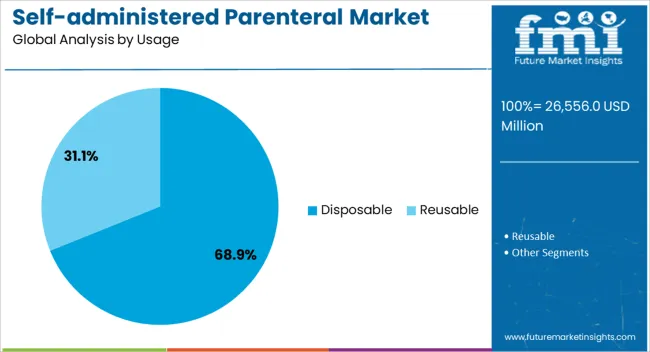
Self Administered Parenteral Market Analysis By Usage

The disposable segment dominates the usage category with approximately 68.90% share. Single-use delivery systems have gained preference due to their safety, hygiene, and compliance benefits.

Disposable devices minimize the risk of infection and cross-contamination, making them suitable for widespread home use. Manufacturers continue to innovate with lightweight, cost-effective materials, further driving adoption.

The segment’s growth is reinforced by increasing reliance on injectables in chronic disease management and rising global demand for sterile, convenient formats. As healthcare systems emphasize infection control and patients prioritize ease of use, disposable formats are projected to sustain their leadership in the forecast period.

Key Factors Driving Growth in the Self-administered Parenteral Market

  • Growing prevalence of chronic illnesses, coupled with rising demand for self-administered injectables like biologics, insulin, hormones, antidepressants, and pain relievers
  • Rising awareness about the benefits of self-administered parenteral or self-injection techniques
  • Technological advancements in drug delivery devices like autoinjectors and pen injectors
  • Surging demand for self-administered injectables as a result of the development of novel therapeutics and biosimilars
  • Increasing popularity of self-injection devices across developing regions

Trends Shaping the Self-administered Parenteral Market

  • Growing popularity of home-based treatment options
  • Development of easy-to-use injection devices
  • Rising adoption of smart injection devices
  • Increasing importance of biologics and specialty drugs
  • Shifting preference toward needle-free delivery systems
  • Continuous patient-controlled intravenous infusion advancements
  • Growing adoption of reusable autoinjectors for self-administration

Comparison of Historical and Future Outlooks of the Self-administered Parenteral Market

Global sales of self-administered parenteral products recorded a CAGR of 5.7% from 2020 to 2025. Total market valuation at the end of 2025 reached around USD 24,000.2 million. Over the assessment period, the global self-administered parenteral industry is projected to expand at a 4.8% CAGR.

Historical CAGR (2020 to 2025) 5.7%
Forecast CAGR (2025 to 2035) 4.8%

The rising prevalence of chronic illnesses significantly influences the market for self-administered parenteral products. Chronic disorders like diabetes, cardiovascular diseases, and other autoimmune diseases are frequently treated with this technique.

Self-administered parenteral products give patients the autonomy to manage their own care by enabling them to provide themselves with medication in the convenience of their own homes. For those who need continuous therapy due to chronic diseases, this convenience is incredibly crucial.

Self-administration convenience frequently results in increased patient adherence to recommended treatment plans. As a result, there may be an improvement in health outcomes and a decrease in the cost of healthcare due to non-compliance.

The self-administered parenteral technique is frequently applied to drugs that need to be taken regularly, like some kinds of therapies or prescriptions for long-term illnesses. Patient convenience and flexibility are two benefits of self-administered parenteral therapies since the patient may be able to administer the medication at home.

Lucrative Opportunities Fueling the Self-administered Parenteral Market

Self-administered parenteral is gaining immense traction due to its convenience and high effectiveness. It involves the injection of medications or therapeutic agents using wearable infusion pumps, autoinjectors, and other products.

More intuitive and effective self-administration devices may result from technological advancements, such as miniaturization, connectivity, and usability. This can improve parenteral medicine administration overall and increase patient compliance.

Patients and healthcare professionals can benefit from the integration of smart technology, such as sensors and networking elements, which can give useful data. Better disease management and individualized treatment plans are made possible by the inclusion of data on dosage, adherence, and patient health indicators.

The need for enhanced delivery systems is being driven by the rising incidence of parenterally administered specialty medicines and biologics. Hence, the self-administered parenteral industry is set to witness steady growth through 2035.

Self-administered Parenteral Market Size and Share Forecast Outlook 2025 to 2035

The growth and market dynamics of the self-administered parenteral industry are impacted by pricing constraints and competition from alternative products. If oral medications are readily available and efficacious, patients may favor them over self-administered parenteral drugs in certain instances. This desire may restrict the market potential for parenteral products that are self-administered.

Self-administered parenteral medications are facing competition from advances in drug delivery methods, such as transdermal patches, inhalers, or oral formulations with increased bioavailability. This also negatively impacts the target advanced parenteral drug delivery device market.

Parenteral medications that are self-administered and have generic counterparts on the market may cause price erosion and lower profit margins for the original manufacturers. In some areas, the market for self-administered parenteral products can be saturated, which would limit the potential for rapid expansion. It could be difficult to demand higher costs for new self-administered parenteral products if they lack uniqueness or innovation.

Analysis of Top Countries Producing, Distributing, and Using Self-administered Parenteral Products

The section highlights growth projections across prominent countries. India and China are predicted to register higher CAGRs of 9.4% and 8.3%, respectively, through 2035. This is due to the growing prevalence of chronic diseases and rising health awareness in these nations.

Market Growth Outlook by Key Countries

Countries Value CAGR
United States 3.7%
Germany 4.5%
United Kingdom 4.0%
Japan 5.8%
China 8.3%
India 9.4%

Growing Popularity of Autoinjectors Boosting the United States Market

The United States self-administered parenteral market value totaled USD 5,470.1 million in 2025 and is projected to rise at a 3.7% CAGR throughout the forecast period. This is attributable to the rising prevalence of diabetes and the growing popularity of pen injectors and autoinjectors.

Parenteral medications that are self-administered allow patients to administer their medication conveniently at home without having to make frequent trips to the clinic or hospital. Better patient adherence to treatment plans may result from this. As a result, demand for self-administered parenteral products is set to rise steadily in the United States.

In the United States, chronic conditions that need lifelong care, like diabetes, rheumatoid arthritis, and some types of cancer, are becoming more common. Patients can take more independent care of their conditions when they self-administer. Growing usage of products like insulin pens is expected to improve the United States' self-administered parenteral market share.

The development of wearable technology and auto-injectors, among other medication delivery systems, has made self-administration safer and easier. These developments could lead to a rise in the use of self-administered parenteral medications.

Another key factor boosting the United States market is the growing demand for home-based parenteral therapy solutions. Similarly, a rise in patient-centric parenteral administration will foster market growth.

Growing Need for Advanced Drug Delivery Systems Driving Demand in China

In China, the market for self-administered parenteral products is expanding as a result of greater knowledge and understanding of healthcare and self-administration techniques. People are becoming increasingly interested in self-administration choices as they become more health-concerned.

China's population is aging, and as self-administered parenteral solutions offer greater independence and convenience, older people may prefer them for the management of chronic illnesses. Growing adoption of advanced drug delivery systems like autoinjectors is expected to boost China market.

The rise in cases of cardiovascular diseases and osteoporosis is another prominent factor expected to drive demand for self-administered parenteral products. Similarly, the flourishing injection pen sector will likely create growth opportunities for manufacturers.

Rising Prevalence of Chronic Diseases Making India a Highly Lucrative Market

As per the latest analysis, India is set to emerge as the most lucrative market for self-administered parenteral products. In 2025, the total market value in India reached USD 2,522.0 million. Over the forecast period, sales of self-administered parenteral products in India are expected to soar at 9.4% CAGR.

The rising incidence of chronic diseases like diabetes, rheumatoid arthritis, and numerous autoimmune disorders drives the need for self-administered parenteral drugs in India. Self-administered choices and increased healthcare understanding may encourage patients to choose these solutions, particularly if they provide greater comfort and flexibility.

Innovations in this field may be pushed by pharmaceutical companies competing to create and sell novel self-administered medications. Enhancements to the healthcare infrastructure in India, such as improved logistics and distribution networks, can help make self-administered parenteral medications more accessible and available. This will further boost the market.

Self-administered Parenteral Industry Analysis by Top Investment Segments

The section below highlights key segments' estimated market shares and CAGRs, including product, application, usage, and distribution channel. This information can be vital for companies to invest in demanding products and find the most profitable distribution channels for their business and maximum sales.

  • Holding a share of 38.8% in 2025, the pre-filled syringes segment leads the global self-administered parenteral industry.
  • The pain management segment held a market share of 27.3% in 2025 and is projected to advance at 4.2% CAGR through 2035.
  • The disposable segment accounted for a prominent revenue share of 46.2% in 2025.
  • With a 38.9% value share in 2025, the hospital pharmacies segment leads the target market.

Pre-filled Syringes Remain Highly Sought-after Products in the Market

Market Growth Outlook by Key Products

Products Value CAGR
Pre-filled Syringes 3.2%
Autoinjectors 6.3%
Pen Injectors 4.7%
Others 7.7%

Pre-filled syringes remain the most sought-after products in the market, holding a dominant value share of 38.8% in 2025. In the assessment period, demand for pre-filled syringes is projected to rise at 3.2% CAGR.

The self-administered parenteral market has seen a rise in the use of pre-filled syringes as a result of several reasons that cater to the increasing need for safe and convenient medication delivery methods. These syringes are especially useful for self-administration because they are pre-loaded with a precise medication dosage, saving patients from having to measure or draw the right amount.

The invention of pre-filled syringes has greatly improved patient compliance and usability, especially when it comes to long-term ailments that call for frequent injections. They have become a convenient and efficient way to administer medication, offering multiple advantages over traditional ampoules and vials.

Pre-filled syringes have the potential to lower dosage errors, which is a significant benefit. Pre-measured doses reduce the possibility of overdosing or neglecting while also streamlining the delivery process, which enhances therapeutic results. This is particularly important when patients are self-administering because they might not have access to medical guidance or support.

Usage of Self-administered Parenteral Products Remain High in Pain Management

Market Growth Outlook by Key Application

Application Value CAGR
Cardiovascular Diseases 3.7%
Diabetes 3.8%
Osteoporosis 6.0%
Pain Management 4.2%
Hormone Replacement 7.5%
Others 7.0%

As per the latest analysis, pain management remains the most remunerative application for self-administered parenteral products. In 2025, the pain management segment contributed a value share of 27.3%. Over the assessment period, the same segment is projected to record a CAGR of 4.2%.

Pain management is a notable application because of a number of elements that emphasize the need for this specific therapeutic area. Self-administered parenteral therapy, which involves the patient administering medication via injection, has become increasingly popular in the treatment of pain for a variety of reasons.

First, there has been a global increase in the prevalence of chronic pain problems. A sizable fraction of people suffer from ailments like neuropathic pain, back pain, and arthritis. Self-administered parenteral medication is a practical and handy option for addressing these illnesses, as it is often provided through injections.

By administering the necessary medication at home, patients can improve their overall quality of life and avoid frequent medical facility trips. Growing adoption of self-administered parenteral as a valuable tool in pain management is expected to boost the segment.

Parenteral medications, such as infusions and injections, provide faster and more effective pain relief compared to oral medications. Similarly, products like patient-controlled analgesia pumps offer improved control for patients.

Reduced Risk of Infection Making Disposable Parenteral Products Popular

Market Growth Outlook by Key Usage

Usage Value CAGR
Disposable 4.3%
Reusable 5.6%

The disposable segment dominated the global market with a 46.2% market share in 2025. Over the forecast period, it is projected to advance at a CAGR of 4.3%. This is attributable to rising patient preference for disposable self-administered parenteral products due to their convenience and reduced risk of infection.

The increased focus on hygiene and safety in healthcare procedures is playing a key role in driving demand for disposable solutions. Similarly, the growing prevalence of infectious diseases is expected to boost the target segment.

Disposable devices provide a one-time solution, removing the possibility of infection and contamination that comes with reusable options. This is especially important for parenteral administration, where sterility is of utmost importance because drugs are injected straight into the circulation, bypassing the body's natural defenses.

Time-consuming sterilizing procedures between patients are avoided by using disposable devices. These devices reduce the possibility of cross-contamination between patients, which aids in maintaining a high level of infection control. Because single-use devices are disposed of after each use, sterilization is not required, and there is less chance of infectious organisms spreading.

Hospital Pharmacies Remain the Preferred Distribution Channel among Patients

Market Growth Outlook by Key Distribution Channel

Distribution Channel Value CAGR
Hospital Pharmacies 3.9%
Online Pharmacies 4.7%
Home Healthcare Providers 4.2%
Specialty Clinics 6.0%
Others 7.4%

Based on distribution channel, the hospital pharmacies segment will continue to dominate the global self-administered parenteral market. It held a market share of 38.9% in 2025 and is projected to register a CAGR of 3.9% throughout the forecast period.

Hospital pharmacies dominate this industry primarily because of their well-established infrastructure and proficiency in parenteral medicine administration. In most cases, hospitals have well-stocked pharmacies staffed by trained pharmacists who know how to prepare and administer injectable drugs.
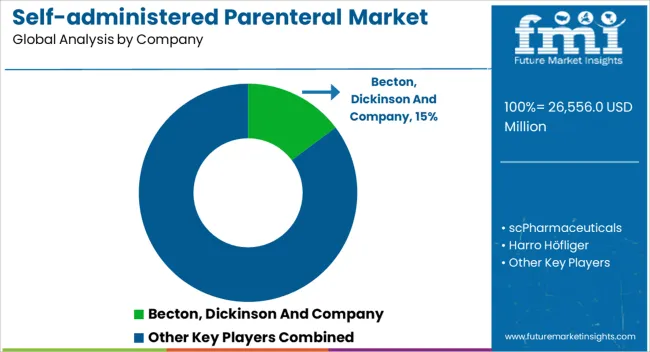
Competitive Landscape of the Self-administered Parenteral Market

Self Administered Parenteral Market Analysis By Company

Innovation has become a key success tool for manufacturers of self-administered parenteral products manufacturers. Similarly, the United States Food and Drug Administration (FDA) approval and expansion are a priority for leading self-administered parenteral product companies as they work to create new product lines and expand their global consumer base. Several companies also look to establish new facilities as well as adopt mergers and acquisitions to expand their presence.

Recent Developments in the Self-administered Parenteral Market

  • The first and only self-administered targeted B-cell treatment for patients with relapsed multiple sclerosis, Novartis Kesimpta® (ofatumumab), was authorized by the FDA in August 2024.
  • In June 2025, Becton, Dickinson, and Company expanded its presence with the inauguration of a €4 million (USD 4.48 million) research and development facility in Blackrock, Dublin. The company also announced a €30 million (USD 33.6 million) investment to expand its manufacturing facility in Enniscorthy, Wexford.
  • In May 2025, Coherus BioSciences, Inc. introduced the UDENYCA AI autoinjector in the United States.
  • In February 2025, a new disposable pen injector was launched by Philips-Medisize to accelerate the delivery of multiple drug therapies.

Scope and Coverage of the Self-administered Parenteral Industry Report

Attribute Details
Estimated Value (2025) USD 26556.0 million
Projected Value (2035) USD 42440.0 million
Expected Growth Rate (2025 to 2035) 4.8% CAGR
Forecast Period 2025 to 2035
Historical Data Available for 2020 to 2025
Market Analysis USD Million for Value
Key Regions Covered North America; Latin America; Europe; South Asia & Pacific; East Asia; Oceania; Middle East and Africa
Key Countries Covered United States, Canada, Mexico, Brazil, Chile, China, Japan, South Korea, India, ASEAN Countries, Australia & New Zealand, Germany, Italy, France, United Kingdom, Spain, BENELUX, Nordic Countries, Russia, Hungary, Poland, Saudi Arabia, Türkiye, South Africa, Other African Union.
Key Market Segments Covered Product, Application, Usage, Distribution Channel, and Region
Key Companies Profiled Becton; Dickinson and Company; scPharmaceuticals; Harro Höfliger; Owen Mumford; Haselmeier; Stevanato Group; Ypsomed AG; Solteam Group; AstraZeneca; Enable Injections; CCBio; Phillips-Medisize Corporation; Sorrel Medical; Krontec Healthcare; Subcuject Aps; Ascendia Pharmaceuticals; West Pharmaceutical Services, Inc.
Report Coverage Market Forecast, Competition Intelligence, Drivers, Restraints, Opportunities, Trend Analysis, Market Dynamics and Challenges, Strategic Growth Initiatives

Top Segments Covered in the Self-administered Parenteral Industry Research

By Product:

  • Pre-filled Syringes
  • Autoinjectors
  • Pen Injectors
  • Others

By Application:

  • Cardiovascular Diseases
  • Diabetes
  • Osteoporosis
  • Pain Management
  • Hormone Replacement
  • Others

By Usage:

  • Disposable
  • Reusable

By Distribution Channel:

  • Hospital Pharmacies
  • Online Pharmacies
  • Home Healthcare Providers
  • Specialty Clinics
  • Others

By Region:

  • North America
  • Latin America
  • East Asia
  • South Asia & Pacific
  • Western Europe
  • Eastern Europe
  • Middle East & Africa

Table of Content

  1. Executive Summary
    • Global Market Outlook
    • Demand-side Trends
    • Supply-side Trends
    • Technology Roadmap Analysis
    • Analysis and Recommendations
  2. Market Overview
    • Market Coverage / Taxonomy
    • Market Definition / Scope / Limitations
  3. Market Background
    • Market Dynamics
      • Drivers
      • Restraints
      • Opportunity
      • Trends
    • Scenario Forecast
      • Demand in Optimistic Scenario
      • Demand in Likely Scenario
      • Demand in Conservative Scenario
    • Opportunity Map Analysis
    • Product Life Cycle Analysis
    • Supply Chain Analysis
    • Investment Feasibility Matrix
    • Value Chain Analysis
    • PESTLE and Porter’s Analysis
    • Regulatory Landscape
    • Regional Parent Market Outlook
    • Production and Consumption Statistics
    • Import and Export Statistics
  4. Global Market Analysis 2020 to 2024 and Forecast, 2025 to 2035
    • Historical Market Size Value (USD Million) Analysis, 2020 to 2024
    • Current and Future Market Size Value (USD Million) Projections, 2025 to 2035
      • Y-o-Y Growth Trend Analysis
      • Absolute $ Opportunity Analysis
  5. Global Market Pricing Analysis 2020 to 2024 and Forecast 2025 to 2035
  6. Global Market Analysis 2020 to 2024 and Forecast 2025 to 2035, By Product
    • Introduction / Key Findings
    • Historical Market Size Value (USD Million) Analysis By Product , 2020 to 2024
    • Current and Future Market Size Value (USD Million) Analysis and Forecast By Product , 2025 to 2035
      • Pre-Filled Syringes
      • Autoinjectors
      • Pen Injectors
      • Others
    • Y-o-Y Growth Trend Analysis By Product , 2020 to 2024
    • Absolute $ Opportunity Analysis By Product , 2025 to 2035
  7. Global Market Analysis 2020 to 2024 and Forecast 2025 to 2035, By Application
    • Introduction / Key Findings
    • Historical Market Size Value (USD Million) Analysis By Application, 2020 to 2024
    • Current and Future Market Size Value (USD Million) Analysis and Forecast By Application, 2025 to 2035
      • Diabetes
      • Cardiovascular Diseases
      • Osteoporosis
      • Pain Management
      • Hormone Replacement
      • Others
    • Y-o-Y Growth Trend Analysis By Application, 2020 to 2024
    • Absolute $ Opportunity Analysis By Application, 2025 to 2035
  8. Global Market Analysis 2020 to 2024 and Forecast 2025 to 2035, By Usage
    • Introduction / Key Findings
    • Historical Market Size Value (USD Million) Analysis By Usage, 2020 to 2024
    • Current and Future Market Size Value (USD Million) Analysis and Forecast By Usage, 2025 to 2035
      • Disposable
      • Reusable
    • Y-o-Y Growth Trend Analysis By Usage, 2020 to 2024
    • Absolute $ Opportunity Analysis By Usage, 2025 to 2035
  9. Global Market Analysis 2020 to 2024 and Forecast 2025 to 2035, By Distribution Channel
    • Introduction / Key Findings
    • Historical Market Size Value (USD Million) Analysis By Distribution Channel, 2020 to 2024
    • Current and Future Market Size Value (USD Million) Analysis and Forecast By Distribution Channel, 2025 to 2035
      • Hospital Pharmacies
      • Online Pharmacies
      • Home Healthcare Providers
      • Specialty Clinics
      • Others
    • Y-o-Y Growth Trend Analysis By Distribution Channel, 2020 to 2024
    • Absolute $ Opportunity Analysis By Distribution Channel, 2025 to 2035
  10. Global Market Analysis 2020 to 2024 and Forecast 2025 to 2035, By Region
    • Introduction
    • Historical Market Size Value (USD Million) Analysis By Region, 2020 to 2024
    • Current Market Size Value (USD Million) Analysis and Forecast By Region, 2025 to 2035
      • North America
      • Latin America
      • Western Europe
      • Eastern Europe
      • East Asia
      • South Asia and Pacific
      • Middle East & Africa
    • Market Attractiveness Analysis By Region
  11. North America Market Analysis 2020 to 2024 and Forecast 2025 to 2035, By Country
    • Historical Market Size Value (USD Million) Trend Analysis By Market Taxonomy, 2020 to 2024
    • Market Size Value (USD Million) Forecast By Market Taxonomy, 2025 to 2035
      • By Country
        • USA
        • Canada
        • Mexico
      • By Product
      • By Application
      • By Usage
      • By Distribution Channel
    • Market Attractiveness Analysis
      • By Country
      • By Product
      • By Application
      • By Usage
      • By Distribution Channel
    • Key Takeaways
  12. Latin America Market Analysis 2020 to 2024 and Forecast 2025 to 2035, By Country
    • Historical Market Size Value (USD Million) Trend Analysis By Market Taxonomy, 2020 to 2024
    • Market Size Value (USD Million) Forecast By Market Taxonomy, 2025 to 2035
      • By Country
        • Brazil
        • Chile
        • Rest of Latin America
      • By Product
      • By Application
      • By Usage
      • By Distribution Channel
    • Market Attractiveness Analysis
      • By Country
      • By Product
      • By Application
      • By Usage
      • By Distribution Channel
    • Key Takeaways
  13. Western Europe Market Analysis 2020 to 2024 and Forecast 2025 to 2035, By Country
    • Historical Market Size Value (USD Million) Trend Analysis By Market Taxonomy, 2020 to 2024
    • Market Size Value (USD Million) Forecast By Market Taxonomy, 2025 to 2035
      • By Country
        • Germany
        • UK
        • Italy
        • Spain
        • France
        • Nordic
        • BENELUX
        • Rest of Western Europe
      • By Product
      • By Application
      • By Usage
      • By Distribution Channel
    • Market Attractiveness Analysis
      • By Country
      • By Product
      • By Application
      • By Usage
      • By Distribution Channel
    • Key Takeaways
  14. Eastern Europe Market Analysis 2020 to 2024 and Forecast 2025 to 2035, By Country
    • Historical Market Size Value (USD Million) Trend Analysis By Market Taxonomy, 2020 to 2024
    • Market Size Value (USD Million) Forecast By Market Taxonomy, 2025 to 2035
      • By Country
        • Russia
        • Poland
        • Hungary
        • Balkan & Baltic
        • Rest of Eastern Europe
      • By Product
      • By Application
      • By Usage
      • By Distribution Channel
    • Market Attractiveness Analysis
      • By Country
      • By Product
      • By Application
      • By Usage
      • By Distribution Channel
    • Key Takeaways
  15. East Asia Market Analysis 2020 to 2024 and Forecast 2025 to 2035, By Country
    • Historical Market Size Value (USD Million) Trend Analysis By Market Taxonomy, 2020 to 2024
    • Market Size Value (USD Million) Forecast By Market Taxonomy, 2025 to 2035
      • By Country
        • China
        • Japan
        • South Korea
      • By Product
      • By Application
      • By Usage
      • By Distribution Channel
    • Market Attractiveness Analysis
      • By Country
      • By Product
      • By Application
      • By Usage
      • By Distribution Channel
    • Key Takeaways
  16. South Asia and Pacific Market Analysis 2020 to 2024 and Forecast 2025 to 2035, By Country
    • Historical Market Size Value (USD Million) Trend Analysis By Market Taxonomy, 2020 to 2024
    • Market Size Value (USD Million) Forecast By Market Taxonomy, 2025 to 2035
      • By Country
        • India
        • ASEAN
        • Australia & New Zealand
        • Rest of South Asia and Pacific
      • By Product
      • By Application
      • By Usage
      • By Distribution Channel
    • Market Attractiveness Analysis
      • By Country
      • By Product
      • By Application
      • By Usage
      • By Distribution Channel
    • Key Takeaways
  17. Middle East & Africa Market Analysis 2020 to 2024 and Forecast 2025 to 2035, By Country
    • Historical Market Size Value (USD Million) Trend Analysis By Market Taxonomy, 2020 to 2024
    • Market Size Value (USD Million) Forecast By Market Taxonomy, 2025 to 2035
      • By Country
        • Kingdom of Saudi Arabia
        • Other GCC Countries
        • Turkiye
        • South Africa
        • Other African Union
        • Rest of Middle East & Africa
      • By Product
      • By Application
      • By Usage
      • By Distribution Channel
    • Market Attractiveness Analysis
      • By Country
      • By Product
      • By Application
      • By Usage
      • By Distribution Channel
    • Key Takeaways
  18. Key Countries Market Analysis
    • USA
      • Pricing Analysis
      • Market Share Analysis, 2024
        • By Product
        • By Application
        • By Usage
        • By Distribution Channel
    • Canada
      • Pricing Analysis
      • Market Share Analysis, 2024
        • By Product
        • By Application
        • By Usage
        • By Distribution Channel
    • Mexico
      • Pricing Analysis
      • Market Share Analysis, 2024
        • By Product
        • By Application
        • By Usage
        • By Distribution Channel
    • Brazil
      • Pricing Analysis
      • Market Share Analysis, 2024
        • By Product
        • By Application
        • By Usage
        • By Distribution Channel
    • Chile
      • Pricing Analysis
      • Market Share Analysis, 2024
        • By Product
        • By Application
        • By Usage
        • By Distribution Channel
    • Germany
      • Pricing Analysis
      • Market Share Analysis, 2024
        • By Product
        • By Application
        • By Usage
        • By Distribution Channel
    • UK
      • Pricing Analysis
      • Market Share Analysis, 2024
        • By Product
        • By Application
        • By Usage
        • By Distribution Channel
    • Italy
      • Pricing Analysis
      • Market Share Analysis, 2024
        • By Product
        • By Application
        • By Usage
        • By Distribution Channel
    • Spain
      • Pricing Analysis
      • Market Share Analysis, 2024
        • By Product
        • By Application
        • By Usage
        • By Distribution Channel
    • France
      • Pricing Analysis
      • Market Share Analysis, 2024
        • By Product
        • By Application
        • By Usage
        • By Distribution Channel
    • India
      • Pricing Analysis
      • Market Share Analysis, 2024
        • By Product
        • By Application
        • By Usage
        • By Distribution Channel
    • ASEAN
      • Pricing Analysis
      • Market Share Analysis, 2024
        • By Product
        • By Application
        • By Usage
        • By Distribution Channel
    • Australia & New Zealand
      • Pricing Analysis
      • Market Share Analysis, 2024
        • By Product
        • By Application
        • By Usage
        • By Distribution Channel
    • China
      • Pricing Analysis
      • Market Share Analysis, 2024
        • By Product
        • By Application
        • By Usage
        • By Distribution Channel
    • Japan
      • Pricing Analysis
      • Market Share Analysis, 2024
        • By Product
        • By Application
        • By Usage
        • By Distribution Channel
    • South Korea
      • Pricing Analysis
      • Market Share Analysis, 2024
        • By Product
        • By Application
        • By Usage
        • By Distribution Channel
    • Russia
      • Pricing Analysis
      • Market Share Analysis, 2024
        • By Product
        • By Application
        • By Usage
        • By Distribution Channel
    • Poland
      • Pricing Analysis
      • Market Share Analysis, 2024
        • By Product
        • By Application
        • By Usage
        • By Distribution Channel
    • Hungary
      • Pricing Analysis
      • Market Share Analysis, 2024
        • By Product
        • By Application
        • By Usage
        • By Distribution Channel
    • Kingdom of Saudi Arabia
      • Pricing Analysis
      • Market Share Analysis, 2024
        • By Product
        • By Application
        • By Usage
        • By Distribution Channel
    • Turkiye
      • Pricing Analysis
      • Market Share Analysis, 2024
        • By Product
        • By Application
        • By Usage
        • By Distribution Channel
    • South Africa
      • Pricing Analysis
      • Market Share Analysis, 2024
        • By Product
        • By Application
        • By Usage
        • By Distribution Channel
  19. Market Structure Analysis
    • Competition Dashboard
    • Competition Benchmarking
    • Market Share Analysis of Top Players
      • By Regional
      • By Product
      • By Application
      • By Usage
      • By Distribution Channel
  20. Competition Analysis
    • Competition Deep Dive
      • Becton, Dickinson And Company
        • Overview
        • Product Portfolio
        • Profitability by Market Segments (Product/Age /Sales Channel/Region)
        • Sales Footprint
        • Strategy Overview
          • Marketing Strategy
          • Product Strategy
          • Channel Strategy
      • scPharmaceuticals
      • Harro Höfliger
      • Owen Mumford
      • Haselmeier
      • Stevanato Group
      • Ypsomed AG
      • Solteam Group
      • AstraZeneca
      • Enable Injections
      • CCBio
      • Phillips-Medisize Corporation
      • Sorrel Medical
      • Krontec Healthcare
      • Subcuject Aps
      • Ascendia Pharmaceuticals
      • West Pharmaceutical Services, Inc.
  21. Assumptions & Acronyms Used
  22. Research Methodology

List of Tables

  • Table 1: Global Market Value (USD Million) Forecast by Region, 2020-2035
  • Table 2: Global Market Value (USD Million) Forecast by Product , 2020-2035
  • Table 3: Global Market Value (USD Million) Forecast by Application, 2020-2035
  • Table 4: Global Market Value (USD Million) Forecast by Usage, 2020-2035
  • Table 5: Global Market Value (USD Million) Forecast by Distribution Channel, 2020-2035
  • Table 6: North America Market Value (USD Million) Forecast by Country, 2020-2035
  • Table 7: North America Market Value (USD Million) Forecast by Product , 2020-2035
  • Table 8: North America Market Value (USD Million) Forecast by Application, 2020-2035
  • Table 9: North America Market Value (USD Million) Forecast by Usage, 2020-2035
  • Table 10: North America Market Value (USD Million) Forecast by Distribution Channel, 2020-2035
  • Table 11: Latin America Market Value (USD Million) Forecast by Country, 2020-2035
  • Table 12: Latin America Market Value (USD Million) Forecast by Product , 2020-2035
  • Table 13: Latin America Market Value (USD Million) Forecast by Application, 2020-2035
  • Table 14: Latin America Market Value (USD Million) Forecast by Usage, 2020-2035
  • Table 15: Latin America Market Value (USD Million) Forecast by Distribution Channel, 2020-2035
  • Table 16: Western Europe Market Value (USD Million) Forecast by Country, 2020-2035
  • Table 17: Western Europe Market Value (USD Million) Forecast by Product , 2020-2035
  • Table 18: Western Europe Market Value (USD Million) Forecast by Application, 2020-2035
  • Table 19: Western Europe Market Value (USD Million) Forecast by Usage, 2020-2035
  • Table 20: Western Europe Market Value (USD Million) Forecast by Distribution Channel, 2020-2035
  • Table 21: Eastern Europe Market Value (USD Million) Forecast by Country, 2020-2035
  • Table 22: Eastern Europe Market Value (USD Million) Forecast by Product , 2020-2035
  • Table 23: Eastern Europe Market Value (USD Million) Forecast by Application, 2020-2035
  • Table 24: Eastern Europe Market Value (USD Million) Forecast by Usage, 2020-2035
  • Table 25: Eastern Europe Market Value (USD Million) Forecast by Distribution Channel, 2020-2035
  • Table 26: East Asia Market Value (USD Million) Forecast by Country, 2020-2035
  • Table 27: East Asia Market Value (USD Million) Forecast by Product , 2020-2035
  • Table 28: East Asia Market Value (USD Million) Forecast by Application, 2020-2035
  • Table 29: East Asia Market Value (USD Million) Forecast by Usage, 2020-2035
  • Table 30: East Asia Market Value (USD Million) Forecast by Distribution Channel, 2020-2035
  • Table 31: South Asia and Pacific Market Value (USD Million) Forecast by Country, 2020-2035
  • Table 32: South Asia and Pacific Market Value (USD Million) Forecast by Product , 2020-2035
  • Table 33: South Asia and Pacific Market Value (USD Million) Forecast by Application, 2020-2035
  • Table 34: South Asia and Pacific Market Value (USD Million) Forecast by Usage, 2020-2035
  • Table 35: South Asia and Pacific Market Value (USD Million) Forecast by Distribution Channel, 2020-2035
  • Table 36: Middle East & Africa Market Value (USD Million) Forecast by Country, 2020-2035
  • Table 37: Middle East & Africa Market Value (USD Million) Forecast by Product , 2020-2035
  • Table 38: Middle East & Africa Market Value (USD Million) Forecast by Application, 2020-2035
  • Table 39: Middle East & Africa Market Value (USD Million) Forecast by Usage, 2020-2035
  • Table 40: Middle East & Africa Market Value (USD Million) Forecast by Distribution Channel, 2020-2035

List of Figures

  • Figure 1: Global Market Pricing Analysis
  • Figure 2: Global Market Value (USD Million) Forecast 2020-2035
  • Figure 3: Global Market Value Share and BPS Analysis by Product , 2025 and 2035
  • Figure 4: Global Market Y-o-Y Growth Comparison by Product , 2025-2035
  • Figure 5: Global Market Attractiveness Analysis by Product
  • Figure 6: Global Market Value Share and BPS Analysis by Application, 2025 and 2035
  • Figure 7: Global Market Y-o-Y Growth Comparison by Application, 2025-2035
  • Figure 8: Global Market Attractiveness Analysis by Application
  • Figure 9: Global Market Value Share and BPS Analysis by Usage, 2025 and 2035
  • Figure 10: Global Market Y-o-Y Growth Comparison by Usage, 2025-2035
  • Figure 11: Global Market Attractiveness Analysis by Usage
  • Figure 12: Global Market Value Share and BPS Analysis by Distribution Channel, 2025 and 2035
  • Figure 13: Global Market Y-o-Y Growth Comparison by Distribution Channel, 2025-2035
  • Figure 14: Global Market Attractiveness Analysis by Distribution Channel
  • Figure 15: Global Market Value (USD Million) Share and BPS Analysis by Region, 2025 and 2035
  • Figure 16: Global Market Y-o-Y Growth Comparison by Region, 2025-2035
  • Figure 17: Global Market Attractiveness Analysis by Region
  • Figure 18: North America Market Incremental Dollar Opportunity, 2025-2035
  • Figure 19: Latin America Market Incremental Dollar Opportunity, 2025-2035
  • Figure 20: Western Europe Market Incremental Dollar Opportunity, 2025-2035
  • Figure 21: Eastern Europe Market Incremental Dollar Opportunity, 2025-2035
  • Figure 22: East Asia Market Incremental Dollar Opportunity, 2025-2035
  • Figure 23: South Asia and Pacific Market Incremental Dollar Opportunity, 2025-2035
  • Figure 24: Middle East & Africa Market Incremental Dollar Opportunity, 2025-2035
  • Figure 25: North America Market Value Share and BPS Analysis by Country, 2025 and 2035
  • Figure 26: North America Market Value Share and BPS Analysis by Product , 2025 and 2035
  • Figure 27: North America Market Y-o-Y Growth Comparison by Product , 2025-2035
  • Figure 28: North America Market Attractiveness Analysis by Product
  • Figure 29: North America Market Value Share and BPS Analysis by Application, 2025 and 2035
  • Figure 30: North America Market Y-o-Y Growth Comparison by Application, 2025-2035
  • Figure 31: North America Market Attractiveness Analysis by Application
  • Figure 32: North America Market Value Share and BPS Analysis by Usage, 2025 and 2035
  • Figure 33: North America Market Y-o-Y Growth Comparison by Usage, 2025-2035
  • Figure 34: North America Market Attractiveness Analysis by Usage
  • Figure 35: North America Market Value Share and BPS Analysis by Distribution Channel, 2025 and 2035
  • Figure 36: North America Market Y-o-Y Growth Comparison by Distribution Channel, 2025-2035
  • Figure 37: North America Market Attractiveness Analysis by Distribution Channel
  • Figure 38: Latin America Market Value Share and BPS Analysis by Country, 2025 and 2035
  • Figure 39: Latin America Market Value Share and BPS Analysis by Product , 2025 and 2035
  • Figure 40: Latin America Market Y-o-Y Growth Comparison by Product , 2025-2035
  • Figure 41: Latin America Market Attractiveness Analysis by Product
  • Figure 42: Latin America Market Value Share and BPS Analysis by Application, 2025 and 2035
  • Figure 43: Latin America Market Y-o-Y Growth Comparison by Application, 2025-2035
  • Figure 44: Latin America Market Attractiveness Analysis by Application
  • Figure 45: Latin America Market Value Share and BPS Analysis by Usage, 2025 and 2035
  • Figure 46: Latin America Market Y-o-Y Growth Comparison by Usage, 2025-2035
  • Figure 47: Latin America Market Attractiveness Analysis by Usage
  • Figure 48: Latin America Market Value Share and BPS Analysis by Distribution Channel, 2025 and 2035
  • Figure 49: Latin America Market Y-o-Y Growth Comparison by Distribution Channel, 2025-2035
  • Figure 50: Latin America Market Attractiveness Analysis by Distribution Channel
  • Figure 51: Western Europe Market Value Share and BPS Analysis by Country, 2025 and 2035
  • Figure 52: Western Europe Market Value Share and BPS Analysis by Product , 2025 and 2035
  • Figure 53: Western Europe Market Y-o-Y Growth Comparison by Product , 2025-2035
  • Figure 54: Western Europe Market Attractiveness Analysis by Product
  • Figure 55: Western Europe Market Value Share and BPS Analysis by Application, 2025 and 2035
  • Figure 56: Western Europe Market Y-o-Y Growth Comparison by Application, 2025-2035
  • Figure 57: Western Europe Market Attractiveness Analysis by Application
  • Figure 58: Western Europe Market Value Share and BPS Analysis by Usage, 2025 and 2035
  • Figure 59: Western Europe Market Y-o-Y Growth Comparison by Usage, 2025-2035
  • Figure 60: Western Europe Market Attractiveness Analysis by Usage
  • Figure 61: Western Europe Market Value Share and BPS Analysis by Distribution Channel, 2025 and 2035
  • Figure 62: Western Europe Market Y-o-Y Growth Comparison by Distribution Channel, 2025-2035
  • Figure 63: Western Europe Market Attractiveness Analysis by Distribution Channel
  • Figure 64: Eastern Europe Market Value Share and BPS Analysis by Country, 2025 and 2035
  • Figure 65: Eastern Europe Market Value Share and BPS Analysis by Product , 2025 and 2035
  • Figure 66: Eastern Europe Market Y-o-Y Growth Comparison by Product , 2025-2035
  • Figure 67: Eastern Europe Market Attractiveness Analysis by Product
  • Figure 68: Eastern Europe Market Value Share and BPS Analysis by Application, 2025 and 2035
  • Figure 69: Eastern Europe Market Y-o-Y Growth Comparison by Application, 2025-2035
  • Figure 70: Eastern Europe Market Attractiveness Analysis by Application
  • Figure 71: Eastern Europe Market Value Share and BPS Analysis by Usage, 2025 and 2035
  • Figure 72: Eastern Europe Market Y-o-Y Growth Comparison by Usage, 2025-2035
  • Figure 73: Eastern Europe Market Attractiveness Analysis by Usage
  • Figure 74: Eastern Europe Market Value Share and BPS Analysis by Distribution Channel, 2025 and 2035
  • Figure 75: Eastern Europe Market Y-o-Y Growth Comparison by Distribution Channel, 2025-2035
  • Figure 76: Eastern Europe Market Attractiveness Analysis by Distribution Channel
  • Figure 77: East Asia Market Value Share and BPS Analysis by Country, 2025 and 2035
  • Figure 78: East Asia Market Value Share and BPS Analysis by Product , 2025 and 2035
  • Figure 79: East Asia Market Y-o-Y Growth Comparison by Product , 2025-2035
  • Figure 80: East Asia Market Attractiveness Analysis by Product
  • Figure 81: East Asia Market Value Share and BPS Analysis by Application, 2025 and 2035
  • Figure 82: East Asia Market Y-o-Y Growth Comparison by Application, 2025-2035
  • Figure 83: East Asia Market Attractiveness Analysis by Application
  • Figure 84: East Asia Market Value Share and BPS Analysis by Usage, 2025 and 2035
  • Figure 85: East Asia Market Y-o-Y Growth Comparison by Usage, 2025-2035
  • Figure 86: East Asia Market Attractiveness Analysis by Usage
  • Figure 87: East Asia Market Value Share and BPS Analysis by Distribution Channel, 2025 and 2035
  • Figure 88: East Asia Market Y-o-Y Growth Comparison by Distribution Channel, 2025-2035
  • Figure 89: East Asia Market Attractiveness Analysis by Distribution Channel
  • Figure 90: South Asia and Pacific Market Value Share and BPS Analysis by Country, 2025 and 2035
  • Figure 91: South Asia and Pacific Market Value Share and BPS Analysis by Product , 2025 and 2035
  • Figure 92: South Asia and Pacific Market Y-o-Y Growth Comparison by Product , 2025-2035
  • Figure 93: South Asia and Pacific Market Attractiveness Analysis by Product
  • Figure 94: South Asia and Pacific Market Value Share and BPS Analysis by Application, 2025 and 2035
  • Figure 95: South Asia and Pacific Market Y-o-Y Growth Comparison by Application, 2025-2035
  • Figure 96: South Asia and Pacific Market Attractiveness Analysis by Application
  • Figure 97: South Asia and Pacific Market Value Share and BPS Analysis by Usage, 2025 and 2035
  • Figure 98: South Asia and Pacific Market Y-o-Y Growth Comparison by Usage, 2025-2035
  • Figure 99: South Asia and Pacific Market Attractiveness Analysis by Usage
  • Figure 100: South Asia and Pacific Market Value Share and BPS Analysis by Distribution Channel, 2025 and 2035
  • Figure 101: South Asia and Pacific Market Y-o-Y Growth Comparison by Distribution Channel, 2025-2035
  • Figure 102: South Asia and Pacific Market Attractiveness Analysis by Distribution Channel
  • Figure 103: Middle East & Africa Market Value Share and BPS Analysis by Country, 2025 and 2035
  • Figure 104: Middle East & Africa Market Value Share and BPS Analysis by Product , 2025 and 2035
  • Figure 105: Middle East & Africa Market Y-o-Y Growth Comparison by Product , 2025-2035
  • Figure 106: Middle East & Africa Market Attractiveness Analysis by Product
  • Figure 107: Middle East & Africa Market Value Share and BPS Analysis by Application, 2025 and 2035
  • Figure 108: Middle East & Africa Market Y-o-Y Growth Comparison by Application, 2025-2035
  • Figure 109: Middle East & Africa Market Attractiveness Analysis by Application
  • Figure 110: Middle East & Africa Market Value Share and BPS Analysis by Usage, 2025 and 2035
  • Figure 111: Middle East & Africa Market Y-o-Y Growth Comparison by Usage, 2025-2035
  • Figure 112: Middle East & Africa Market Attractiveness Analysis by Usage
  • Figure 113: Middle East & Africa Market Value Share and BPS Analysis by Distribution Channel, 2025 and 2035
  • Figure 114: Middle East & Africa Market Y-o-Y Growth Comparison by Distribution Channel, 2025-2035
  • Figure 115: Middle East & Africa Market Attractiveness Analysis by Distribution Channel
  • Figure 116: Global Market - Tier Structure Analysis
  • Figure 117: Global Market - Company Share Analysis

Frequently Asked Questions

How big is the self-administered parenteral market in 2025?

The global self-administered parenteral market is estimated to be valued at USD 26,556.0 million in 2025.

What will be the size of self-administered parenteral market in 2035?

The market size for the self-administered parenteral market is projected to reach USD 42,440.0 million by 2035.

How much will be the self-administered parenteral market growth between 2025 and 2035?

The self-administered parenteral market is expected to grow at a 4.8% CAGR between 2025 and 2035.

What are the key product types in the self-administered parenteral market?

The key product types in self-administered parenteral market are pre-filled syringes, autoinjectors, pen injectors and others.

Which application segment to contribute significant share in the self-administered parenteral market in 2025?

In terms of application, diabetes segment to command 36.4% share in the self-administered parenteral market in 2025.

Explore Similar Insights

Future Market Insights

Self-administered Parenteral Market

Chat With MaRIA

Chat With

MaRIA

Hi There, I am MaRIA, Your Market Research Intelligence Assistant. How may I help you?