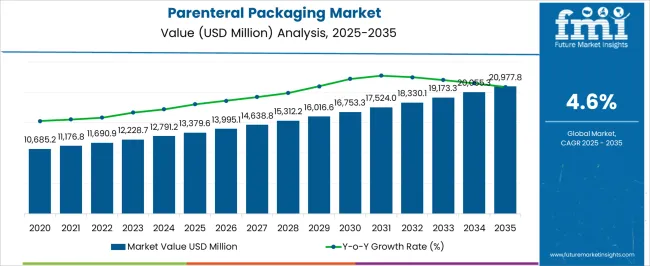
The Parenteral Packaging Market is estimated to be valued at USD 13379.6 million in 2025 and is projected to reach USD 20977.8 million by 2035, registering a compound annual growth rate (CAGR) of 4.6% over the forecast period.
| Metric | Value |
|---|---|
| Parenteral Packaging Market Estimated Value in (2025 E) | USD 13379.6 million |
| Parenteral Packaging Market Forecast Value in (2035 F) | USD 20977.8 million |
| Forecast CAGR (2025 to 2035) | 4.6% |
The parenteral packaging market is advancing steadily, supported by rising demand for sterile, safe, and convenient packaging formats in pharmaceutical and biotechnology industries. Increasing prevalence of chronic diseases, the expansion of biologics and vaccines, and growth in injectable therapies have accelerated adoption.
The market benefits from regulatory emphasis on patient safety and contamination prevention, which has driven investments in high-quality, tamper-evident packaging systems. Glass and polymer-based formats dominate production, with continuous innovation focused on minimizing breakage risk and improving barrier performance.
Demand is also reinforced by the rise in self-administration therapies, requiring user-friendly small-volume packaging options. Looking forward, the market is expected to grow with continued biologics innovation, outsourcing of drug manufacturing, and the need for advanced packaging systems that ensure product stability and extend shelf life.
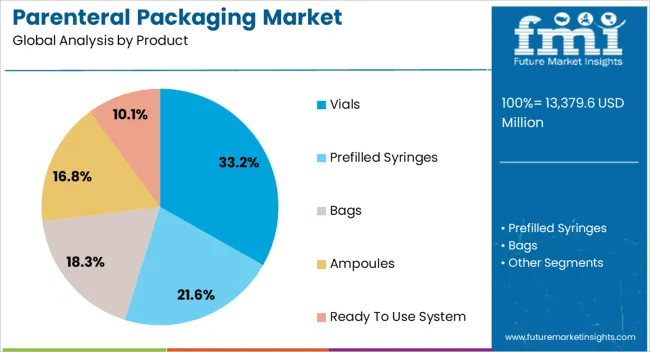
The vials segment leads the product category with approximately 33.20% share of the parenteral packaging market. This leadership is supported by the segment’s suitability for packaging a wide range of liquid and lyophilized drugs.
Vials offer flexibility in volume customization, robust sealing options, and compatibility with both manual and automated filling lines. The segment’s dominance is reinforced by high demand in vaccines and biologics, where vials are a preferred packaging choice due to stability and contamination resistance.
Their reusability in laboratory and clinical settings further supports adoption. With strong global demand for injectable formulations and expanding vaccine distribution networks, vials are projected to retain their significant share in the foreseeable future.
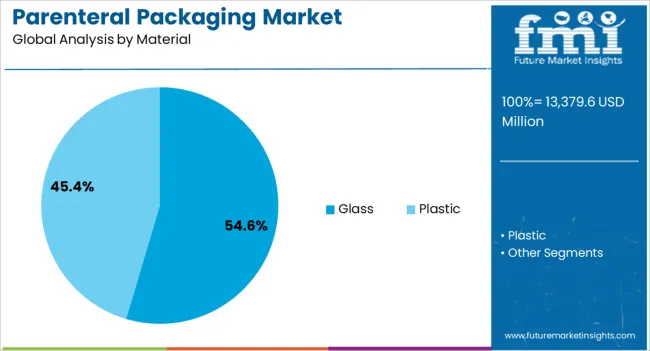
The glass segment dominates the material category with approximately 54.60% share, attributed to its inertness, durability, and regulatory acceptance for pharmaceutical packaging. Glass provides strong barrier properties, ensuring drug stability and protection against external contaminants.
Type I borosilicate glass is widely used in high-value biologics and sensitive formulations, reinforcing the material’s credibility in sterile packaging. Despite rising interest in high-performance polymers, glass remains the standard choice due to established filling infrastructure and scalability.
The segment’s growth is supported by technological innovations such as coated and strengthened glass vials that minimize breakage risks. With ongoing expansion of injectable therapies and stringent quality requirements, the glass segment is expected to sustain its leading position.
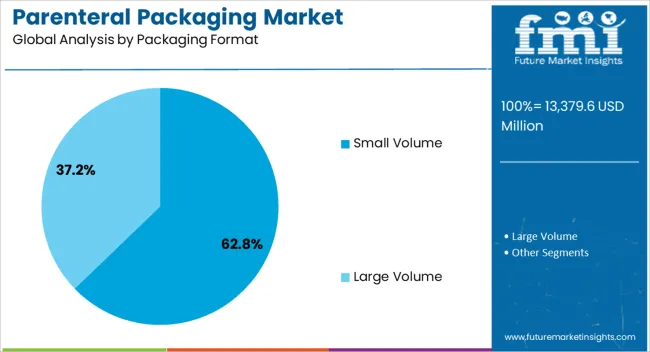
The small volume segment leads the packaging format category, holding approximately 62.80% share of the parenteral packaging market. This dominance is driven by the rising demand for personalized medicine, self-administration therapies, and biologics that require precise dosages.
Small volume packaging ensures ease of handling, reduced risk of contamination, and efficient distribution logistics. Pharmaceutical companies favor this format for high-value drugs, enabling controlled dispensing and minimizing wastage.
Growth is further supported by expanding demand for vaccines and targeted injectable formulations, where smaller unit volumes align with clinical requirements. With increasing focus on patient-centric packaging and the prevalence of biologics requiring specialized handling, the small volume segment is projected to maintain its leadership during the forecast period.
The global market of parenteral packaging recorded a CAGR of 3.8% during the historical period. Total market valuation at the end of 2025 reached about USD 12,235.4 million. In the forecast period, parenteral packaging demand is poised to increase at a 4.6% CAGR.
The parenteral packaging market is anticipated to witness a positive growth trajectory. With glass and plastic offering various advantages in the healthcare industry, there is a rising demand for a primary protective system.
The sale of primary packaging for parenteral products is on the rise. Parenteral packaging has a significant role in the pharmaceutical industry as it offers great stability and safety to stored medical formulations.
Parenteral packaging is intended to protect the product from the external environment and keep the drug intact till it is administered. It is used for sterile medications that are administered by infusion or injection. The growing need for protecting sensitive drugs from environmental factors is expected to fuel demand for parenteral packaging.
Rising focus on enhancing patient safety and convenience is triggering innovation in parenteral drug packaging. Prefilled syringes, ready-to-mix systems, and vials with tamper-evident closures are gaining immense traction. This is due to their ability to minimize medication errors and improve ease of administration.
There has been significant growth in spending on sterile parenteral contract services. This, in turn, is expected to create growth opportunities for parenteral packaging manufacturers during the assessment period.
The prevalence of diabetes and other chronic diseases is rising sharply. According to the World Health Organization (WHO), around 783 people will be living with diabetes in 2045. This will create high demand for insulin as well as parenteral packaging solutions
Ongoing advancements in drug delivery technologies, such as pre-filled syringes, vials, and cartridges, contribute to the growth of the parenteral packaging market. These technologies enhance patient convenience, reduce the risk of contamination, and improve overall drug stability.
There is an increasing demand for healthcare products such as prefilled syringes and vials. This is expected to impact the growth of the parenteral packaging market on a positive note. Similarly, the development of new biotechnology products with specific requirements will create growth prospects.
Leading companies are constantly integrating automated systems to increase productivity, minimize contamination risks, and reduce costs. This will bode well for the parenteral packaging industry.
Top parenteral packaging companies are using new raw materials for their products to woo more and more customers. Sourcing and final packaging of raw materials between the manufacturers and the suppliers are creating an effective collaboration across the globe.
Polymers are gaining significant attention in manufacturing parenteral packaging. This is due to their advantages like break-free nature and high tensile strength compared to glass and plastic. The new packaging solutions made from these polymers are quite favorable for newly developed pharmaceutical drugs.
The packaging industry is shifting towards manufacturing multi-compartment packaging products to fit various products efficiently. This trend is positively impacting the parenteral packaging industry.
Manufacturers of parenteral products are focusing more on providing two drugs in a single administering dose, such as IV bags and prefilled syringes. The innovative packaging solutions of double and triple chambers are required to minimize major issues such as entry of pathogens, contamination, and sepsis.
The rising trend of self-medication in developed countries is expected to drive the sales of parenteral packaging. Subsequently, the increasing need for biologics and other novel drugs will likely boost the growth of the parenteral packaging industry.
| Particular | Value CAGR |
|---|---|
| H1 | 4.5% (2025 to 2035) |
| H2 | 3.9% (2025 to 2035) |
| H1 | 3.5% (2025 to 2035) |
| H2 | 4.0% (2025 to 2035) |
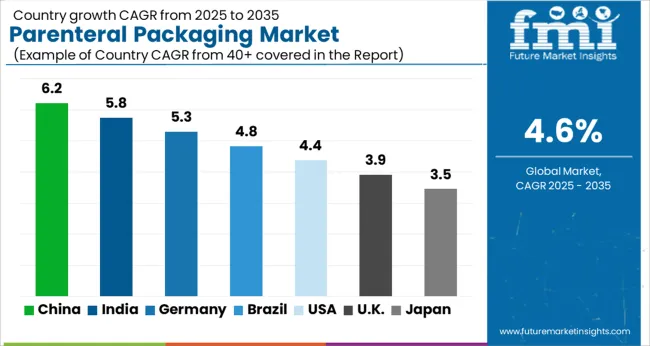
North America, spearheaded by the United States, is set to continue to lead the global market with a value share of around 25.2% in 2035. As per the latest analysis, the North America parenteral packaging market is poised to expand at 4.0% CAGR, totaling USD 5,070.9 million by 2035.
This is attributable to the expanding pharmaceutical industry, growing demand for injectable drug packaging, and the presence of leading parenteral packaging companies.
Asia Pacific’s parenteral packaging market is set to witness robust growth during the forecast period. This can be attributable to the rising incidence of chronic and infectious diseases, the growing need for pharmaceutical vial packaging, and the rise in vaccination programs.
As per the latest analysis, sales of parenteral packaging products in Canada are projected to rise at a CAGR of 6.0% during the forecast period. By 2035, Canada’s parenteral packaging market size is set to reach USD 1,882.1 million. This can be attributed to factors like
Canada is witnessing a strong demand for high-quality medical solutions. This is due to the growing prevalence of chronic diseases and rising health awareness. Driven by this, sales of parenteral packaging in the country will likely surge rapidly through 2035.
Another prominent factor expected to boost the growth of the parenteral packaging market in Canada is the rising healthcare spending. According to the Canadian Institute for Health Information, Canada’s total health spending reached around USD 13379.6 billion in 2025. This is expected to create growth opportunities for parenteral packaging manufacturers.
India’s parenteral packaging market value is projected to increase from USD 1,165.4 million in 2025 to USD 2,203.7 million by 2035. Overall demand for parenteral packaging in India will likely rise at 6.6% CAGR during the forecast period, driven by factors like:
India’s pharmaceutical sector is ranked third in terms of pharma production volume, growing at a CAGR of 9.4% in the past nine years. According to the Indian Brand Equity Presentation (IBEF), the country’s pharmaceutical sector supplies over 50% of the global demand for several vaccines.
The total market size of India’s pharma industry is expected to reach USD 20977.8 billion by 2035. The domestic pharmaceutical industry will likely reach USD 57 billion by FY25. This will continue to uplift parenteral packaging market demand across India.
The low cost of production and the increase in research and development expenditure are providing pharma companies with a huge business opportunity for the domestic market. As parenteral packaging offers an extended shelf life for pharmaceutical drugs, its demand is expected to rise rapidly through 2035.
The rising need for high-quality packaging for injectable drugs is anticipated to improve India’s parenteral packaging market share during the assessment period.
The below section shows the prefilled syringes segment dominating the parenteral drug packaging market. It is estimated to hold a value share of 39.6% in 2035.
Based on material, the plastic segment is expected to hold a prominent market share of 56.1% in 2035, while the glass category will likely expand at a high CAGR of 4.7% during the assessment period.
| Product | Expected Value CAGR |
|---|---|
| Vials | 6.0% |
| Prefilled Syringes | 5.3% |
The prefilled syringes segment dominates the parenteral packaging industry, which is expected to continue during the forecast period. It is poised to expand at 5.3% CAGR, holding a share of 39.6% in the parenteral drug packaging market at the end of 2035. This is attributable to factors like:
Demand for prefilled syringes has significantly increased since the COVID-19 outbreak. These products cater to the increasing need for safe and convenient medication delivery methods.
Prefilled syringes are particularly useful for self-administration because they are pre-loaded with a precise medication dosage. They minimize the risk of medication overdoses and underdoses that can happen with vials and ampoules.
The usage of prefilled syringes minimizes drug wastage as well as increases the lifespan of the drug. They are becoming an efficient, convenient, and reliable product for the healthcare industry. The growing popularity of prefilled syringes due to their multiple benefits will continue to boost the target segment as well as the market.
| Material | Value CAGR |
|---|---|
| Glass | 4.7% |
| Plastic | 4.6% |
The plastic segment is expected to hold a dominant market share of 56.1% in 2035. Over the forecast period, the target segment will likely expand at a CAGR of 4.6%, totaling USD 11,288.2 million by 2035.
Plastic remains the most preferred material for parenteral packaging. This is due to the growing popularity of plastic-based parenteral packaging like vials and ampoules. Leading parenteral packaging manufacturers are using plastic for making their products, owing to its attractive benefits like:
Plastic material is less fragile and less prone to breakage than alternate packaging solutions such as glass. As a result, it is widely used for producing parenteral packaging products.
Another factor expected to boost the target segment is the growing popularity of bioplastics. Amid the crackdown on plastic usage, several manufacturers of parenteral packaging are shifting their preference towards using bioplastics. They are becoming an ideal alternative to traditional plastics for parenteral packaging.
On the other hand, the glass segment is set to witness a higher CAGR of 4.7% during the assessment period. This can be attributable to several benefits of glass, including superior barrier properties and excellent chemical resistance.
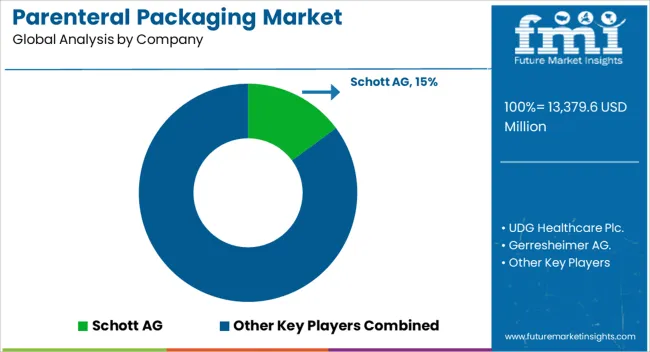
Top manufacturers of parenteral packaging are developing innovative designs catering to specific products or applications. They are also focusing on offering sustainable solutions made from eco-friendly and recycled materials.
Several parenteral packaging companies are integrating novel technologies like automation to improve product quality and reduce labor costs. The target market is also witnessing strategies like mergers, acquisitions, facility expansions, collaborations, distribution agreements, and partnerships.
Recent Developments in the Parenteral Packaging Market-
| Attribute | Details |
|---|---|
| Estimated Market Value (2025) | USD 12,791.2 million |
| Projected Market Value (2035) | USD 20,115.6 million |
| Expected Growth Rate (2025 to 2035) | 4.6% CAGR |
| Historical Data | 2020 to 2025 |
| Forecast Period | 2025 to 2035 |
| Quantitative Sq. Mt. | Revenue in USD million, Volume in tons, and CAGR from 2025 to 2035 |
| Report Coverage | Revenue Forecast, Volume Forecast, Company Ranking, Competitive Landscape, Growth Factors, Trends and Pricing Analysis |
| Segments Covered | Product, Material, Packaging Format, Region |
| Key Regions Covered | North America; Latin America; Asia Pacific Ex. Japan; Western Europe; Eastern Europe; Middle East & Africa; Japan |
| Key Companies Profiled | Schott AG; UDG Healthcare Plc.; Gerresheimer AG.; Becton, Dickinson and Company; Catalent Inc. Stevanato Group S.p.A; Baxter International Inc.; Nipro Corporation; West Pharmaceutical Services, Inc.; Adelphi Healthcare Packaging; Ypsomed Holding AG; Terumo Corporation; SiO2 Materials Science.; SGD Pharma; PCI Pharma Services; Ardena Holding NV; Berkshire Sterile Manufacturing; Akorn, Inc.; Alcami Corporation, Inc.; Berry Global Inc. |
The global parenteral packaging market is estimated to be valued at USD 13,379.6 million in 2025.
The market size for the parenteral packaging market is projected to reach USD 20,977.8 million by 2035.
The parenteral packaging market is expected to grow at a 4.6% CAGR between 2025 and 2035.
The key product types in parenteral packaging market are vials, prefilled syringes, bags, ampoules and ready to use system.
In terms of material, glass segment to command 54.6% share in the parenteral packaging market in 2025.


Full Research Suite comprises of:
Market outlook & trends analysis
Interviews & case studies
Strategic recommendations
Vendor profiles & capabilities analysis
5-year forecasts
8 regions and 60+ country-level data splits
Market segment data splits
12 months of continuous data updates
DELIVERED AS:
PDF EXCEL ONLINE
Market Share Breakdown of Parenteral Packaging Industry
Parenteral Drugs Packaging Market
Parenteral Nutrition Market Forecast and Outlook 2025 to 2035
Parenteral Formula Market Analysis by Type of Nutrient, Indications and Sale Channels Through 2035
Parenteral Compounding Market Analysis - Share, Size, and Forecast 2025 to 2035
Self-administered Parenteral Market Size and Share Forecast Outlook 2025 to 2035
Packaging Testing Services Market Size and Share Forecast Outlook 2025 to 2035
Packaging Tubes Market Size and Share Forecast Outlook 2025 to 2035
Packaging Jar Market Forecast and Outlook 2025 to 2035
Packaging Barrier Film Market Size and Share Forecast Outlook 2025 to 2035
Packaging Films Market Size and Share Forecast Outlook 2025 to 2035
Packaging Laminate Market Size and Share Forecast Outlook 2025 to 2035
Packaging Burst Strength Test Market Size and Share Forecast Outlook 2025 to 2035
Packaging Tapes Market Analysis - Size, Share, & Forecast Outlook 2025 to 2035
Packaging Materials Market Size and Share Forecast Outlook 2025 to 2035
Packaging Labels Market Size and Share Forecast Outlook 2025 to 2035
Packaging Equipment Market Size and Share Forecast Outlook 2025 to 2035
Packaging Resins Market Size and Share Forecast Outlook 2025 to 2035
Packaging Inspection Systems Market Size and Share Forecast Outlook 2025 to 2035
Packaging Design And Simulation Technology Market Size and Share Forecast Outlook 2025 to 2035

Thank you!
You will receive an email from our Business Development Manager. Please be sure to check your SPAM/JUNK folder too.
Chat With
MaRIA