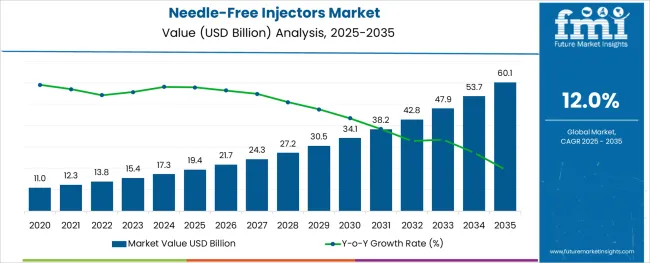
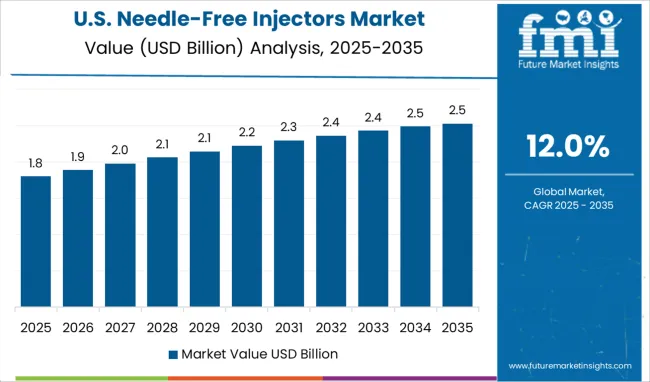
Global Demand For Needle-Free Injectors is expected to rise at a yearly growth rate of 12% Y-o-Y to USD 42.79 Billion in 2032, supported by:
During the period ranging from 2020 to 2022, needle-free Injectors demand prospects appeared limited, attributed to the onset of transmittable diseases in the past, which emerged as a major roadblock.
Sales of needle-free injectors are estimated to accelerate significantly, attributed to the growing incidence of needle stick injuries and the rise in the number of parenteral drug approvals. People working with hypodermic syringes and other needle equipment are at a greater risk of needle stick injuries.
Continuing trends in the hypodermic needles market have restated the budding role of automated systems for needle creators for inspection and testing processes. According to the CDC, some 385,000 healthcare workers accidentally stick themselves with needles every year.
Needlestick injuries have the potential to transmit infectious diseases such as hepatitis B, hepatitis C, and human immunodeficiency virus (AIDS) among healthcare workers. As per this report, demand for Needle-Free Injectors for automotive production is expected to surge at over 12% CAGR until 2032.
Data Points | Key Statistics |
---|---|
Estimated Value of Global Needle-Free Injectors Market by 2032 | USD 42.79 Billion |
Documented Market Value of Needle-Free Injectors Market in 2022 | USD 13.78 Billion |
Estimated CAGR from 2022 to 2032 | 12% |
Estimated CAGR of APEJ by 2032 | 11.8% |
The Asia Pacific is anticipated to yield significant growth opportunities, backed by robust healthcare infrastructure and favorable government regulations. By 2032-end, the annual growth rate is projected to encircle 12%, affected by several aspects.
Within the Asia Pacific, the rapidly developing healthcare industry in China, is attributed to the increasing geriatric population and rising life expectancy.
Thereby, several pharma companies in China are making hefty investments in the development of innovative treatments for chronic diseases like cancer, diabetes, etc.
These approaches are supporting the expansion of private-sector hospitals & clinics which sets a strong base for the development of needle-free injectors.
Likewise, India is expected to offer numerous growth opportunities for pharma companies, due to increasing emphasis on better healthcare treatment and promising growth in the healthcare sector in the country.
In terms of market bifurcation, needle-free injectors have experienced the highest traction in the cosmetic surgeries segment. Based on the growing trends, this segment is estimated to register a CAGR of 12.1% over the years to come.
Given the technological advancements in recent years, a significant shift in the adoption of cosmetic surgeries for skin whitening, and body marks removal has been observed. Earlier, the high cost of surgeries impeded market growth. However, the introduction of innovative tools like needle-free injectors has supported global acceptance.
Needle-free injection technology (NFIT) is an exceptionally broad concept that includes an extensive array of drug delivery systems that drive drugs through the skin.
This technology is not only touted to be valuable for the pharma industry but the developing world to find it highly useful in mass immunization programs, avoiding the chances of needle stick injuries and ducking other complications including those arising due to multiple uses of a single needle.
Growth of the needle-free injectors market can be attributed to faster drug delivery and increasing demand of the same from the healthcare sector. The market for needle-free injectors registered a CAGR of 8% in the historical period 2017-2021.
The global demand for electric guitars is projected to increase at a CAGR of 12% during the forecast period between 2022 and 2032, reaching a total of USD 42.79 Billion in 2032, according to a report from Future Market Insights (FMI). From 2017 to 2021, sales witnessed significant growth, registering a CAGR of 8%.
Sales of needle-free injectors market increased considerably increased over the last few years due to factors such as the growing incidence of needle stick injuries and rise in the number of parenteral drugs approvals. People working with hypodermic syringes and other needle equipment are at a greater risk of needle stick injuries.
These injuries can mainly occur when people use or dispose needles. Hence, demand for needle-free injectors increased as they are the best alternative for patients and healthcare workers to prevent themselves from needle stick injuries.
Also, needle-free injectors offer faster drug delivery which enhances bioavailability as compared to invasive drug delivery systems. This is resulting in the increasing adoption of needle-free injectors.
Pharmaceutical industries propelling growth of needle-free injectors
Pharmaceutical industries are increasing the adoption of needle-free injectors as need for drug delivery or vaccinations is increasing. Needle-free injectors are preferred over invasive drug delivery systems as they don’t cause side-effects such as pain, swelling, or wounds.
Additionally, needle-free injectors are cost-effective, sanitary, fast, and nearly painless. Hence, key players are capitalizing on these benefits to increase their sales in countries with the weaker economic system.
Need for needle-free insulin delivery as a primary treatment option has surged due to the rising prevalence of diabetes and insulin across the globe.
Growth of plastic surgeries increasing dependency on needle-free injectors
Alongside this, application of needle-free injectors in cosmetic industry is accelerating at a mounting pace. As per FMI, the cosmetics segment is projected to report maximum growth at a CAGR of 12.6% during the forecast period.
According to the American Society of Plastic Surgeons, 15.6 Billion cosmetic procedures took place in the world, among which 2.3 Billion are cosmetic surgical procedures and 13.2 Billion are cosmetic minimally-invasive procedures.
Hence, the demand for minimally invasive procedures is more as compared to invasive procedures. Driven by this, needle-free injectors manufacturers are increasing the adoption, generating ample of growth opportunities within cosmetic industry.
High Operating Cost of Needle-Free Injectors to Act as a Barrier for Key Players
Key players are facing difficulties in needle-free injectors manufacturing due to high cost and requirement of complex equipment. Difficulty in procuring certification for needle free injectors and need for sterilization before each batch of production also are proving to be challenges for market players.
Key players often have to spend on high operating costs to meet the aforementioned requirements for manufacturing of needle-free injectors, which also is expected to act as a challenge to growth. Besides this, the easy availability of needle-free injectors alternatives is restraining the market growth during the forecast period.
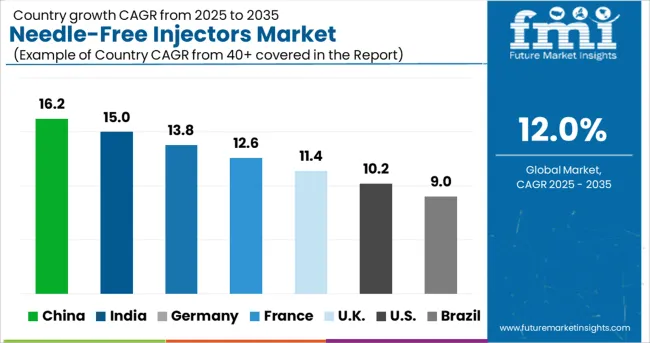
Minimally invasive diagnostic care favoring growth of needle-free injectors
As per Future Market Insights, the USA is expected to be a leading market across North America, accounting for over 94.0% of the market in 2022. It is expected to continue exhibiting high demand for needle-free injectors through the course of the report’s assessment period.
Growth in the market is primarily driven by the rising prevalence of chronic diseases such as diabetes, cancer, and others. With goring preference for non-invasive and minimally-invasive diagnostic care, the adoption of needle-free injectors have increased, especially among home-care patient.
According to Centers for Disease Control and Prevention (CDC), in 2018, approximately 34.2 Billion cases of diabetes were found with the USA With the rising prevalence of diabetes, demand for needle-free injectors will accelerate, especially within geriatric population.
Key players expanding presence by increasing production units
According to the study, Germany is expected to dominate the Europe, holding 29.4% Europe’s market share through 2032. Increasing expenditure in healthcare due to rising awareness among consumers has encouraged them to spend on quality wellness products.
This has led to the surge in needle-free injectors’ adoption due to their ability of faster drug delivery and minimal invasion. Germany is considered to have the highest expenditure on its healthcare system, contributing approximately 11% of the GDP in 2018, according to Eurostat.
Alongside this, the presence of key players in the country and development of their product portfolio is also aiding the market growth. For instance, Gerresheimer Regensburg announced the expansion of its production unit for small batch production of plastics in Wackersdorf, Bavaria, Germany in November 2020.
Technological advancements supporting the use of needle-free injectors in the country
Japan is projected to hold over 34% share in the East Asia market, exhibiting growth at a CAGR of 11.7% during the forecast period. This is predominantly due to the rising cosmetic procedures in the country and technological advancements in healthcare and cosmetic industry.
For instance, according to International Survey on Aesthetic/Cosmetic Procedures Performed in 2018, there were total 224,293 surgical procedures took place in Japan that fuel the market of needle-free injectors.
Growth hormones for children accelerating growth of needle-free injectors
In 2020, China led the East Asia market with more than 46.8% share and is projected to expand at a CAGR of 12.0% through 2032. This is mainly due to the need of daily dosage of hormones administration in children and easy regulations by government for approving innovative products.
For instance, the National Medical Products Administration approved needle-free injectors for sale on the domestic market in August, 2017 in China. Also, more than 7 Billion Chinese children need daily doses of growth hormone who suffer from dwarfism in China which also going to benefits the market.
Reduction in production cycles elevating growth
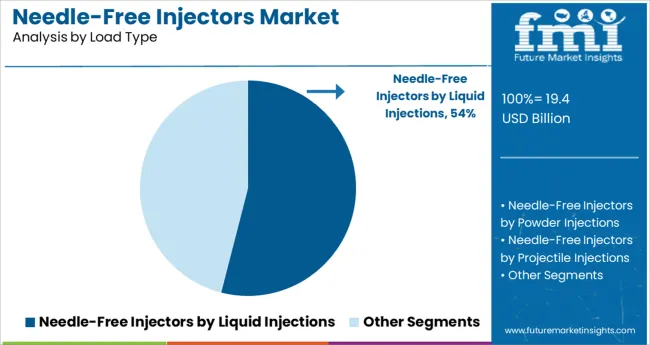
In terms of load type, the projectile injections segment is expected to expand at a CAGR of 13.9% during the forecast period.
The segment is expected to gain popularity due to the ability for prevention of material clusters that reduces cycle times and as it supports the production of parts with variable and uneven diameters.
Painless and minimally invasive cosmetic surgeries contributing to spring-loaded jet injector growth
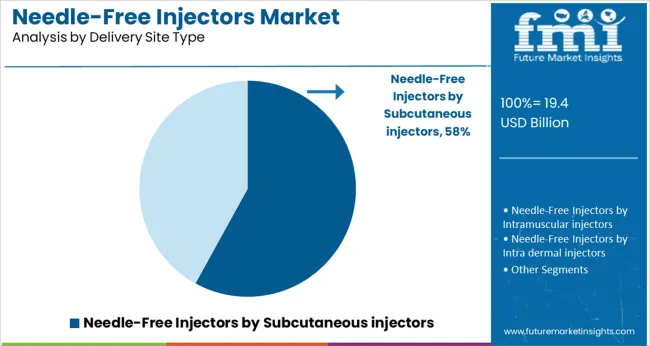
Growth in this segment attributed due to its nature to penetrate the skin for delivering a drug or vaccine into subcutaneous, intradermal or intramuscular tissues by creating a narrow stream under high pressure.
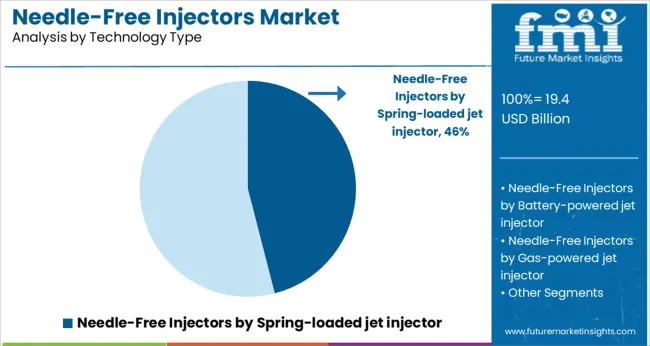
Moreover, the increasing dependency on needle-free injectors in the cosmetic industry is contributing to the growth of spring-loaded injectors. Thus, based on technology type, the spring-loaded jet injector segment will dominate the market, holding 47.1% of the revenue share in 2022.
Healthcare industry supporting growth of drug delivery
Rising prevalence of chronic diseases is expected to aid the segment growth. This also has created demand for needle-free injectors in the homecare setting. Increasing expenditure by the healthcare industry along with technological advancements is fueling the growth of needle-free injectors.
In terms of application, drug delivery is expected to hold the leading share in the market, accounting for 65.0% of the revenue share in 2022.
Multiple drug delivery making reusable needle-free injectors popular
With 79.5% of the revenue share, reusable needle-free injectors are expected to dominate the market in 2022. Reusable needle-free injectors are gaining popularity because they can be reused multiple times for drug delivery to a single patient with maximum ease of use.
For example, insulin delivery to the diabetic patient can be done through reusable needle-free injectors for multiple times. This method is cost effective also which plays a prime role in driving its demand in the future.
Prevalence of chronic diseases increasing dependency on needle-free injectors
Factors such as growing awareness about needle-free injectors, rising prevalence of chronic diseases, and advent of COVID-19 have expanded the patient-pool in hospitals. Moreover, nearly all healthcare industries are relying on needle-free injectors owing to the increasing number of patients facing different chronic diseases.
This has led to an increasing demand for needle-free injectors. Based on the end-user, hospitals are expected to be the primary end-user, accounting for over 33.4% market share during the forecast period.
Few key players in the needle-free injectors market are Portal Instruments and NovaXS Biotech.
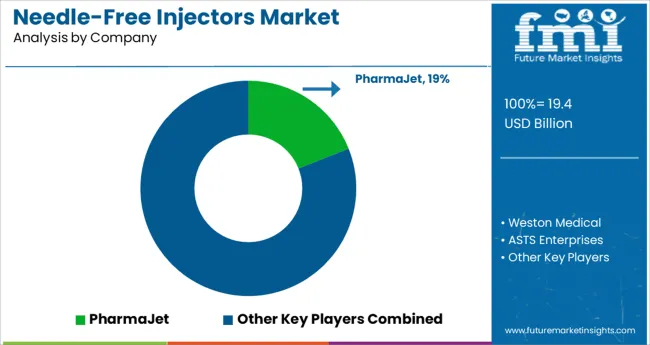
Key players in the needle-free injectors market are Gerresheimer AG, Pfizer Inc., Halozyme, CSL Limited (Seqirus UK Limited), Crossject, Portal Instruments, Ferring Pharmaceuticals, PharmaJet Inc., PenJet Corporation
Key players are focusing on the expansion of their brands in emerging regions and manufacturing the newly revised product. Manufacturers are also adopting a slew of expansion strategies such as acquisition, new product launches and approvals, agreements, partnerships, and collaborations to strengthen their market presence.
Report Attribute | Details |
---|---|
Market Value in 2022 | USD 13.78 Billion |
Market Value in 2032 | USD 42.79 Billion |
Growth Rate | CAGR of 12% from 2022 to 2032 |
Base Year for Estimation | 2021 |
Historical Data | 2017 to 2021 |
Forecast Period | 2022 to 2032 |
Quantitative Units | Revenue in USD Million and CAGR from 2022 to 2032 |
Report Coverage | Revenue Forecast, Volume Forecast, Company Ranking, Competitive Landscape, Growth Factors, Trends and Pricing Analysis |
Segments Covered | Load, Technology, Delivery Site, Application, End User, Region |
Regions Covered | North America; Latin America; Europe; East Asia; South Asia; Oceania; Middle East & Africa |
Key Countries Profiled | USA, Canada, Brazil, Argentina, Germany, UK, France, Spain, Italy, Nordics, BENELUX, Australia & New Zealand, China, India, ASEAN, GCC, South Africa |
Key Companies Profiled | Gerresheimer AG; Pfizer Inc.; Halozyme; CSL Limited (Seqirus UK Limited); Crossject; Portal Instruments; Ferring Pharmaceuticals; PharmaJet Inc.; PenJet Corporation |
Customization | Available Upon Request |
Table 01: Global Market Value (US$ Mn) Analysis- and Opportunity Assessment 2022–2032, By Load
Table 02: Global Market Value (US$ Mn) Analysis- and Opportunity Assessment 2022–2032, By Technology
Table 03: Global Market Value (US$ Mn) Analysis- and Opportunity Assessment 2022–2032, By Delivery Site
Table 04: Global Market Value (US$ Mn) Analysis- and Opportunity Assessment 2022–2032, By Application
Table 05: Global Market Value (US$ Mn) Analysis- and Opportunity Assessment 2022–2032, By Usage
Table 06: Global Market Value (US$ Mn) Analysis- and Opportunity Assessment 2022–2032, By End User
Table 07: Global Market Value (US$ Mn) Analysis 2022-2032 and Forecast 2022–2032 By Region
Table 08: North America Market Value (US$ Mn) Analysis- and Opportunity Assessment 2022-2032, By Load
Table 09: North America Market Value (US$ Mn) Analysis- and Opportunity Assessment 2022-2032, By Technology
Table 10: North America Market Value (US$ Mn) Analysis- and Opportunity Assessment 2022-2032, By Delivery Site
Table 11: North America Market Value (US$ Mn) Analysis- and Opportunity Assessment 2022-2032, By Application
Table 12: North America Market Value (US$ Mn) Analysis- and Opportunity Assessment 2022-2032, By Usage
Table 13: North America Market Value (US$ Mn) Analysis- and Opportunity Assessment 2022-2032, By End User
Table 14: North America Needle-Free Inyector Market Size (US$ Mn) Analysis 2022-2032 and Forecast 2022-2032, By Country
Table 15: Latin America Market Value (US$ Mn) Analysis- and Opportunity Assessment 2022-2032, By Load
Table 16: Latin America Market Value (US$ Mn) Analysis- and Opportunity Assessment 2022-2032, By Technology
Table 17: Latin America Market Value (US$ Mn) Analysis- and Opportunity Assessment 2022-2032, By Delivery Site
Table 18: Latin America Market Value (US$ Mn) Analysis- and Opportunity Assessment 2022-2032, By Application
Table 19: Latin America Market Value (US$ Mn) Analysis- and Opportunity Assessment 2022-2032, By Usage
Table 20: Latin America Market Value (US$ Mn) Analysis- and Opportunity Assessment 2022-2032, By End User
Table 21: Latin America Needle-Free Inyector Market Size (US$ Mn) Analysis 2022-2032 and Forecast 2022-2032, By Country
Table 22: Europe Market Value (US$ Mn) Analysis- and Opportunity Assessment 2022-2032, By Load
Table 23: Europe Market Value (US$ Mn) Analysis- and Opportunity Assessment 2022-2032, By Technology
Table 24: Europe Market Value (US$ Mn) Analysis- and Opportunity Assessment 2022-2032, By Delivery Site
Table 25: Europe Market Value (US$ Mn) Analysis- and Opportunity Assessment 2022-2032, By Application
Table 26: Europe Market Value (US$ Mn) Analysis- and Opportunity Assessment 2022-2032, By Usage
Table 27: Europe Market Value (US$ Mn) Analysis- and Opportunity Assessment 2022-2032, By End User
Table 28: Europe Needle-Free Inyector Market Size (US$ Mn) Analysis 2022-2032 and Forecast 2022-2032, By Country
Table 29: East Asia Market Value (US$ Mn) Analysis- and Opportunity Assessment 2022-2032, By Load
Table 30: East Asia Market Value (US$ Mn) Analysis- and Opportunity Assessment 2022-2032, By Technology
Table 31: East Asia Market Value (US$ Mn) Analysis- and Opportunity Assessment 2022-2032, By Delivery Site
Table 32: East Asia Market Value (US$ Mn) Analysis- and Opportunity Assessment 2022-2032, By Application
Table 33: East Asia Market Value (US$ Mn) Analysis- and Opportunity Assessment 2022-2032, By Usage
Table 34: East Asia Market Value (US$ Mn) Analysis- and Opportunity Assessment 2022-2032, By End User
Table 35: East Asia Needle-Free Inyector Market Size (US$ Mn) Analysis 2022-2032 and Forecast 2022-2032, By Country
Table 36: South Asia Market Value (US$ Mn) Analysis- and Opportunity Assessment 2022-2032, By Load
Table 37: South Asia Market Value (US$ Mn) Analysis- and Opportunity Assessment 2022-2032, By Technology
Table 38: South Asia Market Value (US$ Mn) Analysis- and Opportunity Assessment 2022-2032, By Delivery Site
Table 39: South Asia Market Value (US$ Mn) Analysis- and Opportunity Assessment 2022-2032, By Application
Table 40: South Asia Market Value (US$ Mn) Analysis- and Opportunity Assessment 2022-2032, By Usage
Table 41: South Asia Market Value (US$ Mn) Analysis- and Opportunity Assessment 2022-2032, By End User
Table 42: South Asia Needle-Free Inyector Market Size (US$ Mn) Analysis 2022-2032 and Forecast 2022-2032, By Country
Table 43: Oceania Market Value (US$ Mn) Analysis- and Opportunity Assessment 2022-2032, By Load
Table 44: Oceania Market Value (US$ Mn) Analysis- and Opportunity Assessment 2022-2032, By Technology
Table 45: Oceania Market Value (US$ Mn) Analysis- and Opportunity Assessment 2022-2032, By Delivery Site
Table 46: Oceania Market Value (US$ Mn) Analysis- and Opportunity Assessment 2022-2032, By Application
Table 47: Oceania Market Value (US$ Mn) Analysis- and Opportunity Assessment 2022-2032, By Usage
Table 48: Oceania Market Value (US$ Mn) Analysis- and Opportunity Assessment 2022-2032, By End User
Table 49: Oceania Needle-Free Inyector Market Size (US$ Mn) Analysis 2022-2032 and Forecast 2022-2032, By Country
Table 50: MEA Market Value (US$ Mn) Analysis- and Opportunity Assessment 2022-2032, By Load
Table 51: MEA Market Value (US$ Mn) Analysis- and Opportunity Assessment 2022-2032, By Technology
Table 52: MEA Market Value (US$ Mn) Analysis- and Opportunity Assessment 2022-2032, By Delivery Site
Table 53: MEA Market Value (US$ Mn) Analysis- and Opportunity Assessment 2022-2032, By Application
Table 54: MEA Market Value (US$ Mn) Analysis- and Opportunity Assessment 2022-2032, By Usage
Table 55: MEA Market Value (US$ Mn) Analysis- and Opportunity Assessment 2022-2032, By End User
Table 56: MEA Needle-Free Inyector Market Size (US$ Mn) Analysis 2022-2032 and Forecast 2022-2032, By Country
Figure 01: Global Market Value Share By Load (2022E)
Figure 02: Global Market Value Share By Technology (2022E)
Figure 03: Global Market Value Share By Delivery Site (2022E)
Figure 04: Global Market Value Share By Application (2022E)
Figure 05 Global Market Value Share By Usage (2022E)
Figure 06: Global Market Value Share By End User (2022E)
Figure 07: Global Market Value Share By Region (2022E)
Figure 08: Global Market Value Analysis (US$ Mn), 2017-2021
Figure 09: Global Market Size (US$ Mn) & Y-o-Y Growth (%) Analysis, 2022-2032
Figure 10: Global Market Absolute $ Opportunity, 2022-2032
Figure 11: Global Market Share Analysis (%), By Load, 2022 & 2032
Figure 12: Global Market Y-o-Y Analysis (%), By Load, 2022-2032
Figure 13: Global Market Attractiveness Analysis by Load, 2022-2032
Figure 14: Global Market Share Analysis (%), By Technology, 2022 & 2032
Figure 15: Global Market Y-o-Y Analysis (%), By Technology, 2022-2032
Figure 16: Global Market Attractiveness Analysis by Technology, 2022-2032
Figure 17: Global Market Share Analysis (%), By Delivery Site, 2022 & 2032
Figure 18: Global Market Y-o-Y Analysis (%), By Delivery Site, 2022-2032
Figure 19: Global Market Attractiveness Analysis by Delivery Site, 2022-2032
Figure 20: Global Market Share Analysis (%), By Application, 2022 & 2032
Figure 21: Global Market Y-o-Y Analysis (%), By Application, 2022-2032
Figure 22: Global Market Attractiveness Analysis by Application, 2022-2032
Figure 23: Global Market Share Analysis (%), By Usage, 2022 & 2032
Figure 24: Global Market Y-o-Y Analysis (%), By Usage, 2022-2032
Figure 25: Global Market Attractiveness Analysis by Usage, 2022-2032
Figure 26: Global Market Share Analysis (%), By End User, 2022 & 2032
Figure 27: Global Market Y-o-Y Analysis (%), By End User, 2022-2032
Figure 28: Global Market Attractiveness Analysis by End User, 2022-2032
Figure 29: Global Market Share Analysis (%) By Region, 2022 & 2032
Figure 30: Global Market Y-o-Y Growth (%) By Region, 2022-2032
Figure 31: Global Market Attractiveness Analysis By Region, 2022-2032
Figure 32: North America Market Value Share By Load (2022E)
Figure 33: North America Market Value Share By Technology (2022E)
Figure 34: North America Market Value Share By Delivery Site (2022E)
Figure 35: North America Market Value Share By Application (2022E)
Figure 36: North America Market Share, By Usage (2021)
Figure 37: North America Market Share, By End User (2021)
Figure 38: North America Market Share, By Country (2020)
Figure 39: North America Market Value Analysis (US$ Mn), 2022-2032
Figure 40: North America Market Value Forecast (US$ Mn), 2022-2032
Figure 41: North America Market Attractiveness Analysis By Load, 2022-2032
Figure 42: North America Market Attractiveness Analysis By Technology, 2022-2032
Figure 43: North America Market Attractiveness Analysis By Delivery Site, 2022-2032
Figure 44: North America Market Attractiveness Analysis By Application, 2022-2032
Figure 45: North America Market Attractiveness Analysis By Usage, 2022-2032
Figure 46: North America Market Attractiveness Analysis By End User, 2022-2032
Figure 47: North America Market Attractiveness Analysis By Country, 2022-2032
Figure 48: Latin America Market Value Share By Load (2022E)
Figure 49: Latin America Market Value Share By Technology (2022E)
Figure 50: Latin America Market Value Share By Delivery Site (2022E)
Figure 51: Latin America Market Value Share By Application (2022E)
Figure 52: Latin America Market Share, By Usage (2021)
Figure 53: Latin America Market Share, By End User (2021)
Figure 54: Latin America Market Share, By Country (2020)
Figure 55: Latin America Market Value Analysis (US$ Mn), 2022-2032
Figure 56: Latin America Market Value Forecast (US$ Mn), 2022-2032
Figure 57: Latin America Market Attractiveness Analysis By Load, 2022-2032
Figure 58: Latin America Market Attractiveness Analysis By Technology, 2022-2032
Figure 59: Latin America Market Attractiveness Analysis By Delivery Site, 2022-2032
Figure 60: Latin America Market Attractiveness Analysis By Application, 2022-2032
Figure 61: Latin America Market Attractiveness Analysis By Usage, 2022-2032
Figure 62: Latin America Market Attractiveness Analysis By End User, 2022-2032
Figure 63: Latin America Market Attractiveness Analysis By Country, 2022-2032
Figure 64: Europe Market Value Share By Load (2022E)
Figure 65: Europe Market Value Share By Technology (2022E)
Figure 66: Europe Market Value Share By Delivery Site (2022E)
Figure 67: Europe Market Value Share By Application (2022E)
Figure 68: Europe Market Share, By Usage (2021)
Figure 69: Europe Market Share, By End User (2021)
Figure 70: Europe Market Share, By Country (2020)
Figure 71: Europe Market Value Analysis (US$ Mn), 2022-2032
Figure 72: Europe Market Value Forecast (US$ Mn), 2022-2032
Figure 73: Europe Market Attractiveness Analysis By Load, 2022-2032
Figure 74: Europe Market Attractiveness Analysis By Technology, 2022-2032
Figure 75: Europe Market Attractiveness Analysis By Delivery Site, 2022-2032
Figure 76: Europe Market Attractiveness Analysis by Application, 2022-2032
Figure 77: Europe Market Attractiveness Analysis By Usage, 2022-2032
Figure 78: Europe Market Attractiveness Analysis By End User, 2022-2032
Figure 79: Europe Market Attractiveness Analysis By Country, 2022-2032
Figure 80: East Asia Market Value Share By Load (2022E)
Figure 81: East Asia Market Value Share By Technology (2022E)
Figure 82: East Asia Market Value Share By Delivery Site (2022E)
Figure 83: East Asia Market Value Share By Application (2022E)
Figure 84: East Asia Market Share, By Usage (2021)
Figure 85: East Asia Market Share, By End User (2021)
Figure 86: East Asia Market Share, By Country (2020)
Figure 87: East Asia Market Value Analysis (US$ Mn), 2022-2032
Figure 88: East Asia Market Value Forecast (US$ Mn), 2022-2032
Figure 89: East Asia Market Attractiveness Analysis By Load, 2022-2032
Figure 90: East Asia Market Attractiveness Analysis By Technology, 2022-2032
Figure 91: East Asia Market Attractiveness Analysis By Delivery Site, 2022-2032
Figure 92: East Asia Market Attractiveness Analysis By Application, 2022-2032
Figure 93: East Asia Market Attractiveness Analysis By Usage, 2022-2032
Figure 94: East Asia Market Attractiveness Analysis By End User, 2022-2032
Figure 95: East Asia Market Attractiveness Analysis By Country, 2022-2032
Figure 96: South Asia Market Value Share By Load (2022E)
Figure 97: South Asia Market Value Share By Technology (2022E)
Figure 98: South Asia Market Value Share By Delivery Site (2022E)
Figure 99: South Asia Market Value Share By Application (2022E)
Figure 100: South Asia Market Share, By Usage (2021)
Figure 101: South Asia Market Share, By End User (2021)
Figure 102: South Asia Market Share, By Country (2020)
Figure 103: South Asia Market Value Analysis (US$ Mn), 2022-2032
Figure 104: South Asia Market Value Forecast (US$ Mn), 2022-2032
Figure 105: South Asia Market Attractiveness Analysis By Load, 2022-2032
Figure 106: South Asia Market Attractiveness Analysis By Technology, 2022-2032
Figure 107: South Asia Market Attractiveness Analysis By Delivery Site, 2022-2032
Figure 108: South Asia Market Attractiveness Analysis By Application, 2022-2032
Figure 109: South Asia Market Attractiveness Analysis By Usage, 2022-2032
Figure 110: South Asia Market Attractiveness Analysis By End User, 2022-2032
Figure 111: South Asia Market Attractiveness Analysis By Country, 2022-2032
Figure 112: Oceania Market Value Share By Load (2022E)
Figure 113: Oceania Market Value Share By Technology (2022E)
Figure 114: Oceania Market Value Share By Delivery Site (2022E)
Figure 115: Oceania Market Value Share By Application (2022E)
Figure 116: Oceania Market Share, By Usage (2021)
Figure 117: Oceania Market Share, By End User (2021)
Figure 118: Oceania Market Share, By Country (2020)
Figure 119: Oceania Market Value Analysis (US$ Mn), 2022-2032
Figure 120: Oceania Market Value Forecast (US$ Mn), 2022-2032
Figure 121: Oceania Market Attractiveness Analysis By Load, 2022-2032
Figure 122: Oceania Market Attractiveness Analysis By Technology, 2022-2032
Figure 123: Oceania Market Attractiveness Analysis By Delivery Site, 2022-2032
Figure 124: Oceania Market Attractiveness Analysis By Application, 2022-2032
Figure 125: Oceania Market Attractiveness Analysis By Usage, 2022-2032
Figure 126: Oceania Market Attractiveness Analysis By End User, 2022-2032
Figure 127: Oceania Market Attractiveness Analysis By Country, 2022-2032
Figure 128: MEA Market Value Share By Load (2022E)
Figure 129: MEA Market Value Share By Technology (2022E)
Figure 130: MEA Market Value Share By Delivery Site (2022E)
Figure 131: MEA Market Value Share By Application (2022E)
Figure 132: MEA Market Share, By Usage (2021)
Figure 133: MEA Market Share, By End User (2021)
Figure 134: MEA Market Share, By Country (2020)
Figure 135: MEA Market Value Analysis (US$ Mn), 2022-2032
Figure 136: MEA Market Value Forecast (US$ Mn), 2022-2032
Figure 137: MEA Market Attractiveness Analysis By Load, 2022-2032
Figure 138: MEA Market Attractiveness Analysis By Technology, 2022-2032
Figure 139: MEA Market Attractiveness Analysis By Delivery Site, 2022-2032
Figure 140: MEA Market Attractiveness Analysis By Application, 2022-2032
Figure 141: MEA Market Attractiveness Analysis By Usage, 2022-2032
Figure 142: MEA Market Attractiveness Analysis By End User, 2022-2032
Figure 143: MEA Market Attractiveness Analysis By Country, 2022-2032
Figure 144: U.S. Market Value Proportion Analysis
Figure 145: Global Vs. U.S. Growth Comparison
Figure 146: U.S. Market Share Analysis (%) By Load, 2022 & 2032
Figure 147: U.S. Market Share Analysis (%) By Technology, 2022 & 2032
Figure 148: U.S. Market Share Analysis (%) By Delivery Site, 2022 & 2032
Figure 149: U.S. Market Share Analysis (%) By Application, 2022 & 2032
Figure 150: U.S. Market Share Analysis (%) By Usage, 2022 & 2032
Figure 151: U.S. Market Share Analysis (%) By End user, 2022 & 2032
Figure 152: Canada Market Value Proportion Analysis
Figure 153: Global Vs. Canada Growth Comparison
Figure 154: Canada Market Share Analysis (%) By Load, 2022 & 2032
Figure 155: Canada Market Share Analysis (%) By Technology, 2022 & 2032
Figure 156: Canada Market Share Analysis (%) By Delivery Site, 2022 & 2032
Figure 157: Canada Market Share Analysis (%) By Application, 2022 & 2032
Figure 158: Canada Market Share Analysis (%) By Usage, 2022 & 2032
Figure 159: Canada Market Share Analysis (%) By End user, 2022 & 2032
Figure 160: Brazil Market Value Proportion Analysis
Figure 161: Global Vs. Brazil Growth Comparison
Figure 162: Brazil Market Share Analysis (%) By Load, 2022 & 2032
Figure 163: Brazil Market Share Analysis (%) By Technology, 2022 & 2032
Figure 164: Brazil Market Share Analysis (%) By Delivery Site, 2022 & 2032
Figure 165: Brazil Market Share Analysis (%) By Application, 2022 & 2032
Figure 166: Brazil Market Share Analysis (%) By Usage, 2022 & 2032
Figure 167: Brazil Market Share Analysis (%) By End user, 2022 & 2032
Figure 168: Mexico Market Value Proportion Analysis
Figure 169: Global Vs. Mexico Growth Comparison
Figure 170: Mexico Market Share Analysis (%) By Load, 2022 & 2032
Figure 171: Mexico Market Share Analysis (%) By Technology, 2022 & 2032
Figure 172: Mexico Market Share Analysis (%) By Delivery Site, 2022 & 2032
Figure 173: Mexico Market Share Analysis (%) By Application, 2022 & 2032
Figure 174: Mexico Market Share Analysis (%) By Usage, 2022 & 2032
Figure 175: Mexico Market Share Analysis (%) By End user, 2022 & 2032
Figure 176: Argentina Market Value Proportion Analysis
Figure 177: Global Vs. Argentina Growth Comparison
Figure 178: Argentina Market Share Analysis (%) By Load, 2022 & 2032
Figure 179: Argentina Market Share Analysis (%) By Technology, 2022 & 2032
Figure 180: Argentina Market Share Analysis (%) By Delivery Site, 2022 & 2032
Figure 181: Argentina Market Share Analysis (%) By Application, 2022 & 2032
Figure 182: Argentina Market Share Analysis (%) By Usage, 2022 & 2032
Figure 183: Argentina Market Share Analysis (%) By End user, 2022 & 2032
Figure 184: Germany Market Value Proportion Analysis
Figure 185: Global Vs. Germany Growth Comparison
Figure 186: Germany Market Share Analysis (%) By Load, 2022 & 2032
Figure 187: Germany Market Share Analysis (%) By Technology, 2022 & 2032
Figure 188: Germany Market Share Analysis (%) By Delivery Site, 2022 & 2032
Figure 189: Germany Market Share Analysis (%) By Application, 2022 & 2032
Figure 190: Germany Market Share Analysis (%) By Usage, 2022 & 2032
Figure 191: Germany Market Share Analysis (%) By End user, 2022 & 2032
Figure 192: UK Market Value Proportion Analysis
Figure 193: Global Vs. UK Growth Comparison
Figure 194: UK Market Share Analysis (%) By Load, 2022 & 2032
Figure 195: UK Market Share Analysis (%) By Technology, 2022 & 2032
Figure 196: UK Market Share Analysis (%) By Delivery Site, 2022 & 2032
Figure 197: UK Market Share Analysis (%) By Application, 2022 & 2032
Figure 198: UK Market Share Analysis (%) By Usage, 2022 & 2032
Figure 199: UK Market Share Analysis (%) By End user, 2022 & 2032
Figure 200: France Market Value Proportion Analysis
Figure 201: Global Vs. France Growth Comparison
Figure 202: France Market Share Analysis (%) By Load, 2022 & 2032
Figure 203: France Market Share Analysis (%) By Technology, 2022 & 2032
Figure 204: France Market Share Analysis (%) By Delivery Site, 2022 & 2032
Figure 205: France Market Share Analysis (%) By Application, 2022 & 2032
Figure 206: France Market Share Analysis (%) By Usage, 2022 & 2032
Figure 207: France Market Share Analysis (%) By End user, 2022 & 2032
Figure 208: Italy Market Value Proportion Analysis
Figure 209: Global Vs. Italy Growth Comparison
Figure 210: Italy Market Share Analysis (%) By Load, 2022 & 2032
Figure 211: Italy Market Share Analysis (%) By Technology, 2022 & 2032
Figure 212: Italy Market Share Analysis (%) By Delivery Site, 2022 & 2032
Figure 213: Italy Market Share Analysis (%) By Application, 2022 & 2032
Figure 214: Italy Market Share Analysis (%) By Usage, 2022 & 2032
Figure 215: Italy Market Share Analysis (%) By End user, 2022 & 2032
Figure 216: Spain Market Value Proportion Analysis
Figure 217: Global Vs. Spain Growth Comparison
Figure 218: Spain Market Share Analysis (%) By Load, 2022 & 2032
Figure 219: Spain Market Share Analysis (%) By Technology, 2022 & 2032
Figure 220: Spain Market Share Analysis (%) By Delivery Site, 2022 & 2032
Figure 221: Spain Market Share Analysis (%) By Application, 2022 & 2032
Figure 222: Spain Market Share Analysis (%) By Usage, 2022 & 2032
Figure 223: Spain Market Share Analysis (%) By End user, 2022 & 2032
Figure 224: Russia Market Value Proportion Analysis
Figure 225: Global Vs. Russia Growth Comparison
Figure 226: Russia Market Share Analysis (%) By Load, 2022 & 2032
Figure 227: Russia Market Share Analysis (%) By Technology, 2022 & 2032
Figure 228: Russia Market Share Analysis (%) By Delivery Site, 2022 & 2032
Figure 229: Russia Market Share Analysis (%) By Application, 2022 & 2032
Figure 230: Russia Market Share Analysis (%) By Usage, 2022 & 2032
Figure 231: Russia Market Share Analysis (%) By End user, 2022 & 2032
Figure 232: Japan Market Value Proportion Analysis
Figure 233: Global Vs. Japan Growth Comparison
Figure 234: Japan Market Share Analysis (%) By Load, 2022 & 2032
Figure 235: Japan Market Share Analysis (%) By Technology, 2022 & 2032
Figure 236: Japan Market Share Analysis (%) By Delivery Site, 2022 & 2032
Figure 237: Japan Market Share Analysis (%) By Application, 2022 & 2032
Figure 238: Japan Market Share Analysis (%) By Usage, 2022 & 2032
Figure 239: Japan Market Share Analysis (%) By End user, 2022 & 2032
Figure 240: China Market Value Proportion Analysis
Figure 241: Global Vs. China Growth Comparison
Figure 242: China Market Share Analysis (%) By Load, 2022 & 2032
Figure 243: China Market Share Analysis (%) By Technology, 2022 & 2032
Figure 244: China Market Share Analysis (%) By Delivery Site, 2022 & 2032
Figure 245: China Market Share Analysis (%) By Application, 2022 & 2032
Figure 246: China Market Share Analysis (%) By Usage, 2022 & 2032
Figure 247: China Market Share Analysis (%) By End user, 2022 & 2032
Figure 248: South Korea Market Value Proportion Analysis
Figure 249: Global Vs. South Korea Growth Comparison
Figure 250: South Korea Market Share Analysis (%) By Load, 2022 & 2032
Figure 251: South Korea Market Share Analysis (%) By Technology, 2022 & 2032
Figure 252: South Korea Market Share Analysis (%) By Delivery Site, 2022 & 2032
Figure 253: South Korea Market Share Analysis (%) By Application, 2022 & 2032
Figure 254: South Korea Market Share Analysis (%) By Usage, 2022 & 2032
Figure 255: South Korea Market Share Analysis (%) By End user, 2022 & 2032
Figure 256: Thailand Market Value Proportion Analysis
Figure 257: Global Vs. Thailand Growth Comparison
Figure 258: Thailand Market Share Analysis (%) By Load, 2022 & 2032
Figure 259: Thailand Market Share Analysis (%) By Technology, 2022 & 2032
Figure 260: Thailand Market Share Analysis (%) By Delivery Site, 2022 & 2032
Figure 261: Thailand Market Share Analysis (%) By Application, 2022 & 2032
Figure 262: Thailand Market Share Analysis (%) By Usage, 2022 & 2032
Figure 263: Thailand Market Share Analysis (%) By End user, 2022 & 2032
Figure 264: Malaysia Market Value Proportion Analysis
Figure 265: Global Vs. Malaysia Growth Comparison
Figure 266: Malaysia Market Share Analysis (%) By Load, 2022 & 2032
Figure 267: Malaysia Market Share Analysis (%) By Technology, 2022 & 2032
Figure 268: Malaysia Market Share Analysis (%) By Delivery Site, 2022 & 2032
Figure 269: Malaysia Market Share Analysis (%) By Application, 2022 & 2032
Figure 270: Malaysia Market Share Analysis (%) By Usage, 2022 & 2032
Figure 271: Malaysia Market Share Analysis (%) By End user, 2022 & 2032
Figure 272: Indonesia Market Value Proportion Analysis
Figure 273: Global Vs. Indonesia Growth Comparison
Figure 274: Indonesia Market Share Analysis (%) By Load, 2022 & 2032
Figure 275: Indonesia Market Share Analysis (%) By Technology, 2022 & 2032
Figure 276: Indonesia Market Share Analysis (%) By Delivery Site, 2022 & 2032
Figure 277: Indonesia Market Share Analysis (%) By Application, 2022 & 2032
Figure 278: Indonesia Market Share Analysis (%) By Usage, 2022 & 2032
Figure 279: Indonesia Market Share Analysis (%) By End user, 2022 & 2032
Figure 280: India Market Value Proportion Analysis
Figure 281: Global Vs. India Growth Comparison
Figure 282: India Market Share Analysis (%) By Load, 2022 & 2032
Figure 283: India Market Share Analysis (%) By Technology, 2022 & 2032
Figure 284: India Market Share Analysis (%) By Delivery Site, 2022 & 2032
Figure 285: India Market Share Analysis (%) By Application, 2022 & 2032
Figure 286: India Market Share Analysis (%) By Usage, 2022 & 2032
Figure 287: India Market Share Analysis (%) By End user, 2022 & 2032
Figure 288: Australia Market Value Proportion Analysis
Figure 289: Global Vs. Australia Growth Comparison
Figure 290: Australia Market Share Analysis (%) By Load, 2022 & 2032
Figure 291: Australia Market Share Analysis (%) By Technology, 2022 & 2032
Figure 293: Australia Market Share Analysis (%) By Delivery Site, 2022 & 2032
Figure 294: Australia Market Share Analysis (%) By Application, 2022 & 2032
Figure 295: Australia Market Share Analysis (%) By Usage, 2022 & 2032
Figure 296: Australia Market Share Analysis (%) By End user, 2022 & 2032
Figure 297: New Zealand Market Value Proportion Analysis
Figure 298: Global Vs. New Zealand Growth Comparison
Figure 299: New Zealand Market Share Analysis (%) By Load, 2022 & 2032
Figure 300: New Zealand Market Share Analysis (%) By Technology, 2022 & 2032
Figure 301: New Zealand Market Share Analysis (%) By Delivery Site, 2022 & 2032
Figure 302: New Zealand Market Share Analysis (%) By Application, 2022 & 2032
Figure 303: New Zealand Market Share Analysis (%) By Usage, 2022 & 2032
Figure 304: New Zealand Market Share Analysis (%) By End user, 2022 & 2032
Figure 305: GCC Countries Market Value Proportion Analysis
Figure 306: Global Vs. GCC Countries Growth Comparison
Figure 307: GCC Countries Market Share Analysis (%) By Load, 2022 & 2032
Figure 308: GCC Countries Market Share Analysis (%) By Technology, 2022 & 2032
Figure 309: GCC Countries Market Share Analysis (%) By Delivery Site, 2022 & 2032
Figure 310: GCC Countries Market Share Analysis (%) By Application, 2022 & 2032
Figure 311: GCC Countries Market Share Analysis (%) By Usage, 2022 & 2032
Figure 312: GCC Countries Market Share Analysis (%) By End user, 2022 & 2032
Figure 313: Turkey Market Value Proportion Analysis
Figure 314: Global Vs. Turkey Growth Comparison
Figure 315: Turkey Market Share Analysis (%) By Load, 2022 & 2032
Figure 316: Turkey Market Share Analysis (%) By Technology, 2022 & 2032
Figure 317: Turkey Market Share Analysis (%) By Delivery Site, 2022 & 2032
Figure 318: Turkey Market Share Analysis (%) By Application, 2022 & 2032
Figure 319: Turkey Market Share Analysis (%) By Usage, 2022 & 2032
Figure 320: Turkey Market Share Analysis (%) By End user, 2022 & 2032
Figure 321: South Africa Market Value Proportion Analysis
Figure 322: Global Vs. South Africa Growth Comparison
Figure 323: South Africa Market Share Analysis (%) By Load, 2022 & 2032
Figure 324: South Africa Market Share Analysis (%) By Technology, 2022 & 2032
Figure 325: South Africa Market Share Analysis (%) By Delivery Site, 2022 & 2032
Figure 326: South Africa Market Share Analysis (%) By Application, 2022 & 2032
Figure 327: South Africa Market Share Analysis (%) By Usage, 2022 & 2032
Figure 328: South Africa Market Share Analysis (%) By End user, 2022 & 2032
FMI projects the global needle-free injectors market to expand at a 12% value CAGR by 2032
The global needle-free injectors market is estimated at a market value of USD 13.78 Billion
The global needle-free injectors market is expected to garner a market value of USD 42.79 Billion
U.S. is expected to be a leading market across North America, accounting for over 94.0% of the market in 2022
Gerresheimer AG, Pfizer Inc., Halozyme, CSL Limited (Seqirus UK Limited), Crossject, Portal Instruments, Ferring Pharmaceuticals, PharmaJet Inc., PenJet Corporation are some prominent needle-free injectors manufacturers
Germany is expected to dominate the Europe, holding 29.4% Europe’s market share through 2032
Japan is projected to hold over 34% share in the East Asia market, exhibiting growth at a CAGR of 11.7% during the forecast period
The spring-loaded jet injector segment will dominate the market, holding 47.1% of the revenue share in 2022.
Hospitals are expected to be the primary end-user, accounting for over 33.4% market share during the forecast period.
Explore Therapeutic Device Insights
Thank you!
You will receive an email from our Business Development Manager. Please be sure to check your SPAM/JUNK folder too.