Disposable Pen Injectors Market Size and Share Forecast Outlook (2023 to 2033)

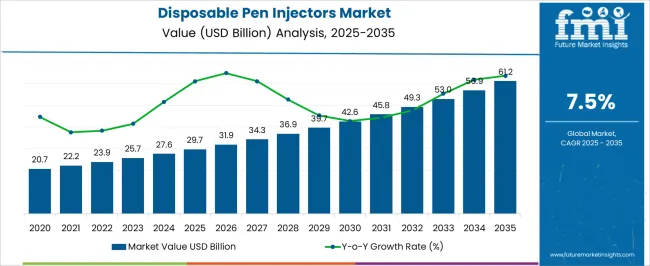
The disposable pen injectors market size is projected to be worth USD 25.5 billion in 2023. The market is likely to surpass USD 54.4 billion by 2033 at a CAGR of 7.9% during the forecast period.

The market for pen injectors created to give exact quantities of medication by subcutaneous or intramuscular injections, with disposability factor, are known as the disposable pen injectors Market. Patients employ disposable pen injectors, which are self-contained, pre-filled gadgets, to administer medication in a practical and user-friendly way. A cartridge or reservoir that stores the medication, a needle or cannula for injection, and a mechanism for dose selection and delivery make up most disposable pen injectors.

Other Drivers Propelling the Demand for Disposable Pen Injectors include:

  • The increasing prevalence of chronic diseases such as diabetes, arthritis, multiple sclerosis, and autoimmune disorders has driven the demand for self-administration devices like disposable pen injectors.
  • As an easy-to-use and less scary substitute for conventional syringes and vials, disposable pen injectors are available. Because of the discreetness, portability, and compactness of these devices, patients can give medication in a variety of settings with no discomfort or difficulty.
  • Numerous disorders are being treated with biologic medicines, such as monoclonal antibodies, growth factors, and hormones. Disposable pen injectors are a favored option for many of these medicines because of their simplicity of use, accuracy of dose, and reduced risk of contamination.

Challenges for Companies /Manufacturers in the Disposable Pen Injectors Market:

  • Disposable pen injectors can be more expensive compared to traditional syringes and vials, which may pose a financial burden for some patients, especially in regions with limited healthcare resources or inadequate insurance coverage.
  • Disposable pen injectors are frequently made for certain pharmaceuticals; therefore they might not work with all substances. This may restrict their use to specific therapeutic areas or the range of drugs available to patients who prefer or need the ease of pen injectors.
  • Disposable pen injectors have a number of advantages, but they are up against rival drug delivery technologies like wearable gadgets, auto injectors, and needle-free injection systems.

Opportunities in the Disposable Pen Injectors Industry:

  • Opportunities for market expansion and product development can be created through partnerships and collaborations between healthcare providers, pharmaceutical firms, and makers of medical devices. Strategic partnerships may result in the creation of cutting-edge disposable pen injectors, better market accessibility, and improved patient care.
  • Biologic treatments are being employed more frequently in oncology, rheumatology, and autoimmune illnesses, among other therapeutic fields. Disposable pen injectors are the best option for the delivery of biologics because many of them require frequent and exact dosing. The demand for disposable pen injectors is driven by the growth of biologic medicines.

Latest Trends in the Disposable Pen Injectors Market:

  • Self-administration of medication is becoming more popular as a result of considerations like the desire for increased independence, convenience, and affordability. With the help of disposable pen injectors, patients can quickly and precisely self-administer medication, taking charge of their own care and increasing medication adherence.
  • The healthcare industry is shifting towards patient-centric care, emphasizing personalized treatment plans and patient empowerment. Disposable pen injectors enable patients to take an active role in their treatment, promoting self-management and medication adherence.
Attributes Details
Disposable Pen Injectors Market Size (2023) USD 25.5 billion
Disposable Pen Injectors Market Projected Size (2033) USD 54.4 billion
Value CAGR (2023 to 2033) 7.9%

Comparison of Historical vs Future Outlook for Disposable Pen Injectors Market (2012 to 2033)

From 2012 to 2022, the global disposable pen injectors market experienced a CAGR of 6.1%, reaching a market size of USD 25.5 billion in 2023.

From 2012 to 2022, The Disposable Pen Injectors Market has grown steadily over the past ten years as a result of factors such the rising incidence of chronic diseases, technological improvements, and the demand for patient-friendly drug delivery systems.

Disposable pen injectors have grown in popularity as a practical and precise way for patients to self-administer medication, particularly for illnesses like diabetes.

Future Forecast for Disposable Pen Injectors Industry:

Looking ahead, the global disposable pen injectors industry is expected to rise at a CAGR of 7.9% from 2023 to 2033. In the upcoming years, the disposable pen injectors market is anticipated to keep expanding. The prevalence of chronic diseases is on the rise, pen injector technology is improving, biologic medicines are being used more frequently, and patient-centric care is prioritized.

These factors are all contributing to the market's growth. The growing older population and the demand for personalized medication are some factors driving the market.

Ongoing technological developments in disposable pen injectors, such as electronic dose monitoring, connection features, and integration with digital health systems, are also anticipated to have a positive impact on the market. These developments improve remote monitoring capabilities, medication adherence, and patient engagement.

Analysis of Top Countries Adopting Disposable Pen Injectors

Disposable Pen Injectors Market to Surge in the United States Due Shift Towards Home Healthcare

Country The United States
Market Size (USD billion) by End of Forecast Period (2033) USD 15.1 billion
CAGR % 2023 to End of Forecast (2033) 7.3%

The disposable pen injectors industry in the United States is expected to reach a market size of USD 15.1 billion by 2033, expanding at a CAGR of 7.3%. The need for patient convenience, cost effectiveness, and lessening the pressure on healthcare facilities is driving a growing trend in home healthcare in the USA With the help of disposable pen injectors, patients can self-administer medication at home, cutting down on the number of trips to the doctor.

Rising Demand for Disposable Pen Injectors Due to Focus on Patient Convenience and Self-Administration to Propel the United Kingdom Market Growth

Country The United Kingdom
Market Size (USD billion) by End of Forecast Period (2033) USD 2.7 billion
CAGR % 2023 to End of Forecast (2033) 7.2%

The disposable pen injectors industry in the United Kingdom is expected to reach a market share of USD 2.7 billion, expanding at a CAGR of 7.2% during the forecast period. Disposable pen injectors provide patients with a user-friendly and convenient method of administering medications.

They offer features like pre-filled cartridges, adjustable dosing options, and simple operation, allowing patients to self-administer their medications at home or on the go. This trend towards patient-centered care and self-management contributes to the growth of the disposable pen injectors market.

Notable Growth Expected in China's Disposable Pen Injectors Market Due to Increasing Healthcare Expenditure

Country China
Market Size (USD billion) by End of Forecast Period (2033) USD 4.6 billion
CAGR % 2023 to End of Forecast (2033) 9.1%

The disposable pen injectors industry in China is anticipated to reach a market size of USD 4.6 billion, moving at a CAGR of 9.1% during the forecast period. China has been increasing its healthcare expenditure in recent years, focusing on improving healthcare infrastructure, access, and quality of care.

This increased investment supports the development and adoption of advanced medical devices like disposable pen injectors. Improved access to healthcare services and reimbursement policies contribute to the growth of the market.
Growing Patient Education and Awareness to Drive Market Growth in Japan

Country Japan
Market Size (USD billion) by End of Forecast Period (2033) USD 2.6 billion
CAGR % 2023 to End of Forecast (2033) 8.1%

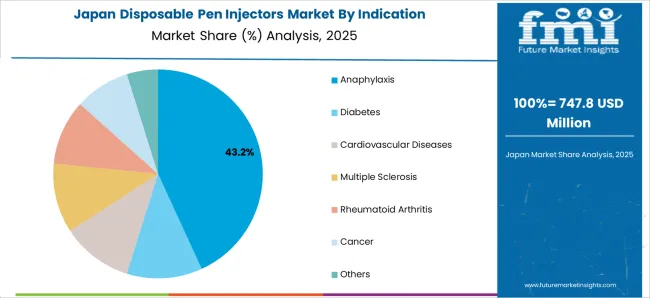
The disposable pen injectors industry in Japan is estimated to reach a market size of USD 2.6 billion by 2033, thriving at a CAGR of 8.1%. Education programs and initiatives that raise awareness about the benefits and proper usage of disposable pen injectors are crucial for market growth. Healthcare providers and pharmaceutical companies play a significant role in educating patients about the advantages of using disposable pen injectors, enhancing patient knowledge and acceptance.
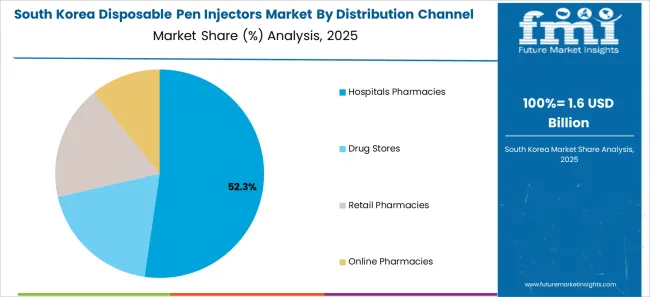
Demand for Disposable Pen Injectors is Rising Due to Government Initiatives to Fuel Market Growth in South Korea

Country South Korea
Market Size (USD billion) by End of Forecast Period (2033) USD 2.4 billion
CAGR % 2023 to End of Forecast (2033) 8.6%

The disposable pen injectors industry in South Korea is expected to reach a market size of USD 2.4 billion, expanding at a CAGR of 8.6% during the forecast period. The South Korean government has implemented various initiatives to promote self-care and home healthcare, aiming to improve patient outcomes and reduce healthcare costs. Disposable pen injectors align with these initiatives by enabling patients to self-administer medications at home, reducing the need for frequent hospital visits and improving patient empowerment.

Disposable Pen Injectors Industry Analysis by Category

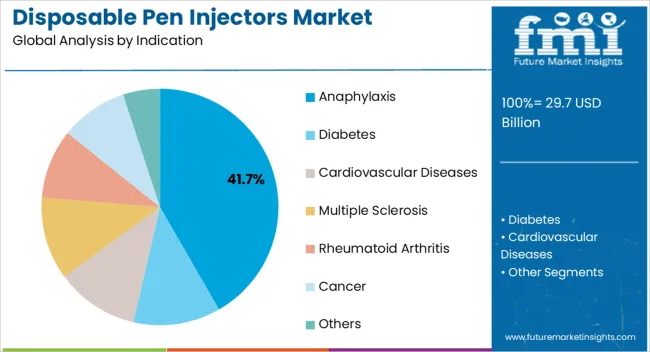
Diabetes to Dominate Disposable Pen Injectors Industry with 7.5% CAGR through 2033

The Diabetes is expected to dominate the disposable pen injectors industry with a CAGR of 7.5% from 2023 to 2033. High blood sugar levels are a defining characteristic of diabetes, a chronic illness. It is a problem for global health, and its prevalence has been rising over time.

Disposable pen injectors are one of the diabetes management solutions that are in high demand due to the rising prevalence of the disease. Disposable pen injectors are designed to be user-friendly and convenient. They feature pre-filled insulin cartridges and adjustable dosing options, making it easier for individuals with diabetes to administer insulin accurately. The convenience and ease of use offered by disposable pen injectors contribute to their popularity among patients.

Which End User is Widely Adopted the Disposable Pen Injectors?

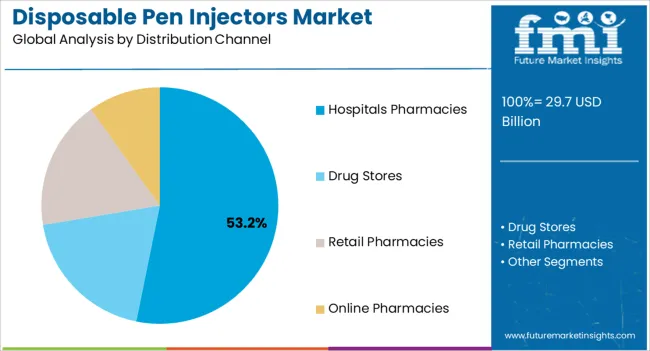
The hospitals pharmacies segment is expected to dominate the disposable pen injectors industry with a CAGR of 7.1% from 2023 to 2033. This segment captures a significant market share in 2023 as hospital pharmacists play a crucial role in patient education and counseling. They provide information on proper medication usage, administration techniques, and injection site rotation.

For patients using disposable pen injectors, hospital pharmacists educate them on how to assemble and use the device correctly, ensuring safe and effective medication administration.
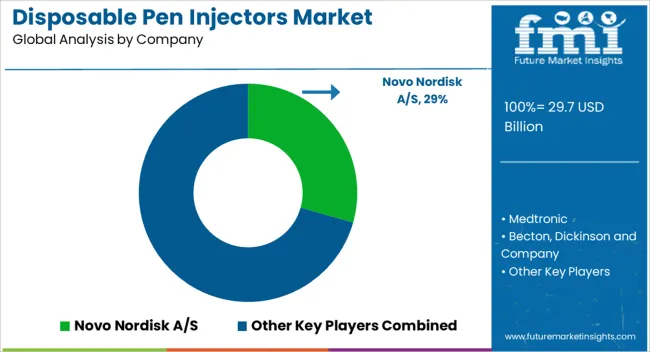
Competitive Landscape of the Disposable Pen Injectors Market

The disposable pen injectors sector is fiercely competitive, with many companies fighting for market dominance. To stay ahead of the competition in such a circumstance, essential players must employ smart techniques.

Key Strategies Used by the Participants

Product Development

To produce innovative goods that increase efficacy, dependability, and cost-effectiveness, businesses make significant investments in research and development. Product innovation enables companies to stand out from the competition while also meeting the shifting needs of their customers.

Strategic Alliances & Collaborations

Key industry leaders frequently develop strategic partnerships and collaborations with other companies in order to harness their strengths and increase their market reach. Companies might also gain access to new technology and markets through such agreements.

Expansion into Emerging Markets

The disposable pen injectors sector is expanding rapidly in emerging regions such as China and India. Key firms are enhancing their distribution networks and developing local manufacturing facilities to increase their presence in these areas.

Acquisitions and mergers

Mergers and acquisitions are frequently used by key players in the disposable pen injectors business to consolidate their market position, extend their product range, and gain access to new markets.

Key Players in the Disposable Pen Injectors Industry

  • Novo Nordisk A/S
  • Medtronic
  • Becton, Dickinson and Company
  • Sanofi
  • Eli Lilly
  • Merck
  • AstraZeneca
  • Roche
  • Owen Mumford Ltd
  • Ypsomed AG
  • Terumo Medical Corporation

Key Developments in the Disposable Pen Injectors Market:

  • In August 2020, A diabetes management software and a smart insulin pen system with FDA clearance, InPen, are made by Companion Medical and will soon be acquired by Medtronic.
  • In May 2021, For patients with diabetes who use Lilly's linked insulin pen solutions, Glooko, a supplier of remote patient monitoring and data management solutions for diabetes and other chronic illnesses, has established a strategic partnership with the company.

Segmentation Analysis of the Disposable Pen Injectors Market

By Indication:

  • Anaphylaxis
  • Diabetes
  • Cardiovascular Diseases
  • Multiple Sclerosis
  • Rheumatoid Arthritis
  • Cancer
  • Others

By Distribution Channel:

  • Hospitals Pharmacies
  • Drug Stores
  • Retail Pharmacies
  • Online Pharmacies

By Region:

  • North America
  • Latin America
  • Europe
  • East Asia
  • South Asia
  • Oceania
  • The Middle East & Africa

Table of Content

  • 1. Executive Summary
  • 2. Market Overview
  • 3. Key Market Trends
  • 4. Value Added Insights
  • 5. Market Background
  • 6. Global Market Volume (in Units) Analysis 2012 to 2022 and Forecast, 2023 to 2033
  • 7. Global Market - Pricing Analysis
  • 8. Global Market Demand (in Value or Size in USD Million) Analysis 2012 to 2022 and Forecast, 2023 to 2033
  • 9. Global Market Analysis 2012 to 2022 and Forecast 2023 to 2033, By Indication
    • 9.1. Anaphylaxis
    • 9.2. Diabetes
    • 9.3. Cardiovascular Diseases
    • 9.4. Multiple Sclerosis
    • 9.5. Rheumatoid Arthritis
    • 9.6. Cancer
    • 9.7. Others
  • 10. Global Market Analysis 2012 to 2022 and Forecast 2023 to 2033, By Distribution Channel
    • 10.1. Hospitals Pharmacies
    • 10.2. Drug Stores
    • 10.3. Retail Pharmacies
    • 10.4. Online Pharmacies
  • 11. Global Market Analysis 2012 to 2022 and Forecast 2023 to 2033, by Region
    • 11.1. North America
    • 11.2. Latin America
    • 11.3. Europe
    • 11.4. South Asia
    • 11.5. East Asia
    • 11.6. Oceania
    • 11.7. Middle East and Africa (MEA)
  • 12. North America Market Analysis 2012 to 2022 and Forecast 2023 to 2033
  • 13. Latin America Market Analysis 2012 to 2022 and Forecast 2023 to 2033
  • 14. Europe Market Analysis 2012 to 2022 and Forecast 2023 to 2033
  • 15. South Asia Market Analysis 2012 to 2022 and Forecast 2023 to 2033
  • 16. East Asia Market Analysis 2012 to 2022 and Forecast 2023 to 2033
  • 17. Oceania Market Analysis 2012 to 2022 and Forecast 2023 to 2033
  • 18. Middle East and Africa Market Analysis 2012 to 2022 and Forecast 2023 to 2033
  • 19. Market Structure Analysis
  • 20. Competition Analysis
    • 20.1. Terumo Medical Corporation
    • 20.2. Medtronic
    • 20.3. Becton, Dickinson and Company
    • 20.4. Sanofi
    • 20.5. Eli Lilly
    • 20.6. Merck
    • 20.7. AstraZeneca
    • 20.8. Roche
    • 20.9. Owen Mumford Ltd
    • 20.10. Ypsomed AG
    • 20.11. Novo Nordisk A/S
  • 21. Assumptions and Acronyms Used
  • 22. Research Methodology

List of Tables

Table 01: Global Market Value (US$ Million) Analysis and Forecast 2012 to 2033, by Indication

Table 02: Global Market Value (US$ Million) Analysis and Forecast 2012 to 2033, by Distribution Channel

Table 03: Global Market Value (US$ Million) Analysis and Forecast 2012 to 2033, by Region

Table 04: Global Market Volume (Units) Analysis and Forecast 2012 to 2033, by Region

Table 05: North America Market Value (US$ Million) Analysis 2012 to 2022 and Forecast 2023 to 2033, by Country

Table 06: North America Market Volume (Units) Analysis and Forecast 2012 to 2033, by Country

Table 07: North America Market Value (US$ Million) Analysis and Forecast 2012 to 2033, by Indication

Table 08: North America Market Value (US$ Million) Analysis and Forecast 2012 to 2033, by Distribution Channel

Table 09: Latin America Market Value (US$ Million) Analysis 2012 to 2022 and Forecast 2023 to 2033, by Country

Table 10: Latin America Market Volume (Units) Analysis and Forecast 2012 to 2033, by Country

Table 11: Latin America Market Value (US$ Million) Analysis and Forecast 2012 to 2033, by Indication

Table 12: Latin America Market Value (US$ Million) Analysis and Forecast 2012 to 2033, by Distribution Channel

Table 13: Europe Market Value (US$ Million) Analysis 2012 to 2022 and Forecast 2023 to 2033, by Country

Table 14: Europe Market Volume (Units) Analysis and Forecast 2012 to 2033, by Country

Table 15: Europe Market Value (US$ Million) Analysis and Forecast 2012 to 2033, by Indication

Table 16: Europe Market Value (US$ Million) Analysis and Forecast 2012 to 2033, by Distribution Channel

Table 17: South Asia Market Value (US$ Million) Analysis 2012 to 2022 and Forecast 2023 to 2033, by Country

Table 18: South Asia Market Volume (Units) Analysis and Forecast 2012 to 2033, by Country

Table 19: South Asia Market Value (US$ Million) Analysis and Forecast 2012 to 2033, by Indication

Table 20: South Asia Market Value (US$ Million) Analysis and Forecast 2012 to 2033, by Distribution Channel

Table 21: East Asia Market Value (US$ Million) Analysis 2012 to 2022 and Forecast 2023 to 2033, by Country

Table 22: East Asia Market Volume (Units) Analysis and Forecast 2012 to 2033, by Country

Table 23: East Asia Market Value (US$ Million) Analysis and Forecast 2012 to 2033, by Indication

Table 24: East Asia Market Value (US$ Million) Analysis and Forecast 2012 to 2033, by Distribution Channel

Table 25: Oceania Market Value (US$ Million) Analysis 2012 to 2022 and Forecast 2023 to 2033, by Country

Table 26: Oceania Market Volume (Units) Analysis and Forecast 2012 to 2033, by Country

Table 27: Oceania Market Value (US$ Million) Analysis and Forecast 2012 to 2033, by Indication

Table 28: Oceania Market Value (US$ Million) Analysis and Forecast 2012 to 2033, by Distribution Channel

Table 29: Middle East and Africa Market Value (US$ Million) Analysis 2012 to 2022 and Forecast 2023 to 2033, by Country

Table 30: Middle East and Africa Market Volume (Units) Analysis and Forecast 2012 to 2033, by Country

Table 31: Middle East and Africa Market Value (US$ Million) Analysis and Forecast 2012 to 2033, by Indication

Table 32: Middle East and Africa Market Value (US$ Million) Analysis and Forecast 2012 to 2033, by Distribution Channel

List of Figures

Figure 01: Global Market Volume (Units), 2012 to 2022

Figure 02: Global Market Volume (Units) & Y-o-Y Growth (%) Analysis, 2023 to 2033

Figure 03: Pricing Analysis per unit (US$), in 2023

Figure 04: Pricing Forecast per unit (US$), in 2033

Figure 05: Global Market Value (US$ Million) Analysis, 2012 to 2022

Figure 06: Global Market Forecast & Y-o-Y Growth, 2023 to 2033

Figure 07: Global Market Absolute $ Opportunity (US$ Million) Analysis, 2022 to 2033

Figure 08: Global Market Value Share (%) Analysis 2023 and 2033, by Indication

Figure 09: Global Market Y-o-Y Growth (%) Analysis 2022 to 2033, by Indication

Figure 10: Global Market Attractiveness Analysis 2023 to 2033, by Indication

Figure 11: Global Market Value Share (%) Analysis 2023 and 2033, by Distribution Channel

Figure 12: Global Market Y-o-Y Growth (%) Analysis 2022 to 2033, by Distribution Channel

Figure 13: Global Market Attractiveness Analysis 2023 to 2033, by Distribution Channel

Figure 14: Global Market Value Share (%) Analysis 2023 and 2033, by Region

Figure 15: Global Market Y-o-Y Growth (%) Analysis 2022 to 2033, by Region

Figure 16: Global Market Attractiveness Analysis 2023 to 2033, by Region

Figure 17: North America Market Value (US$ Million) Analysis, 2012 to 2022

Figure 18: North America Market Value (US$ Million) Forecast, 2023 to 2033

Figure 19: North America Market Value Share, by Indication (2023 E)

Figure 20: North America Market Value Share, by Distribution Channel (2023 E)

Figure 21: North America Market Value Share, by Country (2023 E)

Figure 22: North America Market Attractiveness Analysis by Indication, 2023 to 2033

Figure 23: North America Market Attractiveness Analysis by Distribution Channel, 2023 to 2033

Figure 24: North America Market Attractiveness Analysis by Country, 2023 to 2033

Figure 25: USA Market Value Proportion Analysis, 2022

Figure 26: Global Vs. USA Growth Comparison

Figure 27: USA Market Share Analysis (%) by Indication, 2022 & 2033

Figure 28: USA Market Share Analysis (%) by Distribution Channel, 2022 & 2033

Figure 29: Canada Market Value Proportion Analysis, 2022

Figure 30: Global Vs. Canada. Growth Comparison

Figure 31: Canada Market Share Analysis (%) by Indication, 2022 & 2033

Figure 32: Canada Market Share Analysis (%) by Distribution Channel, 2022 & 2033

Figure 33: Latin America Market Value (US$ Million) Analysis, 2012 to 2022

Figure 34: Latin America Market Value (US$ Million) Forecast, 2023 to 2033

Figure 35: Latin America Market Value Share, by Indication (2023 E)

Figure 36: Latin America Market Value Share, by Distribution Channel (2023 E)

Figure 37: Latin America Market Value Share, by Country (2023 E)

Figure 38: Latin America Market Attractiveness Analysis by Indication, 2023 to 2033

Figure 39: Latin America Market Attractiveness Analysis by Distribution Channel, 2023 to 2033

Figure 40: Latin America Market Attractiveness Analysis by Country, 2023 to 2033

Figure 41: Mexico Market Value Proportion Analysis, 2022

Figure 42: Global Vs Mexico Growth Comparison

Figure 43: Mexico Market Share Analysis (%) by Indication, 2022 & 2033

Figure 44: Mexico Market Share Analysis (%) by Distribution Channel, 2022 & 2033

Figure 45: Brazil Market Value Proportion Analysis, 2022

Figure 46: Global Vs. Brazil. Growth Comparison

Figure 47: Brazil Market Share Analysis (%) by Indication, 2022 & 2033

Figure 48: Brazil Market Share Analysis (%) by Distribution Channel, 2022 & 2033

Figure 49: Argentina Market Value Proportion Analysis, 2022

Figure 50: Global Vs Argentina Growth Comparison

Figure 51: Argentina Market Share Analysis (%) by Indication, 2022 & 2033

Figure 52: Argentina Market Share Analysis (%) by Distribution Channel, 2022 & 2033

Figure 53: Europe Market Value (US$ Million) Analysis, 2012 to 2022

Figure 54: Europe Market Value (US$ Million) Forecast, 2023 to 2033

Figure 55: Europe Market Value Share, by Indication (2023 E)

Figure 56: Europe Market Value Share, by Distribution Channel (2023 E)

Figure 57: Europe Market Value Share, by Country (2023 E)

Figure 58: Europe Market Attractiveness Analysis by Indication, 2023 to 2033

Figure 59: Europe Market Attractiveness Analysis by Distribution Channel, 2023 to 2033

Figure 60: Europe Market Attractiveness Analysis by Country, 2023 to 2033

Figure 61: UK Market Value Proportion Analysis, 2022

Figure 62: Global Vs. UK Growth Comparison

Figure 63: UK Market Share Analysis (%) by Indication, 2022 & 2033

Figure 64: UK Market Share Analysis (%) by Distribution Channel, 2022 & 2033

Figure 65: Germany Market Value Proportion Analysis, 2022

Figure 66: Global Vs. Germany Growth Comparison

Figure 67: Germany Market Share Analysis (%) by Indication, 2022 & 2033

Figure 68: Germany Market Share Analysis (%) by Distribution Channel, 2022 & 2033

Figure 69: Italy Market Value Proportion Analysis, 2022

Figure 70: Global Vs. Italy Growth Comparison

Figure 71: Italy Market Share Analysis (%) by Indication, 2022 & 2033

Figure 72: Italy Market Share Analysis (%) by Distribution Channel, 2022 & 2033

Figure 73: France Market Value Proportion Analysis, 2022

Figure 74: Global Vs France Growth Comparison

Figure 75: France Market Share Analysis (%) by Indication, 2022 & 2033

Figure 76: France Market Share Analysis (%) by Distribution Channel, 2022 & 2033

Figure 77: Spain Market Value Proportion Analysis, 2022

Figure 78: Global Vs Spain Growth Comparison

Figure 79: Spain Market Share Analysis (%) by Indication, 2022 & 2033

Figure 80: Spain Market Share Analysis (%) by Distribution Channel, 2022 & 2033

Figure 81: Russia Market Value Proportion Analysis, 2022

Figure 82: Global Vs Russia Growth Comparison

Figure 83: Russia Market Share Analysis (%) by Indication, 2022 & 2033

Figure 84: Russia Market Share Analysis (%) by Distribution Channel, 2022 & 2033

Figure 85: BENELUX Market Value Proportion Analysis, 2022

Figure 86: Global Vs BENELUX Growth Comparison

Figure 87: BENELUX Market Share Analysis (%) by Indication, 2022 & 2033

Figure 88: BENELUX Market Share Analysis (%) by Distribution Channel, 2022 & 2033

Figure 89: East Asia Market Value (US$ Million) Analysis, 2012 to 2022

Figure 90: East Asia Market Value (US$ Million) Forecast, 2023 to 2033

Figure 91: East Asia Market Value Share, by Indication (2023 E)

Figure 92: East Asia Market Value Share, by Distribution Channel (2023 E)

Figure 93: East Asia Market Value Share, by Country (2023 E)

Figure 94: East Asia Market Attractiveness Analysis by Indication, 2023 to 2033

Figure 95: East Asia Market Attractiveness Analysis by Distribution Channel, 2023 to 2033

Figure 96: East Asia Market Attractiveness Analysis by Country, 2023 to 2033

Figure 97: China Market Value Proportion Analysis, 2022

Figure 98: Global Vs. China Growth Comparison

Figure 99: China Market Share Analysis (%) by Indication, 2022 & 2033

Figure 100: China Market Share Analysis (%) by Distribution Channel, 2022 & 2033

Figure 101: Japan Market Value Proportion Analysis, 2022

Figure 102: Global Vs. Japan Growth Comparison

Figure 103: Japan Market Share Analysis (%) by Indication, 2022 & 2033

Figure 104: Japan Market Share Analysis (%) by Distribution Channel, 2022 & 2033

Figure 105: South Korea Market Value Proportion Analysis, 2022

Figure 106: Global Vs South Korea Growth Comparison

Figure 107: South Korea Market Share Analysis (%) by Indication, 2022 & 2033

Figure 108: South Korea Market Share Analysis (%) by Distribution Channel, 2022 & 2033

Figure 109: South Asia Market Value (US$ Million) Analysis, 2012 to 2022

Figure 110: South Asia Market Value (US$ Million) Forecast, 2023 to 2033

Figure 111: South Asia Market Value Share, by Indication (2023 E)

Figure 112: South Asia Market Value Share, by Distribution Channel (2023 E)

Figure 113: South Asia Market Value Share, by Country (2023 E)

Figure 114: South Asia Market Attractiveness Analysis by Indication, 2023 to 2033

Figure 115: South Asia Market Attractiveness Analysis by Distribution Channel, 2023 to 2033

Figure 116: South Asia Market Attractiveness Analysis by Country, 2023 to 2033

Figure 117: India Market Value Proportion Analysis, 2022

Figure 118: Global Vs. India Growth Comparison

Figure 119: India Market Share Analysis (%) by Indication, 2022 & 2033

Figure 120: India Market Share Analysis (%) by Distribution Channel, 2022 & 2033

Figure 121: Indonesia Market Value Proportion Analysis, 2022

Figure 122: Global Vs. Indonesia Growth Comparison

Figure 123: Indonesia Market Share Analysis (%) by Indication, 2022 & 2033

Figure 124: Indonesia Market Share Analysis (%) by Distribution Channel, 2022 & 2033

Figure 125: Malaysia Market Value Proportion Analysis, 2022

Figure 126: Global Vs. Malaysia Growth Comparison

Figure 127: Malaysia Market Share Analysis (%) by Indication, 2022 & 2033

Figure 128: Malaysia Market Share Analysis (%) by Distribution Channel, 2022 & 2033

Figure 129: Thailand Market Value Proportion Analysis, 2022

Figure 130: Global Vs. Thailand Growth Comparison

Figure 131: Thailand Market Share Analysis (%) by Indication, 2022 & 2033

Figure 132: Thailand Market Share Analysis (%) by Distribution Channel, 2022 & 2033

Figure 133: Oceania Market Value (US$ Million) Analysis, 2012 to 2022

Figure 134: Oceania Market Value (US$ Million) Forecast, 2023 to 2033

Figure 135: Oceania Market Value Share, by Indication (2023 E)

Figure 136: Oceania Market Value Share, by Distribution Channel (2023 E)

Figure 137: Oceania Market Value Share, by Country (2023 E)

Figure 138: Oceania Market Attractiveness Analysis by Indication, 2023 to 2033

Figure 139: Oceania Market Attractiveness Analysis by Distribution Channel, 2023 to 2033

Figure 140: Oceania Market Attractiveness Analysis by Country, 2023 to 2033

Figure 141: Australia Market Value Proportion Analysis, 2022

Figure 142: Global Vs. Australia Growth Comparison

Figure 143: Australia Market Share Analysis (%) by Indication, 2022 & 2033

Figure 144: Australia Market Share Analysis (%) by Distribution Channel, 2022 & 2033

Figure 145: New Zealand Market Value Proportion Analysis, 2022

Figure 146: Global Vs New Zealand Growth Comparison

Figure 147: New Zealand Market Share Analysis (%) by Indication, 2022 & 2033

Figure 148: New Zealand Market Share Analysis (%) by Distribution Channel, 2022 & 2033

Figure 149: Middle East & Africa Market Value (US$ Million) Analysis, 2012 to 2022

Figure 150: Middle East & Africa Market Value (US$ Million) Forecast, 2023 to 2033

Figure 151: Middle East & Africa Market Value Share, by Indication (2023 E)

Figure 152: Middle East & Africa Market Value Share, by Distribution Channel (2023 E)

Figure 153: Middle East & Africa Market Value Share, by Country (2023 E)

Figure 154: Middle East & Africa Market Attractiveness Analysis by Indication, 2023 to 2033

Figure 155: Middle East & Africa Market Attractiveness Analysis by Distribution Channel, 2023 to 2033

Figure 156: Middle East & Africa Market Attractiveness Analysis by Country, 2023 to 2033

Figure 157: GCC Countries Market Value Proportion Analysis, 2022

Figure 158: Global Vs GCC Countries Growth Comparison

Figure 159: GCC Countries Market Share Analysis (%) by Indication, 2022 & 2033

Figure 160: GCC Countries Market Share Analysis (%) by Distribution Channel, 2022 & 2033

Figure 161: Türkiye Market Value Proportion Analysis, 2022

Figure 162: Global Vs. Türkiye Growth Comparison

Figure 163: Türkiye Market Share Analysis (%) by Indication, 2022 & 2033

Figure 164: Türkiye Market Share Analysis (%) by Distribution Channel, 2022 & 2033

Figure 165: South Africa Market Value Proportion Analysis, 2022

Figure 166: Global Vs. South Africa Growth Comparison

Figure 167: South Africa Market Share Analysis (%) by Indication, 2022 & 2033

Figure 168: South Africa Market Share Analysis (%) by Distribution Channel, 2022 & 2033

Figure 169: Northern Africa Market Value Proportion Analysis, 2022

Figure 170: Global Vs Northern Africa Growth Comparison

Figure 171: Northern Africa Market Share Analysis (%) by Indication, 2022 & 2033

Figure 172: Northern Africa Market Share Analysis (%) by Distribution Channel, 2022 & 2033

Frequently Asked Questions

Which are the Key Asian Countries in the Disposable Pen Injectors Market?

China, India, Japan, and South Korea are important Asian markets for single-use pen injectors.

Which Industry is the Key Consumer of Disposable Pen Injectors Market?

The pharmaceutical business is a major consumer of disposable pen injectors.

How Much can the Disposable Pen Injectors Market Grow by 2033 in Japan?

From 2023 to 2033, Japan's market for disposable pen injectors is anticipated to expand at a CAGR of 8.1%.

What is the Current Market Valuation of Disposable Pen Injectors Market?

The market for disposable pen injectors is now valued at USD 25.5 billion.

How Big will be the Disposable Pen Injectors Market by 2033?

By 2033, the market for disposable pen injectors is anticipated to reach USD 54.4 billion.

Explore Therapeutic Device Insights

Future Market Insights

Disposable Pen Injectors Market