The Disposable E-Cigarettes Market is estimated to be valued at USD 85.4 billion in 2025 and is projected to reach USD 222.2 billion by 2035, registering a compound annual growth rate (CAGR) of 10.0% over the forecast period.
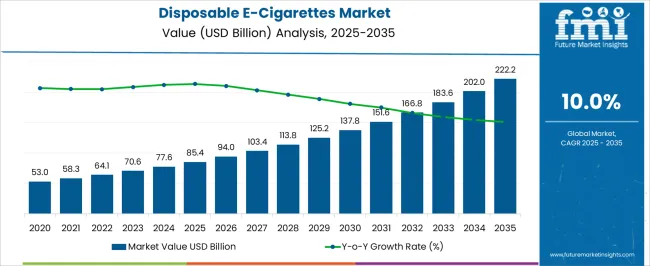
| Metric | Value |
|---|---|
| Disposable E-Cigarettes Market Estimated Value in (2025 E) | USD 85.4 billion |
| Disposable E-Cigarettes Market Forecast Value in (2035 F) | USD 222.2 billion |
| Forecast CAGR (2025 to 2035) | 10.0% |
The disposable e cigarettes market is expanding rapidly as consumer preferences shift toward convenient, low maintenance alternatives to traditional smoking and rechargeable vaping devices. Heightened awareness of harm reduction strategies, combined with rising demand for flavoured options, is propelling adoption across diverse demographics.
Regulatory discussions surrounding nicotine content and product design are influencing innovation, with manufacturers focusing on compliance while delivering consumer satisfaction. Advances in battery efficiency and compact device designs have further supported market penetration.
Additionally, the rise of digital retail platforms and direct to consumer sales is accelerating product availability and visibility. The overall market outlook remains positive, underpinned by lifestyle driven demand, continuous product innovation, and expanding acceptance of vaping culture in both developed and emerging regions.
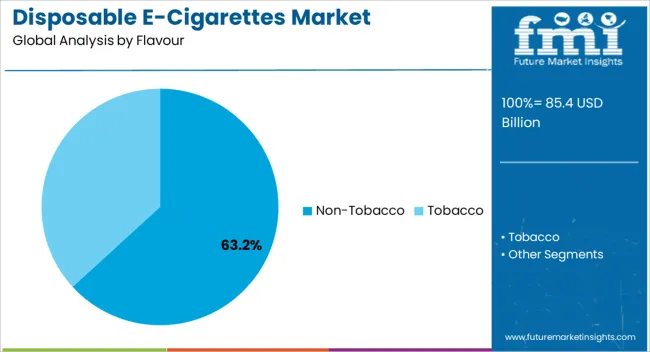
The non tobacco flavour segment is projected to account for 63.20% of total market revenue by 2025, positioning it as the leading flavour preference. This growth is attributed to increasing consumer demand for fruity, menthol, and dessert inspired profiles that deliver variety and enhance user experience.
The shift away from traditional tobacco flavours is being reinforced by younger adult demographics who prefer smoother taste profiles and novel blends. Regulatory scrutiny on tobacco consumption has also pushed consumers toward alternatives that emphasize flavour diversity without the stigma associated with conventional smoking.
The ability of non tobacco flavours to cater to evolving lifestyle choices and provide differentiation across brands has consolidated their dominance in this segment.
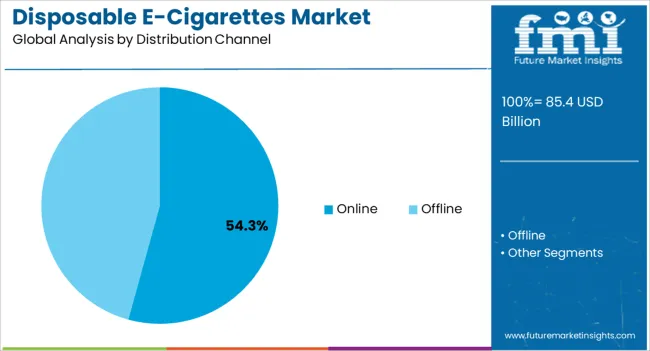
The online distribution channel is expected to hold 54.30% of total market revenue by 2025, establishing it as the dominant sales channel. Growth in this segment is being driven by the convenience of home delivery, wider product availability, and discreet purchasing options that appeal to diverse consumer groups.
E commerce platforms offer competitive pricing, bundled promotions, and subscription based models that enhance customer loyalty and repeat sales. Digital marketing and influencer led campaigns have further boosted visibility and adoption through online channels.
Additionally, the shift in consumer buying behavior toward digital platforms, accelerated by global e commerce expansion, has reinforced the leadership of online sales in the disposable e cigarettes market.
Rising Popularity among Millennials to Boost Market Growth
The rising traction of using disposable e-cigarettes among consumers, especially the millennial population, is expected to accelerate the market in the forthcoming years. Key players are launching new and innovative products to comply with the growing demand for these products among consumers. For instance,
The changing consumer shift toward smokeless and hassle-free cigarettes, without the need for recharging or refills, could help the market gain momentum in the upcoming years. For instance,
The product from the brand RELX x BubbleMon is available in two different styles such as patterned color and plain block color. The devices feature a transparent oil cabinet that reveals the levels of e-liquid remaining within the device, enabling consumers to know when to purchase a new device. Further, the growing inclination of consumers toward different flavored products such as cinnamon, berry, vanilla, saffron, and apple might provide a significant opportunity for the players operating in the market for disposable e-cigarettes. For instance,
Increasing Risks Associated with Smoking to Impede the Market Growth
The increasing potential risk caused at each stage of the disposable e-cigarette product lifecycle, including mining, manufacturing, using, and disposing of, could pose potential environmental harm. In turn, it is expected to impede the growth of the disposable e-cigarettes industry.
According to an article published by Truth Initiative, in March 2024, almost half (49.1%) of young people don’t know what to do with used e-cigarette pods and disposable devices. The resulting e-waste is often shipped from Western countries to developing countries, which places the environmental hazard of reprocessing, reclaiming, and incinerating waste on poorer nations. All these factors are anticipated to hinder the growth of the disposable e-cigarette industry over the analysis period.
The disposable e-cigarettes industry’s size developed at a CAGR of 9.4% from 2020 to 2025. In 2020, the global market size stood at USD 44,280.5 million. In the following years, the market witnessed substantial growth, accounting for USD 63,428.1 million in 2025.
Disposable e-cigarettes are assumed to be a safe alternative to rechargeable e-cigarettes, which in turn is expected to fuel the market growth during the forecast period. Additionally, increasing acceptance of different vaping devices among young adults and adolescents is set to fuel the growth of the disposable e-cigarettes industry.
| Historical CAGR (2020 to 2025) | 9.4% |
|---|---|
| Forecasted CAGR (2025 to 2035) | 10.50% |
The key players in the market started offering these products online through various e-commerce websites such as Amazon. According to an article published by Truth Initiative, in June 2024, online retail for e-cigarettes including disposable products was 28%. In addition, the availability of approved disposable e-cigarettes from various health bodies such as the National Medical Products Administration (NMPA), as a better alternative to tobacco smoking, may integrate well with the growth trend.
Non-Tobacco Segment of Disposable E-cigarettes to Beat Competition in Untiring Markets
The non-tobacco held a revenue share of 69.4% in 2025 and is expected to maintain dominance during the forecast period. Growing consumer awareness about the degenerating effect of tobacco consumption is expected to drive the market in the forecast period.
According to an article published by the British Medical Journal (BMJ), in February 2024, around 11.2% of consumers in South California used disposable e-cigarettes. Among these product users, fruit/candy (80.7%), mint (77.4%), and menthol (67.7%) were commonly preferred flavors, while tobacco flavors were less commonly preferred (19.4%).
Offline Segment to Constitute the Bulk of the Disposable E-cigarettes Industry
The offline segment dominated the market for disposable e-cigarettes and accounted for a prominent revenue share of 78.5% in 2025. The availability of disposable e-cigarettes in various stores, such as supermarkets and hypermarkets is the primary factor for its large value generation in the year 2024. For instance,
Easy accessibility of e-cigarette stores and vape shops to try out and test these devices before making a purchase decision is expected to drive the segment.
Rising Popularity of Flavoured Disposable E-cigarettes in the Region to Boost the Market Growth
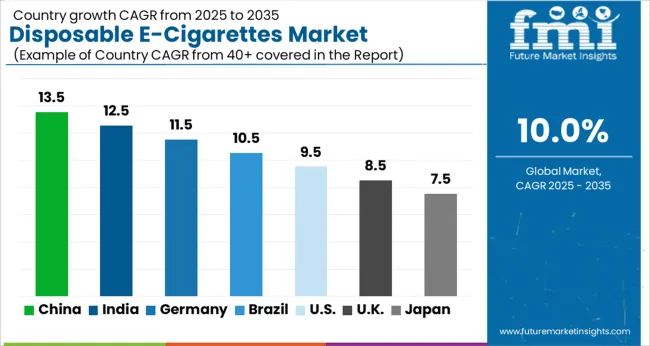
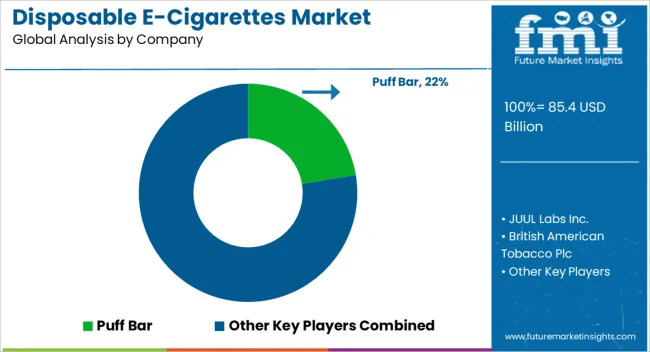
North America dominates the disposable e-cigarettes industry, accounting for a revenue share of 50.3% in 2025. The increasing popularity of flavored disposable e-cigarettes offered by brands such as Puff Bar, Vuse, and Suorin, is one of the leading factors that is expected to drive the growth of the industry in the region.
According to an article published by the United States Food and Drug Administration in March 2025, among students in the United States who currently used disposable e-cigarettes, Puff Bar was the most commonly reported usual brand (26.8%), followed by Vuse (10.5%), and Suorin (2.1%). Furthermore, the rising adoption of the product among millennials and Gen X is expected to boost the market growth.
High Adoption Rate of Disposable E-cigarettes in the Region to Fuel the Market Growth
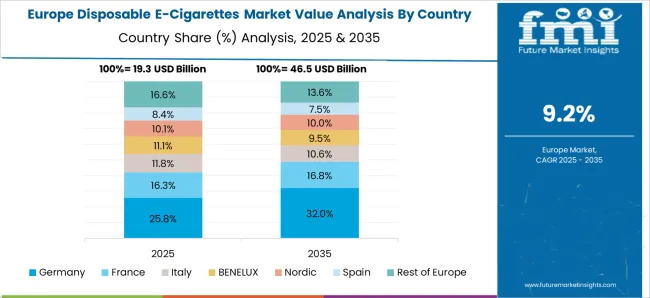
The disposable e-cigarettes market in Europe accumulated a revenue share of 32.3% in 2025. The rising adoption of the product among millennials and Generation X is expected to propel the growth of the disposable e-cigarettes market in the region. The trend of vaping is increasing simultaneously in both the United Kingdom and France.
The adoption rate of disposable e-cigarettes is significantly high in the United Kingdom, France, and Germany. Further, the demand for fruit-flavored e-cigarettes is also significantly gaining popularity in this region.
Growing Awareness about the Harmful Effects of Tobacco to Reaffirm Growth in the Region
The disposable e-cigarettes market in the Middle East & Africa is expected to accumulate a market share of 12.9% in 2025, attributed to the:
Key players in the industry are launching products in the region to comply with the growing demand for the product. For instance, in September 2024, RELX, a premium vaping brand was launched in Saudi Arabia. Vaping products are also available in the United Arab Emirates and Kuwait. The launch comes in the form of a healthy alternative to cigarettes.
The Start-Up Ecosystem: How Key Players are Opening Frontiers for Future Growth?
Given the increasing preference amongst millennials and other tobacco consumers for smoke-free tobacco products, the interest in disposable e-cigarettes is only expected to rise in forthcoming years. Consequently, leading start-ups offering disposable e-cigarettes have appeared in the limelight. Some notable players are as follows:
| Start-up | Litejoy |
|---|---|
| Origin | India |
| Year of Establishment | 2012 |
| Start-up | MYLE Vape |
|---|---|
| Origin | The United States |
| Year of Establishment | 2020 |
| Start-up | Ambition Vape |
|---|---|
| Origin | China |
| Year of Establishment | 2020 |
| Start-up | Smokeshop |
|---|---|
| Origin | Sweden |
| Year of Establishment | 2020 |
| Start-up | The Electronic Cigarette Company |
|---|---|
| Origin | The United Kingdom |
| Year of Establishment | 2008 |
Recent Developments Observed by FMI:
| Attribute | Details |
|---|---|
| Forecast Period | 2025 to 2035 |
| Historical Data Available for | 2020 to 2025 |
| Market Analysis | USD million for Value |
| Key Regions Covered | North America; Latin America; Europe; Asia Pacific; The Middle East & Africa (MEA) |
| Key Countries Covered | The United States, Canada, Germany, The United Kingdom, Nordic, Russia, BENELUX, Poland, France, Spain, Italy, Czech Republic, Hungary, Rest of EMEAI, Brazil, Peru, Argentina, Mexico, South Africa, Northern Africa, GCC Countries, China, Japan, South Korea, India, ASIAN, Thailand, Malaysia, Indonesia, Australia, New Zealand, Others |
| Key Segments Covered | Flavour, Distribution Channel, Region |
| Report Coverage | Market Forecast, Company Share Analysis, Competition Intelligence, Trend Analysis, Market Dynamics and Challenges, and Strategic Growth Initiatives |
The global disposable e-cigarettes market is estimated to be valued at USD 85.4 billion in 2025.
The market size for the disposable e-cigarettes market is projected to reach USD 222.2 billion by 2035.
The disposable e-cigarettes market is expected to grow at a 10.0% CAGR between 2025 and 2035.
The key product types in disposable e-cigarettes market are non-tobacco and tobacco.
In terms of distribution channel, online segment to command 54.3% share in the disposable e-cigarettes market in 2025.


Our Research Products

The "Full Research Suite" delivers actionable market intel, deep dives on markets or technologies, so clients act faster, cut risk, and unlock growth.

The Leaderboard benchmarks and ranks top vendors, classifying them as Established Leaders, Leading Challengers, or Disruptors & Challengers.

Locates where complements amplify value and substitutes erode it, forecasting net impact by horizon

We deliver granular, decision-grade intel: market sizing, 5-year forecasts, pricing, adoption, usage, revenue, and operational KPIs—plus competitor tracking, regulation, and value chains—across 60 countries broadly.

Spot the shifts before they hit your P&L. We track inflection points, adoption curves, pricing moves, and ecosystem plays to show where demand is heading, why it is changing, and what to do next across high-growth markets and disruptive tech

Real-time reads of user behavior. We track shifting priorities, perceptions of today’s and next-gen services, and provider experience, then pace how fast tech moves from trial to adoption, blending buyer, consumer, and channel inputs with social signals (#WhySwitch, #UX).

Partner with our analyst team to build a custom report designed around your business priorities. From analysing market trends to assessing competitors or crafting bespoke datasets, we tailor insights to your needs.
Supplier Intelligence
Discovery & Profiling
Capacity & Footprint
Performance & Risk
Compliance & Governance
Commercial Readiness
Who Supplies Whom
Scorecards & Shortlists
Playbooks & Docs
Category Intelligence
Definition & Scope
Demand & Use Cases
Cost Drivers
Market Structure
Supply Chain Map
Trade & Policy
Operating Norms
Deliverables
Buyer Intelligence
Account Basics
Spend & Scope
Procurement Model
Vendor Requirements
Terms & Policies
Entry Strategy
Pain Points & Triggers
Outputs
Pricing Analysis
Benchmarks
Trends
Should-Cost
Indexation
Landed Cost
Commercial Terms
Deliverables
Brand Analysis
Positioning & Value Prop
Share & Presence
Customer Evidence
Go-to-Market
Digital & Reputation
Compliance & Trust
KPIs & Gaps
Outputs
Full Research Suite comprises of:
Market outlook & trends analysis
Interviews & case studies
Strategic recommendations
Vendor profiles & capabilities analysis
5-year forecasts
8 regions and 60+ country-level data splits
Market segment data splits
12 months of continuous data updates
DELIVERED AS:
PDF EXCEL ONLINE
Disposable Medical Gowns Market Size and Share Forecast Outlook 2025 to 2035
Disposable Drills Market Size and Share Forecast Outlook 2025 to 2035
Disposable Food Containers Market Size and Share Forecast Outlook 2025 to 2035
Disposable Protective Apparel Market Size and Share Forecast Outlook 2025 to 2035
Disposable Plates Market Size and Share Forecast Outlook 2025 to 2035
Disposable Hygiene Adhesives Market Size and Share Forecast Outlook 2025 to 2035
Disposable Umbilical Cord Protection Bag Market Size and Share Forecast Outlook 2025 to 2035
Disposable Pen Injectors Market Size and Share Forecast Outlook 2025 to 2035
Disposable Trocars Market Analysis - Size, Share, and Forecast Outlook 2025 to 2035
Disposable Cups Market Size and Share Forecast Outlook 2025 to 2035
Disposable Electric Toothbrushes Market Size and Share Forecast Outlook 2025 to 2035
Disposable Barrier Sleeves Market Size and Share Forecast Outlook 2025 to 2035
Disposable Plastic Pallet Market Size and Share Forecast Outlook 2025 to 2035
Disposable Curd Cups Market Size and Share Forecast Outlook 2025 to 2035
Disposable Egg Trays Market Size and Share Forecast Outlook 2025 to 2035
Disposable Blood Pressure Cuffs Market Analysis - Size, Share & Forecast 2025 to 2035
Disposable Cutlery Market Size, Growth, and Forecast 2025 to 2035
Disposable Spinal Instruments Market Analysis - Size, Share, and Forecast 2025 to 2035
Disposable Lids Market Analysis - Growth & Forecast 2025 to 2035
Disposable Face Mask Market Insights – Growth & Demand 2025 to 2035

Thank you!
You will receive an email from our Business Development Manager. Please be sure to check your SPAM/JUNK folder too.
Chat With
MaRIA