The global Large Volume Wearable Injectors Market is estimated to be valued at USD 3,616.1 million in 2025 and is projected to reach USD 8,482.4 million by 2035, registering a compound annual growth rate (CAGR) of 8.9% over the forecast period. The market is experiencing accelerated growth driven by rising biologic drug volumes, increasing patient demand for home-based therapies, and payer-driven shifts toward outpatient drug delivery.
These wearable systems enable subcutaneous administration of 3 mL to 50 mL doses, offering a non-invasive alternative to infusion centers and improving treatment adherence in chronic conditions such as oncology, autoimmune diseases, and rare metabolic disorders. Future, growth will be heavily influenced by expanding oncology applications, drug self-administration trends, and continued convergence of wearable injectors with digital adherence monitoring platforms, positioning Large Volume Wearable Injectors at the forefront of drug delivery models globally.
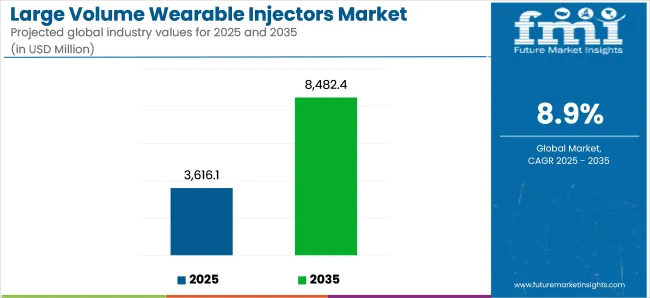
| Attributes | Key Insights |
|---|---|
| Estimated Size, 2025 | USD 3,616.1 million |
| Projected Size, 2035 | USD 8,482.4 million |
| Value-based CAGR (2025 to 2035) | 8.9% |
Key manufacturers actively shaping the large volume wearable injectors market include West Pharmaceutical Services, Ypsomed, Enable Injections, Tandem Diabetes, CeQur, and Stevanato Group. These companies are developing flexible wearable platforms to accommodate viscous biologics, protein therapeutics, and long-acting monoclonal antibodies. Critical growth drivers include growing biopharma partnerships, expanding drug-device combination filings, and increasing payer support for decentralized chronic disease management.
In 2024, SCHOTT Pharma launches large format ready-to-use cartridges for on-body devices. “With our large format RTU cartridges, we are actively supporting pharma companies, who are transitioning the drug administration from intravenous infusion to subcutaneous injection,” says Andreas Reisse, CEO of SCHOTT Pharma. “We are thereby empowering patients to self-administer also large volume medications, which is a real game-changer for them. This launch reflects the market’s pivot toward larger capacity cartridges, enabling pharma companies to shift costly infusion therapies into lower-cost outpatient and home settings while improving adherence and patient satisfaction.
North America dominates the Large Volume Wearable Injectors market, driven by early regulatory clarity from the FDA’s combination product pathway and rapid adoption by USA payers seeking cost-effective home-based delivery solutions.
Major biopharma companies are filing NDA/BLA submissions with integrated wearable injector components, while specialty pharmacies increasingly dispense LVWI-compatible therapies. The USA market is further strengthened by extensive pharma-device partnerships and ongoing investment in digital-enabled adherence monitoring, reinforcing North America’s leadership in driving decentralized biologic drug delivery adoption.
Europe’s Large Volume Wearable Injectors market is expanding, driven by national health system interest in reducing hospital infusion costs, improving patient autonomy, and integrating drug-device reimbursement frameworks. Germany & the UK are the leading adoption through pilot programs involving oncology and immunology therapies delivered via wearable injectors at home. EU-funded projects are investigating large volume subcutaneous delivery for metabolic, cardiovascular, and enzyme replacement therapies.
The below table presents the expected CAGR for the global large volume wearable injectors market over several semi-annual periods spanning from 2024 to 2034. In the first half (H1) of the decade from 2024 to 2034, the business is predicted to surge at a CAGR of 10.1%, followed by a slightly lower growth rate of 9.6% in the second half (H2) of the same decade.
| Particular | Value CAGR |
|---|---|
| H1 (2024 to 2034) | 10.1% |
| H2 (2024 to 2034) | 9.6% |
| H1 (2025 to 2035) | 8.9% |
| H2 (2025 to 2035) | 8.4% |
Moving into the subsequent period, from H1 2025 to H2 2035, the CAGR is projected to decrease slightly to 8.9% in the first half and remain relatively moderate at 8.4% in the second half. In the first half (H1) the market witnessed a decrease of 120 BPS while in the second half (H2), the market witnessed a decrease of 120 BPS.
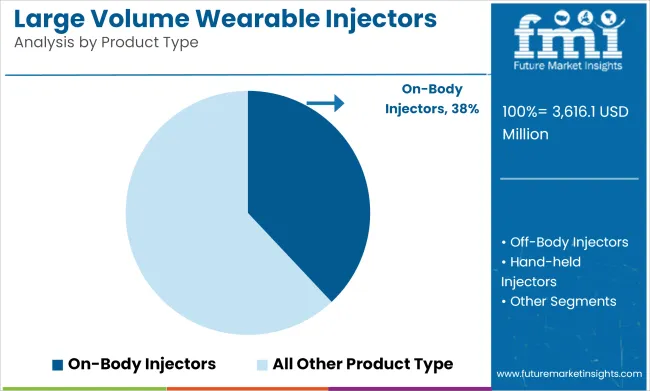
In 2025, on-body wearable injectors are expected to hold 38.0% of the revenue share in the large volume wearable injectors market. This dominance is driven by the convenience, portability, and patient-centered design of on-body injectors, which enable the delivery of large volumes of medication outside a clinical setting.
These devices allow for continuous, self-administered injections, making them especially useful for chronic conditions that require frequent, large-volume drug delivery, such as autoimmune diseases and cancer therapies.
The growth of this segment has been fueled by advances in drug delivery technology, including improved battery life, enhanced ergonomics, and user-friendly interfaces. Additionally, the ability to provide subcutaneous injections with minimal discomfort and the growing trend toward home-based healthcare have reinforced the demand for on-body wearable injectors.
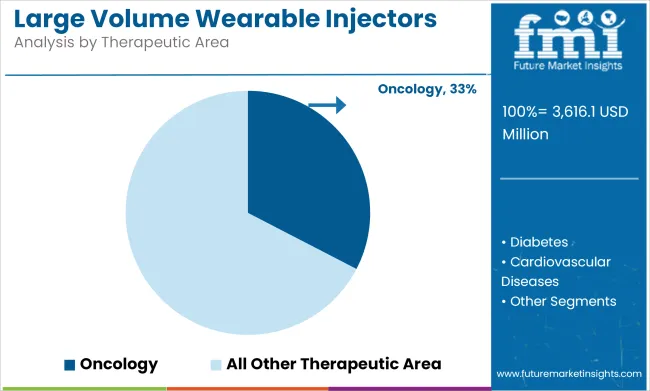
In 2025, oncology is projected to account for 32.6% of the revenue share in the large volume wearable injectors market. This leadership is attributed to the rising demand for precise, consistent, and large-volume drug delivery in cancer treatment. Oncology therapies often require high-dose, continuous, or frequent injections of chemotherapy, biologics, or immunotherapy agents, making wearable injectors ideal for improving treatment adherence and reducing the need for hospital visits.
The growth of this segment has been driven by the increasing prevalence of cancer, the shift toward outpatient treatment models, and the push for personalized medicine that requires tailored and sustained drug delivery. Additionally, wearable injectors provide better control over drug dosing and minimize the risk of human error, making them essential in complex oncological therapies.
The advancements in wearable injector technology, such as the integration of sensors for real-time monitoring, have further fueled the adoption of wearable injectors in oncology, solidifying the segment’s leading position in the market.
Growing prevalence of Diabetes, Cancer, and Other Chronic Disease has driven the Industry Growth
The global rise in chronic diseases has created a growing need for long-term therapy. Traditional drug delivery methods are inconvenient and expensive. Large-volume wearable injectors offer a viable alternative in allowing self-administration of large-volume and high-viscosity drugs outside clinical settings.
These patients are able to flex their time for treatment without necessarily having to make frequent visits to the hospital, especially in cases of patients with mobility problems or those living in very remote areas.
The COVID-19 pandemic accelerated further the adoption of home-based healthcare solutions, showing more the need to minimize contact and alleviate strain from healthcare facilities. Wearable injectors were convenient at this time since they made sure therapy for patients on biologics and other large-volume medications was continuous.
Improvements in the field of digital health technologies have also added functionality to LVWIs, making them part of the home-based care model. Indeed, most modern wearable injectors have added capabilities such as wireless connectivity, automation of dosing, and incorporated health monitoring.
Such functionalities enable real-time data sharing between the patient and healthcare provider, thus ensuring better disease management. This trend evolves more patients who can have greater self-confidence in self-administration. Home-based healthcare is remodeling the LVWI market.
Growing Need for Real Time Diagnosis fuels Large Volume Wearable Injectors Industry Growth
Precision medicine focuses on tailoring treatments to individual characteristics, such as a person's genome, life style, and the dynamics of his or her disease. This calls for advanced drug delivery systems that are capable of supporting personalized treatment regimens, with LVWIs being the enabling technology for such a shift.
Precision medicine many times relies on biologics and other complex therapies that need very precise dosing and controlled delivery over a very long period of time. Many of these new drugs are extremely viscous and voluminous, making the traditional injection route highly impractical.
LVWIs respond to this need by offering subcutaneous administration of large volumes in a comfortable and well-controlled way, matching the needs of precision medicine. These therapies can be self-administered by the patients themselves at home, making the treatment effective and convenient.
Precision medicine, on the other hand, calls for continuous monitoring in real time and modification of treatments according to the responses the patients show. Modern LVWIs are designed with smart technologies, such as wireless and IoT capabilities, that enable remote monitoring and data collection.
Such integration supports the dynamic nature of precision medicine by providing healthcare providers with actionable insights into a patient's adherence, dosing accuracy, and overall therapeutic response. Therefore, precision medicine will continue driving the demand for LVWI with acceleration.
Miniaturization of Large Volume Wearable Injectors Offers an Untapped Opportunity for Market Growth
Miniaturization of device technologies creates an opportunity for the growth of the LVWIs market. Additionally, miniaturization offers enhanced user experience, widening of patient populations, and opening of new areas for innovation.
The key driving elements of miniaturization are the size and weight of wearable injectors while maintaining their functionality. This leads to increased comfort and ease of wear, with wider application to patients undergoing long-term or frequent treatments.
With biologics and biosimilars dominating the pharmaceutical landscape, solutions are required by patients that can deliver high-volume, high-viscosity drugs with minimal discomfort. Traditional LVWIs may be large, unsightly, or otherwise cumbersome to wear, making them unpopular with many.
This barrier is overcome with miniaturized devices, offering compact, ergonomic designs that are less obtrusive and easier to use. The result is improved patient compliance, as the market expands into younger, more active users who favor discreet solutions for treatment.
Companies can use medical-grade polymer and biocompatible component materials, which are both lightweight and durable. These will enable compact devices to be built without reduced functionality.
Advanced manufacturing technologies, such as 3D printing and micromolding, will enable such production in higher volumes and at lower costs. Collaboration with patients and healthcare providers throughout the design process ensures ease and comfort with miniaturized devices.
The company should ensure that the ergonomic design fits seamlessly into daily routines. Miniaturization of device technologies overcomes the barriers for the adoption of LVWI and opens new frontiers to market growth.
Technical Errors in the Wearable Injectors Hinder the Market Growth
Malfunctions such as dosing inaccuracies, device clogging or battery failures can compromise therapy effectiveness and pose safety risks. If the device fails to timely deliver the required drug dosage it can lead to suboptimal outcomes or adverse reactions. Wearable injectors rely on adhesives to stay attached to the patient’s skin during drug delivery.
Sweating or body movement or sensitivity to adhesives can cause the device to detach. This interrupts treatment and reduces patient confidence in the technology. This is especially true for patients with active lifestyles or sensitive skin.
Although LVWIs are designed to simplify drug administration, some patients, especially the elderly or those with limited technological proficiency, may find these devices challenging to operate. LVWIs must handle a wide range of drug formulations, including biologics with high viscosity and unique stability requirements.
However, not all formulations are compatible with existing LVWI technology, limiting their applicability. This incompatibility can prevent pharmaceutical companies from fully integrating wearable injectors into their drug delivery plans. These technical and operational issues significantly hamper market growth by reducing user satisfaction and trust in the technology.
Companies in the Tier 1 sector account for 52.0% of the global market, ranking them as the dominant players in the industry. Tier 1 players’ offer a wide range of product and have established industry presence. Having financial resources enables them to enhance their research and development efforts and expand into new markets.
A strong brand recognition and a loyal customer base provide them with a competitive advantage. Prominent companies within Tier 1 include Becton, Dickinson and Company, Johnson & Johnson Services, Inc., F. Hoffmann-La Roche Ltd., Amgen, Inc., Medtronic Plc, and others
Tier 2 players dominate the industry with a 34.8% market share. Tier 2 firms have a strong focus on a specific Product and a substantial presence in the industry, but they have less influence than Tier 1 firms.
The players are more competitive when it comes to pricing and target niche markets. New Product and services will also be introduced into the industry by Tier 2 companies. Tier 2 companies include Insulet Corporation, Tandem Diabetes Care, Inc., PerkinElmer, Inc., and others.
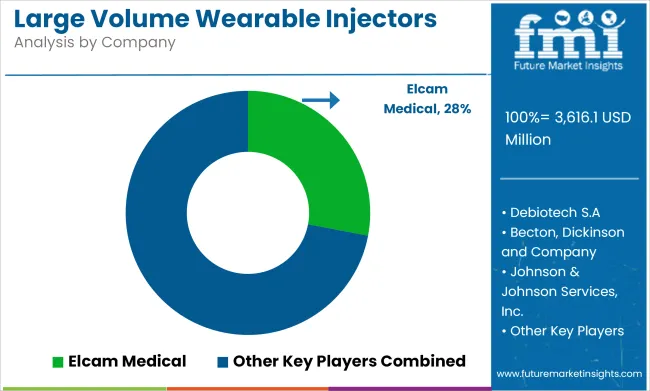
Compared to Tiers 1 and 2, Tier 3 companies have smaller revenue spouts and less influence. Those in Tier 3 have smaller work force and limited presence across the globe. Prominent players in the tier 3 category are Elcam Medical, Debiotech S.A, CeQur SA, and others.
The section below covers the industry analysis for the large volume wearable injectors for different countries. Market demand analysis on key countries in several regions of the globe, including North America, Latin America, East Asia, South Asia and Pacific, Western Europe, Eastern Europe, and Middle East and Africa (MEA), is provided.
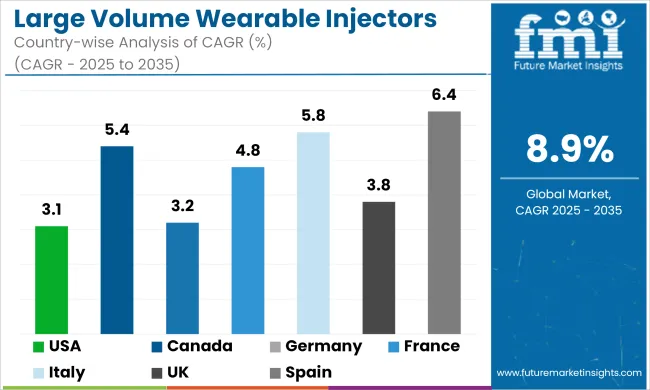
The United States is anticipated to remain at the forefront in North America through 2035. India is projected to witness a CAGR of 12.7% from 2025 to 2035.
| Countries | Value CAGR (2025 to 2035) |
|---|---|
| United States | 3.1% |
| Canada | 5.4% |
| Germany | 3.2% |
| France | 4.8% |
| Italy | 5.8% |
| UK | 3.8% |
| Spain | 6.4% |
| China | 12.1% |
The United States leads the way in developing biologic therapies. Most biologic therapies are based on large volumes of drugs that must be taken for extended durations.
Biologics are administered to treat diabetes, rheumatoid arthritis, cardiovascular diseases, and cancer-conditions that are highly incident or prevalent in the USA Wearable injectors therefore come out to be a very viable solution for such therapies. This allows self-administration at home and decreases dependence on healthcare facilities, meeting both the requirements of patients and healthcare systems.
Other factors include a high prevalence of obesity and an increase in the elderly population. Such epidemiological trends further increase the need for advanced systems of drug delivery. According to CDC estimates, roughly 42 percent of adults within the USA have obesity.
The percentage of the aged is continuing to increase. This results in increased burden of chronic diseases. Large Volume Wearable Injectors improve the adherence to medication and patient outcomes. They offer a painless, user-friendly alternative to traditional injections or intravenous therapies.
Large Volume Wearable Injectors address German healthcare philosophy by offering a convenient and less invasive method for drug delivery. The key benefit these devices present to the patient involves the ability to self-administer at home many of these complex biologics by overcoming frequent hospital visits, and therefore, improving adherence to treatment.
This is particularly useful in the management of chronic diseases, including rheumatoid arthritis and multiple sclerosis, which require consistent and long-term therapy.
Germany is leading this wide diffusion of digital health technologies. Being one of the first to integrate health technology into mainstream care, the country has created a rich ecosystem in which an innovative medical device can thrive. Wearable injectors complete with connectivity for health monitoring applications that track vital signs in near real-time provide a good fit for that environment.
That will continue to be empowering for the patients and healthcare professionals-for visibility into treatments that are working so interventions can happen on time to further improve the clinical outcomes.
With an aging population in Japan and the cultural preference for minimally invasive medical solutions, there are serious healthcare challenges associated with chronic and degenerative diseases like diabetes, cardiovascular conditions, and even cancer. Since all these conditions, more often than not, need long-term management, LVWIs offer a patient-friendly alternative to frequent hospital visits for treatments involving large-volume drug administration.
This technology allows patients to self-administer medications comfortably and conveniently at home, reducing the burden on both patients and healthcare infrastructure.
This preference of the Japanese population for medical technologies that reduce pain and discomfort is very well documented. LVWI offers that kind of preciseness, controlled delivery of medication for extended periods, with reduced invasiveness and anxiety associated with conventional modes of injections. This feature is especially appealing to elderly patients who may be particularly sensitive or have reduced dexterity.
The Japanese government actively supports the development and deployment of innovative medical technologies with favorable policies and investments in healthcare infrastructure. All these factors contributed to the growth of the market in Japan.
Companies are forming partnerships to integrate expertise in drug development, manufacturing, and device assembly. These partnerships aim to streamline production processes and enhance product offerings. Key trends include advancements in sterile fill-finish capabilities and innovations in elastomer components.
There is also a focus on developing high-quality materials for large-volume auto-injectors and wearable devices. These efforts aim to meet the growing demand for efficient and patient-friendly self-injection solutions.
They also aim to facilitate faster market access and improve patient compliance in the biologics and injectables sector. Below are few example of recent key development within the space.
Recent Industry Developments in the Large Volume Wearable Injectors Market
In terms of product type, the industry is segmented into on-body injectors, off-body injectors, and hand-held injectors
In terms of therapeutic area, the industry is bifurcated into oncology, diabetes, cardiovascular diseases, autoimmune disorders, infectious diseases, and others
In terms of end user, the industry is bifurcated into hospitals, clinics, ambulatory surgical centers, and research institutes
Key countries of North America, Latin America, Western Europe, Eastern Europe, South Asia and Pacific, East Asia, the Middle East, and Africa have been covered in the report.
Large volume wearable injectors market is expected to increase at a CAGR of 8.9% between 2025 and 2035.
The on-body injectors large volume wearable injectors segment is expected to occupy 56.8% market share in 2025.
The market for large volume wearable injectors is expected to reach USD 8,482.4 million by 2035.
The United States is forecast to see a CAGR of 3.1% during the assessment period.
The key players in the large volume wearable injectors industry include Elcam Medical, Debiotech S.A, Becton, Dickinson and Company, Johnson & Johnson Services, Inc., F. Hoffmann-La Roche Ltd., Amgen, Inc., Insulet Corporation, CeQur SA, Medtronic Plc, Tandem Diabetes Care, Inc., PerkinElmer, Inc. and Others.


Full Research Suite comprises of:
Market outlook & trends analysis
Interviews & case studies
Strategic recommendations
Vendor profiles & capabilities analysis
5-year forecasts
8 regions and 60+ country-level data splits
Market segment data splits
12 months of continuous data updates
DELIVERED AS:
PDF EXCEL ONLINE
Large Synchronous Motor Market Size and Share Forecast Outlook 2025 to 2035
Large Mining Shovel Market Size and Share Forecast Outlook 2025 to 2035
Large Scale Bearing Market Size and Share Forecast Outlook 2025 to 2035
Large Spot Fiber Collimator Market Size and Share Forecast Outlook 2025 to 2035
Large Scale Variable Frequency Drives Market Size and Share Forecast Outlook 2025 to 2035
Large Capacity Stationary Fuel Cell Market Size and Share Forecast Outlook 2025 to 2035
Large Scale Medium Voltage Drives Market Size and Share Forecast Outlook 2025 to 2035
Large Industrial Displays Market Analysis - Size, Share, and Forecast Outlook 2025 to 2035
Large Granular Lymphocytic Leukemia (LGLL) Therapeutics Market - Growth, Demand & Outlook 2025 to 2035
Large Molecule Bioanalytical Testing Services Market - Growth & Demand 2025 to 2035
Large Diameter Steel Pipes Market Growth - Trends & Forecast 2025 to 2035
Large Format Display Market Report – Growth & Trends through 2034
Large Scale Natural Refrigerant Heat Pump Market Growth – Trends & Forecast (2024-2034)
Large Character Printers Market
Large Breed Dog Food Market
Built-in Large Cooking Appliance Market Insights – Growth & Forecast 2025 to 2035
Anaplastic Large Cell Lymphoma (ALCL) Therapeutics Market Size and Share Forecast Outlook 2025 to 2035
Freestanding Large Cooking Appliance Market Trends - Growth & Forecast 2025 to 2035
Volumetric Filing Lines Market Size and Share Forecast Outlook 2025 to 2035
Volumetric Cup Fillers Market Size and Share Forecast Outlook 2025 to 2035

Thank you!
You will receive an email from our Business Development Manager. Please be sure to check your SPAM/JUNK folder too.
Chat With
MaRIA