Reports

- Global Locations -

Headquarters

Future Market Insights, Inc.

Christiana Corporate, 200
Continental Drive, Suite 401,
Newark, Delaware - 19713,
United States

T: +1-845-579-5705

Americas

Future Market Insights, Inc.

616 Corporate Way, Suite 2-9018,
Valley Cottage, NY 10989, United States

T: +1-347-918-3531

MEA

Future Market Insights

1602-6 Jumeirah Bay X2 Tower, Plot No: JLT-PH2-X2A,
Jumeirah Lakes Towers, Dubai,
United Arab Emirates

Europe

Future Market Insights

3rd Floor, 207 Regent Street,
W1B 3HH London
United Kingdom

T: + 44 (0) 20 8123 9659
D: +44 (0) 20 3287 4268

Asia Pacific

Future Market Insights

IndiaLand Global Tech Park, Unit UG-1, Behind Grand HighStreet, Phase 1, Hinjawadi, MH, Pune – 411057, India

Large Scale Bearing Market Outlook (2023 to 2033)

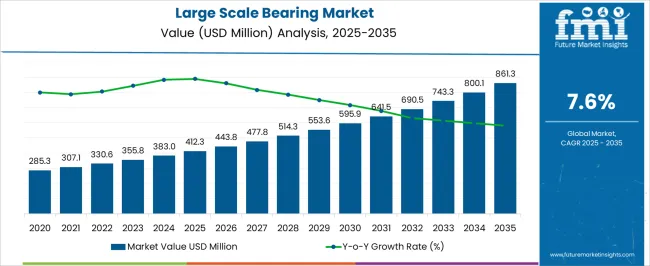
The global large scale bearing market size reached US$ 253.7 million in 2018. Demand for large scale bearings registered a 7.2% year-on-year growth in 2022, indicating that the global market would reach US$ 353.5 million in 2023.

Over the projection period (2023 to 2033), global sales of large scale bearings are expected to exhibit an 8.0% CAGR, ultimately totaling a market size of US$ 760.3 million by the end of 2033.

Due to ongoing expansion of wind power generation, large-scale bearings have become the optimum answer for several sectors of the power generating space. East Asia and North America are important locations where this need is likely to continue to rise.

Increasing pace of industrialization and automation across various sectors has led to a greater need for heavy machinery and equipment. As companies strive for greater efficiency and productivity, demand for large bearings that can withstand heavy loads and provide smooth rotation becomes crucial.

Ongoing expansion of infrastructure projects such as bridges, dams, and power plants has contributed to growing demand for large scale bearings. These projects require robust and reliable bearings to support the functioning of various components, ensuring smooth operation and longevity.

Rising energy production and distribution activities have also fueled demand for large scale bearings. This includes development of wind turbines, hydroelectric power plants, and thermal power stations, which rely on bearings to enable efficient rotation and power generation.

Transportation and logistics sector also plays a significant role in driving demand for large scale bearings. With growth of global trade and e-commerce, there is a need for reliable and durable bearings in vehicles, trains, ships, and conveyor systems to ensure smooth movement of goods and materials.

Other key drivers propelling large scale bearing demand include:

  • Expansion of large-scale public infrastructure projects in emerging countries is estimated to boost growth.
  • Rising energy production and distribution activities worldwide would help support the market.
  • Growing transportation and logistics sectors in both developed and developing nations would bode well for the market.
  • Advancements in renewable energy projects is a key factor driving the market forward.
  • Expansion of mining and construction activities worldwide is estimated to push sales.
  • Increasing demand for large-scale manufacturing plants in developing countries is set to augur well for the market.
  • Growth in demand from the aerospace and defense sectors is a crucial market driving factor.
  • Development and integration of advanced machinery and features for manufacturing processes is anticipated to accelerate sales.
Attributes Key Insights
Large Scale Bearing Market Estimated Size (2023E) US$ 353.5 million
Projected Market Valuation (2033F) US$ 760.3 million
Value-based CAGR (2023 to 2033) 8.0%

Don't pay for what you don't need

Customize your report by selecting specific countries or regions and save 30%!

How Will Sales of Large Scale Bearings between 2018 and 2022 Outpace Demand from 2023 to 2033?

The global market for large scale bearings grew at 6.7% CAGR from 2018 to 2022, reaching US$ 353.5 million in terms of value in 2023.

Demand for large scale bearings increased steadily from 2018 to 2022, driven by a variety of sectors, including wind turbines. However, prediction from 2023 to 2033 suggests that the market would experience a significant uptick as a result of expanding use of wind turbines around the world.

Demand for wind power generation is anticipated to increase as switch to renewable energy sources gathers steam, which will expand the need for dependable and effective large-scale bearings. These will be needed to support wind turbine operations. According to this prediction, the large scale bearing industry will have a bright future, with wind turbine applications being a key factor in its expansion.

Looking ahead, the global large scale bearing industry is expected to rise at a CAGR of 8.0% from 2023 to 2033. By 2033, the market size is expected to reach US$ 760.3 million.

The global market for large scale bearings is predicted to surge steadily between 2023 and 2033 as a result of rising concerns over air pollution and growing demand for renewable energy sources. Growth of the power production sector and rising usage of renewable energy sources are expected to fuel need for large scale bearings throughout the forecast period. The market is also likely to witness significant growth in East Asia and North America. Need for large-scale bearings in wind turbines is anticipated to rise further in these crucial regions due to ongoing expansion of the wind power generation sector.

Key Dynamics Shaping the Market for Large Scale Bearings Listed by Future Market Insights (FMI)

Challenges for Large Scale Bearing Manufacturers:

  • Constant need for innovation and technological advancements might prove to be a restraint.
  • Addressing cost pressures and maintaining competitive pricing can be challenging for manufacturers.
  • Managing environmental impact and sustainability concerns can hamper demand.
  • Addressing issues related to maintenance and after-sales service might be a hindrance.

Opportunities in the Global Large Scale Bearing Industry:

  • Integration of bearings in emerging technologies such as electric vehicles and autonomous systems can be a leading opportunity.
  • Growing demand for specialized bearings in the healthcare and medical equipment sector would spur the market.
  • Expansion of the wind energy sector might lead to increased demand for large scale bearings in wind turbines.
  • Rapid growth of the e-commerce sector is set to propel demand for efficient material handling and conveyor systems, further pushing sales.
  • Advancements in 3D printing technology are projected to create new opportunities for custom-designed and precision bearings.
  • Growing demand for large scale bearings in the marine and offshore sectors for applications such as ship propulsion systems and offshore drilling equipment would spur growth.

Latest Trends in the Global Large Scale Bearing Market:

  • Increasing importance of digital platforms for online sales, customization, and technical support in the large scale bearing sector is a key trend.
  • Surging use of lubrication-free and maintenance-free bearings to reduce operational costs and improve efficiency is projected to aid demand.
  • Implementation of industry 4.0 principles such as connectivity and data exchange, to enable smart manufacturing of bearings would help the market to expand.
  • Rising demand for sealed and shielded bearings to protect against contaminants & extend bearing life can be one of the latest trends.
  • Integration of machine learning & artificial intelligence algorithms in bearing design and optimization processes is expected to push the market.
  • Development of smart bearings with embedded electronics for real-time data collection & analysis is a latest trend.
Nikhil Kaitwade
Nikhil Kaitwade

Principal Consultant

Talk to Analyst

Find your sweet spots for generating winning opportunities in this market.

Comparative View of Adjacent Global Large Scale Bearing Markets

Large Scale Bearing Market:

Attributes Large Scale Bearing Market
CAGR (2023 to 2033) 8.0%
Market Value (2033) US$ 760.3 million
Opportunity Expansion of the use of additive manufacturing (3D printing) for customized bearing designs and rapid prototyping is set to open the door to new opportunities.
Key Trends Growing demand for bearing solutions in the renewable energy sector, particularly in wind and solar power applications is set to be a new trend.

Piston Seals Market:

Attributes Piston Seals Market
CAGR (2023 to 2033) 3.8%
Market Value (2033) US$ 3.4 billion
Opportunity Advancements in piston seal materials and designs, offering better durability and reliability are set to create new opportunities.
Key Trends Increasing awareness of the importance of sealing in preventing leaks and ensuring system integrity is a key trend.

Liquid Filtration Market:

Attributes Liquid Filtration Market
CAGR (2023 to 2033) 7.9%
Market Value (2033) US$ 5.8 billion
Opportunity Expansion of the healthcare and medical sector, requiring precise filtration solutions is likely to create novel opportunities.
Key Trends Expansion of the wastewater treatment sector to address environmental concerns worldwide would drive the market.

Country-wise Insights

Why is Large Scale Bearing Demand Surging in the United States?

United States-based Wind Energy Firms to Look for Large Size Bearings

Country The United States
CAGR % (2023 to 2033) US$ 685.3 million
Anticipated Value (2033) 6.6%

The United States large scale bearing industry is expected to reach a valuation of US$ 685.3 million by 2033, expanding at a CAGR of 6.6% in the assessment period. The United States is a prominent market in North America, benefiting from its well-established wind energy sector. Growing demand for reliable and high-performance large scale bearings in the country to support wind turbine operations would also spur growth.

Why Are Large Scale Bearing Sales Rising in the United Kingdom?

Advancement of Energy Infrastructure to Spur Demand in the United Kingdom

Country The United Kingdom
CAGR % (2023 to 2033) US$ 11.9 million
Anticipated Value (2033) 6.0%

The United Kingdom large scale bearing industry is expected to cross a value of US$ 11.9 million by 2033, elevating at a CAGR of 6.0% during the forecast period. In the United Kingdom, there is a strong focus on expanding renewable energy sources, including wind power.

It is hence set to create new opportunities for large scale bearing manufacturers. The United Kingdom, known for its advanced wind energy infrastructure, would further present a lucrative market for high-quality bearings in wind turbines.

Would China Become a Leading Hub for Large Scale Bearing Suppliers?

Investments in Renewable Energy in China to Support Growth through 2033

Country China
CAGR % (2023 to 2033) US$ 144.7 million
Anticipated Value (2033) 5.1%

China large scale bearing industry is anticipated to top a valuation of US$ 144.7 million in 2033. It is projected to progress at a CAGR 5.1% during the forecast period.

China, known for its significant investments in renewable energy, has witnessed substantial growth in wind power installations, driving demand for large scale bearings. Wind turbines require robust and reliable bearings to handle immense loads and harsh operating conditions. Hence, manufacturers are focusing on developing advanced bearing solutions that would help ensure optimal performance, durability, and efficiency.

Get the data you need at a Fraction of the cost

Personalize your report by choosing insights you need
and save 40%!

Category-wise Insights

In Which Domain Are Large Scale Bearings Most Commonly Employed?

Demand for Gear and Gearbox Bearings to Surge Exponentially Worldwide

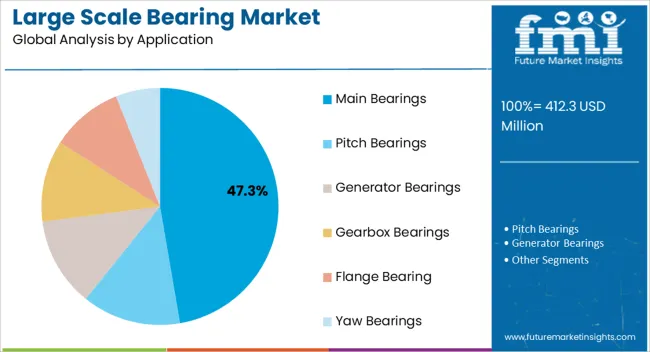
With a CAGR of 8.6% estimated from 2023 to 2033, the gearbox bearing segment is anticipated to rule the global large scale bearing industry. Due to its widespread application across numerous sectors, including automotive, aerospace, and industrial sectors, this segment is expected to hold a sizable market share in 2023.

It is estimated that there would continue to be a considerable need for gearbox bearings in the next ten years. Gearbox bearings are essential parts of gearboxes and play a significant function in ensuring the gearbox operates smoothly & effectively. In order to stay competitive in the market, gearbox producers are enhancing quality and performance of their in-house gearbox bearings.

What is the Prevailing Choice for Large Scale Bearings on a Global Scale?

Demand for Cylindrical Roller Bearings to Expand amid Ability to Enhance Precision

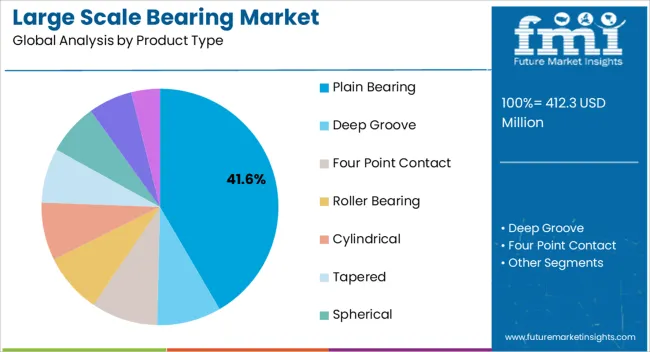
With a CAGR of 9.6% predicted from 2023 to 2033, the roller bearing segment is anticipated to lead the global large scale bearing market. As roller bearings are utilized in engines, transmissions, and suspension systems, among other applications, this market category will hold a sizable share.

Rise of the automotive sector is also driving demand for roller bearings. It is further set to propel demand for increased safety and comfort features. Rising desire for electric and autonomous vehicles globally would also bode well for the market.

Roller bearing is a key component in the global large scale bearing market. It is widely used in various industrial applications such as aerospace, automotive, and energy, among others.

Increasing demand for roller bearings in these sectors is expected to augment growth in the global market for large scale bearings. Roller bearings offer several advantages over traditional ball bearings, including improved load-carrying capacity, higher precision, and reduced friction.

They are also more durable and can operate in high-temperature environments. Hence, they are set to be an ideal solution for use in heavy-duty machinery and equipment.

How Key Players Can Stay Competitive in the Global Large Scale Bearing Industry?

The global large scale bearing industry is fiercely competitive, with multiple companies fighting for a higher market share. To stay ahead of the competition in such a circumstance, essential players must employ smart techniques. As a sales strategy, they are focusing on diversification, cost optimization, and development of an e-commerce platform.

A Few Key Strategies Adopted by Leading Players-

  • Focus on Quality and Durability

Quality and durability are important aspects driving the market for large scale bearings. Companies should prioritize the development of high-quality bearings that can sustain enormous loads and survive a long period. This can include using high-quality materials, investing in innovative production techniques, and putting stringent testing & quality control systems in place.

  • Develop Strategic Partnerships

To boost innovation and growth, firms should consider forming strategic alliances with other businesses and organizations. This can include working with suppliers, customers, and other stakeholders to create new products & services that meet market demands.

  • Invest in Research and Development

To stay ahead of the curve and produce new & creative products, companies in the large scale bearing market need to invest extensively in research & development. Collaboration with universities and research organizations, as well as investment in in-house research & development facilities, can be a part of this.

  • Expand into New Markets

Key Players are focusing on expanding into new markets in order to drive growth and innovation. This can include looking into new uses for large scale bearings such as in the renewable energy or aerospace sectors, as well as extending into new geographic markets.

Key Developments in the Global Large Scale Bearing Market:

  • In March 2023, for eAxles, NSK added more electrical erosion immune bearings to its portfolio. These bearings have conductive brushes and insulating polymer coatings. These will boost NSK's capacity to address various client needs concerning electrical erosion and contribute to increased EV dependability and range.
  • In January 2023, Honda Lock Mfg. Co., Ltd.'s complete acquisition of all of its shares was announced by Minebea Mitsumi. Prior to August 2022, the business and Honda Motor Co., Ltd. had a share transfer arrangement in place for the purchase of Honda Lock Mfg. Co., Ltd. shares.
  • In September 2022, GGB Bearing Technology (GGB), a branch of Enpro, was purchased by The Timken Company. GGB, which was founded in 1899. It offers a distinctive product portfolio to a wide range of various clients, markets, regions, and applications. It enhances Timken's currently available market-leading designed bearing solutions.

Scope of the Report

Attribute Details
Estimated Market Size (2023) US$ 353.5 million
Projected Market Valuation (2033) US$ 760.3 million
Value-based CAGR (2023 to 2033) 8.0%
Historical Data 2018 to 2022
Forecast Period 2023 to 2033
Quantitative Units Value (US$ million)
Segments Covered
  • Product Type
  • Diameter
  • Application
  • Region
Regions Covered
  • North America
  • Latin America
  • Europe
  • East Asia
  • Asia and Pacific
  • Middle East & Africa
Key Countries Covered
  • United States
  • Canada
  • Brazil
  • Venezuela
  • Chile
  • Peru
  • Colombia
  • Rest of Latin America
  • Germany
  • United Kingdom
  • Russia
  • Sweden
  • Poland
  • Norway
  • Finland
  • Belgium
  • South Korea
  • India
  • Mongolia
  • Australia
  • South Africa
  • Türkiye
  • Rest of Middle East & Africa
Key Companies Profiled
  • Thyssenkrupp AG
  • AB SKF
  • NTN Corporation
  • Schaeffler AG
  • The Timken Company
  • NSK Ltd.
  • Nachi-Fujikoshi Corp.
  • JTEKT Corp (KOYO Bearing Koyo Seiko Co., Ltd.)
  • Wuxi MBY Bearing Technology Co., Ltd
  • LAULAGUN BEARINGS, S.L.
  • NIPPON THOMPSON CO., LTD. (IKO Bearings)
  • Luoyang LDB
  • TGB Group Technologies
  • Defontaine Group
  • Kaydon Bearings
  • ILJIN POWER CO LTD
  • THK CO., Ltd.
Report Coverage Revenue Forecast, Volume Forecast, Company Ranking, Competitive Landscape, Growth Factors, Trends and Pricing Analysis

Large Scale Bearing Market Outlook by Category

Product Type:

  • Plain Bearing
    • Deep Groove
    • Four Point Contact
  • Roller Bearing
    • Cylindrical
    • Tapered
    • Spherical
  • Slew Bearings
  • Electrically Insulated Bearings

By Diameter:

  • 500 to 1000mm
  • 1000 to 1500mm
  • 1500 to 2000mm
  • 2000 to 2600mm

By Application:

  • Main Bearings
  • Pitch Bearings
  • Generator Bearings
  • Gearbox Bearings
  • Flange Bearing
  • Yaw Bearings

By Region:

  • North America
  • Latin America
  • Western Europe
  • Eastern Europe
  • Central Asia
  • Russia & Belarus
  • Balkan & Baltic Countries
  • East Asia
  • South Asia & Pacific
  • The Middle East & Africa

Frequently Asked Questions

How Big is the Large Scale Bearing Market?

The market is valued at US$ 353.5 million in 2023.

Who are the Key Players of the Large Scale Bearing Market?

NKS Limited, NTN Corporation and TGB Group Technologies are key market players.

Which is the Key Segment by Application Type?

Gearbox bearing segment is likely to remain preferred through 2033.

Which is the Go-to Market Strategy?

Players opt for mergers, product launches and collaborations.

Which are the Key Asian Countries in the Market?

India and China dominate the Asian market.

Table of Content

1. Executive Summary

    1.1. Global Market Outlook

    1.2. Demand Side Trends

    1.3. Supply Side Trends

    1.4. Technology Roadmap

    1.5. Analysis and Recommendations

2. Market Overview

    2.1. Market Coverage / Taxonomy

    2.2. Market Definition / Scope / Limitations

3. Key Market Trends

    3.1. Key Trends Impacting the Market

    3.2. Product Innovation / Development Trends

4. Key Success Factors

    4.1. Product Adoption / Usage Analysis

    4.2. Product USPs / Features

    4.3. Strategic Promotional Strategies

5. Global Market Demand Analysis 2018 to 2022 and Forecast, 2023 to 2033

    5.1. Historical Market Volume (Tons) Analysis, 2018 to 2022

    5.2. Current and Future Market Volume (Tons) Projections, 2023 to 2033

    5.3. Y-o-Y Growth Trend Analysis

6. Global Market - Pricing Analysis

    6.1. Regional Pricing Analysis By Product Type

    6.2. Global Average Pricing Analysis Benchmark

7. Global Market Demand (in Value or Size in US$ million) Analysis 2018 to 2022 and Forecast, 2023 to 2033

    7.1. Historical Market Value (US$ million) Analysis, 2018 to 2022

    7.2. Current and Future Market Value (US$ million) Projections, 2023 to 2033

        7.2.1. Y-o-Y Growth Trend Analysis

        7.2.2. Absolute $ Opportunity Analysis

8. Market Background

    8.1. Macro-Economic Factors

        8.1.1. Global GDP Growth Outlook

        8.1.2. Global Real GDP Growth

        8.1.3. Global Construction Industry Overview

        8.1.4. Global Population & Urbanization Overview

        8.1.5. Global Oil & Gas Industry Outlook

        8.1.6. Global Manufacturing Value Added

    8.2. Forecast Factors - Relevance & Impact

        8.2.1. Top Companies Historical Growth

        8.2.2. GDP Growth

        8.2.3. Urbanization Rate

        8.2.4. Demand from Thermal/ CHP/ Nuclear Power Generation Plants

        8.2.5. Rising Global Wind Energy Installations

        8.2.6. Investments In Product R&D

    8.3. Patent Analysis

    8.4. Value Chain

        8.4.1. List of Manufacturers

        8.4.2. List of Distributors and Traders

        8.4.3. List of Suppliers

    8.5. COVID-19 Crisis – Impact Assessment

        8.5.1. Current Statistics

        8.5.2. Short-Mid-Long Term Outlook

        8.5.3. Likely Rebound

    8.6. Market Dynamics

        8.6.1. Drivers

        8.6.2. Restraints

        8.6.3. Opportunity Analysis

    8.7. PESTEL Analysis

9. Global Market Analysis 2018 to 2022 and Forecast 2023 to 2033, By Product Type

    9.1. Introduction / Key Findings

    9.2. Historical Market Size (US$ million) and Volume Analysis By Product Type, 2018 to 2022

    9.3. Current and Future Market Size (US$ million) and Volume Analysis and Forecast By Product Type, 2023 to 2033

        9.3.1. Plain Bearing

            9.3.1.1. Deep groove

            9.3.1.2. Four-Point Contact

        9.3.2. Roller Bearing

            9.3.2.1. Cylindrical

            9.3.2.2. Tapered

            9.3.2.3. Spherical

        9.3.3. Slew Bearings

        9.3.4. Electrically insulated bearings

    9.4. Market Attractiveness Analysis By Product Type

10. Global Market Analysis 2018 to 2022 and Forecast 2023 to 2033, By Diameter

    10.1. Introduction / Key Findings

    10.2. Historical Market Size (US$ million) and Volume Analysis By Diameter, 2018 to 2022

    10.3. Current and Future Market Size (US$ million) and Volume Analysis and Forecast By Diameter, 2023 to 2033

        10.3.1. 500 to 1000 mm

        10.3.2. 1000 to 1500 mm

        10.3.3. 1500 to 2000 mm

        10.3.4. 2000 to 2600 mm

    10.4. Market Attractiveness Analysis By Diameter

11. Global Market Analysis 2018 to 2022 and Forecast 2023 to 2033, By Application

    11.1. Introduction / Key Findings

    11.2. Historical Market Size (US$ million) and Volume Analysis By Application, 2018 to 2022

    11.3. Current and Future Market Size (US$ million) and Volume Analysis and Forecast By Application, 2023 to 2033

        11.3.1. Main bearings

        11.3.2. Pitch bearings

        11.3.3. Generator bearings

        11.3.4. Gearbox bearings

        11.3.5. Flange Bearings

        11.3.6. Yaw Bearings

    11.4. Market Attractiveness Analysis By Application

12. Global Market Analysis 2018 to 2022 and Forecast 2023 to 2033, by Region

    12.1. Introduction

    12.2. Historical Market Size (US$ million) and Volume Analysis By Region, 2018 to 2022

    12.3. Current Market Size (US$ million) and Volume Analysis and Forecast By Region, 2023 to 2033

        12.3.1. North America

        12.3.2. Latin America

        12.3.3. Western Europe

        12.3.4. Eastern Europe

        12.3.5. Central Asia

        12.3.6. Russia & Belarus

        12.3.7. Balkan & Baltic Countries

        12.3.8. Middle East and Africa (MEA)

        12.3.9. East Asia

        12.3.10. South Asia and Pacific

    12.4. Market Attractiveness Analysis By Region

13. North America Market Analysis 2018 to 2022 and Forecast 2023 to 2033

    13.1. Introduction

    13.2. Pricing Analysis

    13.3. PESTEL Analysis

    13.4. Historical Market Size (US$ million) and Volume Trend Analysis By Market Taxonomy, 2018 to 2022

    13.5. Market Size (US$ million) and Volume Forecast By Market Taxonomy, 2023 to 2033

        13.5.1. By Country

            13.5.1.1. United States

            13.5.1.2. Canada

        13.5.2. By Product Type

        13.5.3. By Diameter

        13.5.4. By Application

    13.6. Market Attractiveness Analysis

        13.6.1. By Country

        13.6.2. By Product Type

        13.6.3. By Diameter

        13.6.4. By Application

14. Latin America Market Analysis 2018 to 2022 and Forecast 2023 to 2033

    14.1. Introduction

    14.2. Pricing Analysis

    14.3. PESTEL Analysis

    14.4. Historical Market Size (US$ million) and Volume Trend Analysis By Market Taxonomy, 2018 to 2022

    14.5. Market Size (US$ million) and Volume Forecast By Market Taxonomy, 2023 to 2033

        14.5.1. By Country

            14.5.1.1. Brazil

            14.5.1.2. Mexico

            14.5.1.3. Argentina

            14.5.1.4. Rest of Latin America

        14.5.2. By Product Type

        14.5.3. By Diameter

        14.5.4. By Application

    14.6. Market Attractiveness Analysis

        14.6.1. By Country

        14.6.2. By Product Type

        14.6.3. By Diameter

        14.6.4. By Application

15. Western Europe Market Analysis 2018 to 2022 and Forecast 2023 to 2033

    15.1. Introduction

    15.2. Pricing Analysis

    15.3. PESTEL Analysis

    15.4. Historical Market Size (US$ million) and Volume Trend Analysis By Market Taxonomy, 2018 to 2022

    15.5. Market Size (US$ million) and Volume Forecast By Market Taxonomy, 2023 to 2033

        15.5.1. By Country

            15.5.1.1. Germany

            15.5.1.2. Italy

            15.5.1.3. France

            15.5.1.4. United Kingdom

            15.5.1.5. Spain

            15.5.1.6. BENELUX

            15.5.1.7. NORDICS

            15.5.1.8. Rest of Western Europe

        15.5.2. By Product Type

        15.5.3. By Diameter

        15.5.4. By Application

    15.6. Market Attractiveness Analysis

        15.6.1. By Application

16. Eastern Europe Market Analysis 2018 to 2022 and Forecast 2023 to 2033

    16.1. Introduction

    16.2. Pricing Analysis

    16.3. PESTEL Analysis

    16.4. Historical Market Size (US$ million) and Volume Trend Analysis By Market Taxonomy, 2018 to 2022

    16.5. Market Size (US$ million) and Volume Forecast By Market Taxonomy, 2023 to 2033

        16.5.1. By Country

            16.5.1.1. Poland

            16.5.1.2. Hungary

            16.5.1.3. Romania

            16.5.1.4. Czech Republic

            16.5.1.5. Rest of Eastern Europe

        16.5.2. By Product Type

        16.5.3. By Diameter

        16.5.4. By Application

    16.6. Market Attractiveness Analysis

        16.6.1. By Country

        16.6.2. By Product Type

        16.6.3. By Diameter

        16.6.4. By Application

17. Central Asia Market Analysis 2018 to 2022 and Forecast 2023 to 2033

    17.1. Introduction

    17.2. Pricing Analysis

    17.3. PESTEL Analysis

    17.4. Historical Market Size (US$ million) and Volume Trend Analysis By Market Taxonomy, 2018 to 2022

    17.5. Market Size (US$ million) and Volume Forecast By Market Taxonomy, 2023 to 2033

        17.5.1. By Product Type

        17.5.2. By Diameter

        17.5.3. By Application

    17.6. Market Attractiveness Analysis

        17.6.1. By Product Type

        17.6.2. By Diameter

        17.6.3. By Application

18. Russia & Belarus Market Analysis 2018 to 2022 and Forecast 2023 to 2033

    18.1. Introduction

    18.2. Pricing Analysis

    18.3. PESTEL Analysis

    18.4. Historical Market Size (US$ million) and Volume Trend Analysis By Market Taxonomy, 2018 to 2022

    18.5. Market Size (US$ million) and Volume Forecast By Market Taxonomy, 2023 to 2033

        18.5.1. By Product Type

        18.5.2. By Diameter

        18.5.3. By Application

    18.6. Market Attractiveness Analysis

        18.6.1. By Product Type

        18.6.2. By Diameter

        18.6.3. By Application

19. Balkan & Baltic Countries Market Analysis 2018 to 2022 and Forecast 2023 to 2033

    19.1. Introduction

    19.2. Pricing Analysis

    19.3. PESTEL Analysis

    19.4. Historical Market Size (US$ million) and Volume Trend Analysis By Market Taxonomy, 2018 to 2022

    19.5. Market Size (US$ million) and Volume Forecast By Market Taxonomy, 2023 to 2033

        19.5.1. By Product Type

        19.5.2. By Diameter

        19.5.3. By Application

    19.6. Market Attractiveness Analysis

        19.6.1. By Product Type

        19.6.2. By Diameter

        19.6.3. By Application

20. South Asia and Pacific Market Analysis 2018 to 2022 and Forecast 2023 to 2033

    20.1. Introduction

    20.2. Pricing Analysis

    20.3. PESTEL Analysis

    20.4. Historical Market Size (US$ million) and Volume Trend Analysis By Market Taxonomy, 2018 to 2022

    20.5. Market Size (US$ million) and Volume Forecast By Market Taxonomy, 2023 to 2033

        20.5.1. By Country

            20.5.1.1. India

            20.5.1.2. ASEAN

            20.5.1.3. Oceania

            20.5.1.4. Rest of South Asia & Pacific

        20.5.2. By Product Type

        20.5.3. By Diameter

        20.5.4. By Application

    20.6. Market Attractiveness Analysis

        20.6.1. By Country

        20.6.2. By Product Type

        20.6.3. By Diameter

        20.6.4. By Application

21. East Asia Market Analysis 2018 to 2022 and Forecast 2023 to 2033

    21.1. Introduction

    21.2. Pricing Analysis

    21.3. PESTEL Analysis

    21.4. Historical Market Size (US$ million) and Volume Trend Analysis By Market Taxonomy, 2018 to 2022

    21.5. Market Size (US$ million) and Volume Forecast By Market Taxonomy, 2023 to 2033

        21.5.1. By Country

            21.5.1.1. China

            21.5.1.2. Japan

            21.5.1.3. South Korea

        21.5.2. By Product Type

        21.5.3. By Diameter

        21.5.4. By Application

    21.6. Market Attractiveness Analysis

        21.6.1. By Country

        21.6.2. By Product Type

        21.6.3. By Diameter

        21.6.4. By Application

22. Middle East and Africa Market Analysis 2018 to 2022 and Forecast 2023 to 2033

    22.1. Introduction

    22.2. Pricing Analysis

    22.3. PESTEL Analysis

    22.4. Historical Market Size (US$ million) and Volume Trend Analysis By Market Taxonomy, 2018 to 2022

    22.5. Market Size (US$ million) and Volume Forecast By Market Taxonomy, 2023 to 2033

        22.5.1. By Country

            22.5.1.1. GCC Countries

            22.5.1.2. Türkiye

            22.5.1.3. Northern Africa

            22.5.1.4. South Africa

            22.5.1.5. Rest of Middle East and Africa

        22.5.2. By Product Type

        22.5.3. By Diameter

        22.5.4. By Application

    22.6. Market Attractiveness Analysis

        22.6.1. By Country

        22.6.2. By Product Type

        22.6.3. By Diameter

        22.6.4. By Application

23. Country-wise Market Analysis

    23.1. Introduction

        23.1.1. Market Value Proportion Analysis, By Key Countries

        23.1.2. Global Vs. Country Growth Comparison

    23.2. United States Market Analysis

        23.2.1. By Product Type

        23.2.2. By Diameter

        23.2.3. By Application

    23.3. Canada Market Analysis

        23.3.1. By Product Type

        23.3.2. By Diameter

        23.3.3. By Application

    23.4. Mexico Market Analysis

        23.4.1. By Product Type

        23.4.2. By Diameter

        23.4.3. By Application

    23.5. Brazil Market Analysis

        23.5.1. By Product Type

        23.5.2. By Diameter

        23.5.3. By Application

    23.6. Argentina Market Analysis

        23.6.1. By Product Type

        23.6.2. By Diameter

        23.6.3. By Application

    23.7. Germany Market Analysis

        23.7.1. By Product Type

        23.7.2. By Diameter

        23.7.3. By Application

    23.8. Italy Market Analysis

        23.8.1. By Product Type

        23.8.2. By Diameter

        23.8.3. By Application

    23.9. France Market Analysis

        23.9.1. By Product Type

        23.9.2. By Diameter

        23.9.3. By Application

    23.10. United Kingdom Market Analysis

        23.10.1. By Product Type

        23.10.2. By Diameter

        23.10.3. By Application

    23.11. Spain Market Analysis

        23.11.1. By Product Type

        23.11.2. By Diameter

        23.11.3. By Application

    23.12. NORDICS Market Analysis

        23.12.1. By Product Type

        23.12.2. By Diameter

        23.12.3. By Application

    23.13. Poland Market Analysis

        23.13.1. By Product Type

        23.13.2. By Diameter

        23.13.3. By Application

    23.14. Hungary Market Analysis

        23.14.1. By Product Type

        23.14.2. By Diameter

        23.14.3. By Application

    23.15. Romania Market Analysis

        23.15.1. By Product Type

        23.15.2. By Diameter

        23.15.3. By Application

    23.16. Czech Republic Market Analysis

        23.16.1. By Product Type

        23.16.2. By Diameter

        23.16.3. By Application

    23.17. China Market Analysis

        23.17.1. By Product Type

        23.17.2. By Diameter

        23.17.3. By Application

    23.18. Japan Market Analysis

        23.18.1. By Product Type

        23.18.2. By Diameter

        23.18.3. By Application

    23.19. S. Korea Market Analysis

        23.19.1. By Product Type

        23.19.2. By Diameter

        23.19.3. By Application

    23.20. India Market Analysis

        23.20.1. By Product Type

        23.20.2. By Diameter

        23.20.3. By Application

    23.21. ASEAN Market Analysis

        23.21.1. By Product Type

        23.21.2. By Diameter

        23.21.3. By Application

    23.22. Australia and New Zealand Market Analysis

        23.22.1. By Product Type

        23.22.2. By Diameter

        23.22.3. By Application

    23.23. KSA Market Analysis

        23.23.1. By Product Type

        23.23.2. By Diameter

        23.23.3. By Application

    23.24. UAE Market Analysis

        23.24.1. By Product Type

        23.24.2. By Diameter

        23.24.3. By Application

    23.25. Northern Africa Market Analysis

        23.25.1. By Product Type

        23.25.2. By Diameter

        23.25.3. By Application

    23.26. Türkiye Market Analysis

        23.26.1. By Product Type

        23.26.2. By Diameter

        23.26.3. By Application

    23.27. South Africa Market Analysis

        23.27.1. By Product Type

        23.27.2. By Diameter

        23.27.3. By Application

    23.28. Israel Market Analysis

        23.28.1. By Product Type

        23.28.2. By Diameter

        23.28.3. By Application

24. Market Structure Analysis

    24.1. Market Analysis by Tier of Companies (Large Scale Bearing)

    24.2. Market Concentration

    24.3. Market Share Analysis of Top Players

    24.4. Production Capacity Analysis

    24.5. Market Presence Analysis

        24.5.1. By Application Footprint of Players

        24.5.2. By Regional Footprint of Players

        24.5.3. By Channel Footprint of Players

25. Competition Analysis

    25.1. Competition Dashboard

    25.2. Competition Benchmarking

    25.3. Competition Deep Dive

        25.3.1. Thyssenkrupp AG

            25.3.1.1. Overview

            25.3.1.2. Product Portfolio

            25.3.1.3. Profitability by Market Segments (Product/Channel/Region)

            25.3.1.4. Sales Footprint

            25.3.1.5. Strategy Overview

        25.3.2. AB SKF

        25.3.3. NTN Corporation

        25.3.4. Schaeffler AG

        25.3.5. The Timken Company

        25.3.6. NSK Ltd.

        25.3.7. Nachi-Fujikoshi Corp.

        25.3.8. JTEKT Corp (KOYO Bearing Koyo Seiko Co., Ltd.)

        25.3.9. Wuxi MBY Bearing Technology Co., Ltd

        25.3.10. LAULAGUN BEARINGS, S.L.

        25.3.11. NIPPON THOMPSON CO., LTD. (IKO Bearings)

        25.3.12. Luoyang LDB

        25.3.13. TGB Group Technologies

        25.3.14. Defontaine Group

        25.3.15. Kaydon Bearings

        25.3.16. ILJIN POWER CO LTD

        25.3.17. THK CO., Ltd.

26. Assumptions and Acronyms Used

27. Research Methodology

List of Tables

Table 01: Global Market Value (US$ million) and Volume (Units) Historical Data 2018 to 2022 and Forecast 2023 to 2033 By Product Type

Table 02: Global Market Value (US$ million) and Volume (Units) Historical Data 2018 to 2022 and Forecast 2023 to 2033 By Diameter

Table 03: Global Market Value (US$ million) and Volume (Units) Historical Data 2018 to 2022 and Forecast 2023 to 2033 By Application

Table 04: Global Market Value (US$ million) and Volume (Units) Historical Data 2018 to 2022 and Forecast 2023 to 2033 By Regions

Table 05: North America Market Value (US$ million) and Volume (Units) Historical Data 2018 to 2022 and Forecast 2023 to 2033 By Country

Table 06: North America Market Value (US$ million) and Volume (Units) Historical Data 2018 to 2022 and Forecast 2023 to 2033 By Product Type

Table 07: North America Market Value (US$ million) and Volume (Units) Historical Data 2018 to 2022 and Forecast 2023 to 2033 By Diameter

Table 08: North America Market Value (US$ million) and Volume (Units) Historical Data 2018 to 2022 and Forecast 2023 to 2033 By Application

Table 09: Latin America Market Value (US$ million) and Volume (Units) Historical Data 2018 to 2022 and Forecast 2023 to 2033 By Country

Table 10: Latin America Market Value (US$ million) and Volume (Units) Historical Data 2018 to 2022 and Forecast 2023 to 2033 By Product Type

Table 11: Latin America Market Value (US$ million) and Volume (Units) Historical Data 2018 to 2022 and Forecast 2023 to 2033 By Diameter

Table 12: Latin America Market Value (US$ million) and Volume (Units) Historical Data 2018 to 2022 and Forecast 2023 to 2033 By Application

Table 13: Western Europe Market Value (US$ million) and Volume (Units) Historical Data 2018 to 2022 and Forecast 2023 to 2033 By Country

Table 14: Western Europe Market Value (US$ million) and Volume (Units) Historical Data 2018 to 2022 and Forecast 2023 to 2033 By Product Type

Table 15: Western Europe Market Value (US$ million) and Volume (Units) Historical Data 2018 to 2022 and Forecast 2023 to 2033 By Diameter

Table 16: Western Europe Market Value (US$ million) and Volume (Units) Historical Data 2018 to 2022 and Forecast 2023 to 2033 By Application

Table 17: Eastern Europe Market Value (US$ million) and Volume (Units) Historical Data 2018 to 2022 and Forecast 2023 to 2033 By Country

Table 18: Eastern Europe Market Value (US$ million) and Volume (Units) Historical Data 2018 to 2022 and Forecast 2023 to 2033 By Product Type

Table 19: Eastern Europe Market Value (US$ million) and Volume (Units) Historical Data 2018 to 2022 and Forecast 2023 to 2033 By Diameter

Table 20: Eastern Europe Market Value (US$ million) and Volume (Units) Historical Data 2018 to 2022 and Forecast 2023 to 2033 By Application

Table 21: East Asia Market Value (US$ million) and Volume (Units) Historical Data 2018 to 2022 and Forecast 2023 to 2033 by Country

Table 22: East Asia Market Value (US$ million) and Volume (Units) Historical Data 2018 to 2022 and Forecast 2023 to 2033 By Product Type

Table 23: East Asia Market Value (US$ million) and Volume (Units) Historical Data 2018 to 2022 and Forecast 2023 to 2033 By Diameter

Table 24: East Asia Market Value (US$ million) and Volume (Units) Historical Data 2018 to 2022 and Forecast 2023 to 2033 By Application

Table 25: South Asia & Pacific Market Value (US$ million) and Volume (Units) Historical Data 2018 to 2022 and Forecast 2023 to 2033 By Country

Table 26: South Asia & Pacific Market Value (US$ million) and Volume (Units) Historical Data 2018 to 2022 and Forecast 2023 to 2033 By Product Type

Table 27: South Asia & Pacific Market Value (US$ million) and Volume (Units) Historical Data 2018 to 2022 and Forecast 2023 to 2033 By Diameter

Table 28: South Asia & Pacific Market Value (US$ million) and Volume (Units) Historical Data 2018 to 2022 and Forecast 2023 to 2033 By Application

Table 29: Central Asia Market Value (US$ million) and Volume (Units) Historical Data 2018 to 2022 and Forecast 2023 to 2033 By Product Type

Table 30: Central Asia Market Value (US$ million) and Volume (Units) Historical Data 2018 to 2022 and Forecast 2023 to 2033 By Diameter

Table 31: Central Asia Market Value (US$ million) and Volume (Units) Historical Data 2018 to 2022 and Forecast 2023 to 2033 By Application

Table 32: Russia & Belarus Market Value (US$ million) and Volume (Units) Historical Data 2018 to 2022 and Forecast 2023 to 2033 By Product Type

Table 33: Russia & Belarus Market Value (US$ million) and Volume (Units) Historical Data 2018 to 2022 and Forecast 2023 to 2033 By Diameter

Table 34: Russia & Belarus Market Value (US$ million) and Volume (Units) Historical Data 2018 to 2022 and Forecast 2023 to 2033 By Application

Table 35: Balkan & Baltic Market Value (US$ million) and Volume (Units) Historical Data 2018 to 2022 and Forecast 2023 to 2033 By Product Type

Table 36: Balkan & Baltic Market Value (US$ million) and Volume (Units) Historical Data 2018 to 2022 and Forecast 2023 to 2033 By Diameter

Table 37: Balkan & Baltic Market Value (US$ million) and Volume (Units) Historical Data 2018 to 2022 and Forecast 2023 to 2033 By Application

Table 38: Middle East & Africa Market Value (US$ million) and Volume (Units) Historical Data 2018 to 2022 and Forecast 2023 to 2033 By Country

Table 39: Middle East & Africa Market Value (US$ million) and Volume (Units) Historical Data 2018 to 2022 and Forecast 2023 to 2033 By Product Type

Table 40: Middle East & Africa Market Value (US$ million) and Volume (Units) Historical Data 2018 to 2022 and Forecast 2023 to 2033 By Diameter

Table 41: Middle East & Africa Market Value (US$ million) and Volume (Units) Historical Data 2018 to 2022 and Forecast 2023 to 2033 By Application

List of Charts

Figure 01: Global Market Historical Volume (Units), 2018 to 2022

Figure 02: Global Market Current and Forecast Volume ), 2023 to 2033

Figure 03: Global Historical Market Size (USD million) (2018 to 2022)

Figure 04: Global Market Absolute $ Opportunity Analysis (2018 to 2033)

Figure 05: Global Market Size (USD million) & YOY Growth (%) (2023 to 2033)

Figure 06: Global Market Share and BPS Analysis by Product Type – 2023 & 2033

Figure 07: Global Market Y-o-Y Growth Projections by Product Type, 2023 to 2033

Figure 08: Global Market Attractiveness by Product Type, 2023 to 2033

Figure 09: Global Market Absolute $ Opportunity, 2023 to 2033, by Plain Bearing

Figure 10: Global Market Absolute $ Opportunity, 2023 to 2033, by Roller Bearing

Figure 11: Global Market Absolute $ Opportunity, 2023 to 2033, by Slew Bearing

Figure 12: Global Market Absolute $ Opportunity, 2023 to 2033, by Electrically Insulated Bearing

Figure 13: Global Market Share and BPS Analysis by Diameter – 2023 & 2033

Figure 14: Global Market Y-o-Y Growth Projections by Diameter, 2023 to 2033

Figure 15: Global Market Attractiveness by Diameter, 2023 to 2033

Figure 16: Global Market Absolute $ Opportunity, 2023 to 2033, by 500 to 1000 mm

Figure 17: Global Market Absolute $ Opportunity, 2023 to 2033, by 1000 to 1500 mm

Figure 18: Global Market Absolute $ Opportunity, 2023 to 2033, by 1500 to 2000 mm

Figure 19: Global Market Absolute $ Opportunity, 2023 to 2033, by 2000 to 2600 mm

Figure 20: Global Market Share and BPS Analysis By Application– 2023 & 2033

Figure 21: Global Market Y-o-Y Growth Projections By Application, 2023 to 2033

Figure 22: Global Market Attractiveness By Application, 2023 to 2033

Figure 23: Global Market Absolute $ Opportunity, 2023 to 2033, by Main Bearing

Figure 24: Global Market Absolute $ Opportunity, 2023 to 2033, by Pitch Bearing

Figure 25: Global Market Absolute $ Opportunity, 2023 to 2033, by Generator Bearing

Figure 26: Global Market Absolute $ Opportunity, 2023 to 2033, by Gearbox Bearing

Figure 27: Global Market Absolute $ Opportunity, 2023 to 2033, by Flange Bearing

Figure 28: Global Market Absolute $ Opportunity, 2023 to 2033, by Yaw Bearing

Figure 29: Global Market Share and BPS Analysis by Regions – 2023 & 2033

Figure 30: Global Market Y-o-Y Growth Projections by Regions, 2023 to 2033

Figure 31: Global Market Attractiveness by Regions, 2023 to 2033

Figure 32: Global Market Absolute $ Opportunity 2023 to 2033, by North America

Figure 33: Global Market Absolute $ Opportunity 2023 to 2033, by Latin America

Figure 34: Global Market Absolute $ Opportunity 2023 to 2033, by East Asia

Figure 35: Global Market Absolute $ Opportunity 2023 to 2033, by South Asia & Pacific

Figure 36: Global Market Absolute $ Opportunity 2023 to 2033, by Western Europe

Figure 37: Global Market Absolute $ Opportunity 2023 to 2033, by Eastern Europe

Figure 38: Global Market Absolute $ Opportunity 2023 to 2033, by Central Asia

Figure 39: Global Market Absolute $ Opportunity 2023 to 2033, by Russia & Belarus

Figure 40: Global Market Absolute $ Opportunity 2023 to 2033, by Balkan & Baltic Countries

Figure 41: Global Market Absolute $ Opportunity 2023 to 2033, by Middle East & Africa

Figure 42: North America Market Share and BPS Analysis by Country – 2023 & 2033

Figure 43: North America Market Y-o-Y Growth Projections by Country, 2023 to 2033

Figure 44: North America Market Attractiveness by Country, 2023 to 2033

Figure 45: United States Market Absolute $ Opportunity, 2023 to 2033, by United States

Figure 46: Canada Market Absolute $ Opportunity, 2023 to 2033, by Canada

Figure 47: North America Market Share and BPS Analysis by Product Type – 2023 & 2033

Figure 48: North America Market Y-o-Y Growth Projections by Product Type, 2023 to 2033

Figure 49: North America Market Attractiveness by Product Type, 2023 to 2033

Figure 50: North America Market Share and BPS Analysis by Diameter – 2023 & 2033

Figure 51: North America Market Y-o-Y Growth Projections by Diameter, 2023 to 2033

Figure 52: North America Market Attractiveness by Diameter, 2023 to 2033

Figure 53: North America Market Share and BPS Analysis By Application– 2023 & 2033

Figure 54: North America Market Y-o-Y Growth Projections By Application, 2023 to 2033

Figure 55: North America Market Attractiveness By Application, 2023 to 2033

Figure 56: Latin America Market Share and BPS Analysis by Country – 2023 & 2033

Figure 57: Latin America Market Y-o-Y Growth Projections by Country, 2023 to 2033

Figure 58: Latin America Market Attractiveness by Country, 2023 to 2033

Figure 59: Latin America Market Absolute $ Opportunity 2023 to 2033, by Brazil

Figure 60: Latin America Market Absolute $ Opportunity 2023 to 2033, by Mexico

Figure 61: Latin America Market Absolute $ Opportunity 2023 to 2033, by Argentina

Figure 62: Latin America Market Absolute $ Opportunity 2023 to 2033, by Rest of Western Europe

Figure 63: Latin America Market Share and BPS Analysis by Product Type – 2023 & 2033

Figure 64: Latin America Market Y-o-Y Growth Projections by Product Type, 2023 to 2033

Figure 65: Latin America Market Attractiveness by Product Type, 2023 to 2033

Figure 66: Latin America Market Share and BPS Analysis by Diameter – 2023 & 2033

Figure 67: Latin America Market Y-o-Y Growth Projections by Diameter, 2023 to 2033

Figure 68: Latin America Market Attractiveness by Diameter, 2023 to 2033

Figure 69: Latin America Market Share and BPS Analysis By Application– 2023 & 2033

Figure 70: Latin America Market Y-o-Y Growth Projections By Application, 2023 to 2033

Figure 71: Latin America Market Attractiveness By Application, 2023 to 2033

Figure 72: East Asia Market Share and BPS Analysis by Country – 2023 & 2033

Figure 73: East Asia Market Y-o-Y Growth Projections by Country, 2023 to 2033

Figure 74: East Asia Market Attractiveness by Country, 2023 to 2033

Figure 75: East Asia Market Absolute $ Opportunity 2023 to 2033, by China

Figure 76: East Asia Market Absolute $ Opportunity 2023 to 2033, by Japan

Figure 77: East Asia Market Absolute $ Opportunity 2023 to 2033, by Rest of South Korea

Figure 78: East Asia Market Share and BPS Analysis by Product Type – 2023 & 2033

Figure 79: East Asia Market Y-o-Y Growth Projections by Product Type, 2023 to 2033

Figure 80: East Asia Market Attractiveness by Product Type, 2023 to 2033

Figure 81: East Asia Market Share and BPS Analysis by Diameter – 2023 & 2033

Figure 82: East Asia Market Y-o-Y Growth Projections by Diameter, 2023 to 2033

Figure 83: East Asia Market Attractiveness by Diameter, 2023 to 2033

Figure 84: East Asia Market Share and BPS Analysis By Application– 2023 & 2033

Figure 85: East Asia Market Y-o-Y Growth Projections By Application, 2023 to 2033

Figure 86: East Asia Market Attractiveness By Application, 2023 to 2033

Figure 87: South Asia & Pacific Market Share and BPS Analysis by Country – 2023 & 2033

Figure 88: South Asia & Pacific Market Y-o-Y Growth Projections by Country, 2023 to 2033

Figure 89: South Asia & Pacific Market Attractiveness by Country, 2023 to 2033

Figure 90: South Asia & Pacific Market Absolute $ Opportunity 2023 to 2033, by India

Figure 91: South Asia & Pacific Market Absolute $ Opportunity 2023 to 2033, by ASEAN

Figure 92: South Asia & Pacific Market Absolute $ Opportunity 2023 to 2033, by Australia & New Zealand

Figure 93: South Asia & Pacific Market Absolute $ Opportunity 2023 to 2033, by Rest of South Asia & Pacific

Figure 94: South Asia & Pacific Market Share and BPS Analysis by Product Type – 2023 & 2033

Figure 95: South Asia & Pacific Market Y-o-Y Growth Projections by Product Type, 2023 to 2033

Figure 96: South Asia & Pacific Market Attractiveness by Product Type, 2023 to 2033

Figure 97: South Asia & Pacific Market Share and BPS Analysis by Diameter – 2023 & 2033

Figure 98: South Asia & Pacific Market Y-o-Y Growth Projections by Diameter, 2023 to 2033

Figure 99: South Asia & Pacific Market Attractiveness by Diameter, 2023 to 2033

Figure 100: South Asia & Pacific Market Share and BPS Analysis By Application– 2023 & 2033

Figure 101: South Asia & Pacific Market Y-o-Y Growth Projections By Application, 2023 to 2033

Figure 102: South Asia & Pacific Market Attractiveness By Application, 2023 to 2033

Figure 103: Western Europe Market Share and BPS Analysis by Country – 2023 & 2033

Figure 104: Western Europe Market Y-o-Y Growth Projections by Country, 2023 to 2033

Figure 105: Western Europe Market Attractiveness by Country, 2023 to 2033

Figure 106: Western Europe Market Absolute $ Opportunity 2023 to 2033, by Germany

Figure 107: Western Europe Market Absolute $ Opportunity 2023 to 2033, by Italy

Figure 108: Western Europe Market Absolute $ Opportunity 2023 to 2033, by France

Figure 109: Western Europe Market Absolute $ Opportunity 2023 to 2033, by United Kingdom

Figure 110: Western Europe Market Absolute $ Opportunity 2023 to 2033, by Spain

Figure 111: Western Europe Market Absolute $ Opportunity 2023 to 2033, by Benelux

Figure 112: Western Europe Market Absolute $ Opportunity 2023 to 2033, by Nordics

Figure 113: Western Europe Market Absolute $ Opportunity 2023 to 2033, by Rest of Western Europe

Figure 114: Western Europe Market Share and BPS Analysis by Product Type – 2023 & 2033

Figure 115: Western Europe Market Y-o-Y Growth Projections by Product Type, 2023 to 2033

Figure 116: Western Europe Market Attractiveness by Product Type, 2023 to 2033

Figure 117: Western Europe Market Share and BPS Analysis by Diameter – 2023 & 2033

Figure 118: Western Europe Market Y-o-Y Growth Projections by Diameter, 2023 to 2033

Figure 119: Western Europe Market Attractiveness by Diameter, 2023 to 2033

Figure 120: Western Europe Market Share and BPS Analysis By Application– 2023 & 2033

Figure 121: Western Europe Market Y-o-Y Growth Projections By Application, 2023 to 2033

Figure 122: Western Europe Market Attractiveness By Application, 2023 to 2033

Figure 123: Eastern Europe Market Share and BPS Analysis by Country, 2023 & 2033

Figure 124: Eastern Europe Market Y-o-Y Growth Projections by Country, 2023 to 2033

Figure 125: Eastern Europe Market Attractiveness by Country, 2023 to 2033

Figure 126: Eastern Europe Market Absolute $ Opportunity 2023 to 2033, by Poland

Figure 127: Eastern Europe Market Absolute $ Opportunity 2023 to 2033, by Hungary

Figure 128: Eastern Europe Market Absolute $ Opportunity 2023 to 2033, by Romania

Figure 129: Eastern Europe Market Absolute $ Opportunity 2023 to 2033, by Czech Republic

Figure 130: Eastern Europe Market Absolute $ Opportunity 2023 to 2033, by Rest of Eastern Europe

Figure 131: Eastern Europe Market Share and BPS Analysis by Product Type – 2023 & 2033

Figure 132: Eastern Europe Market Y-o-Y Growth Projections by Product Type, 2023 to 2033

Figure 133: Eastern Europe Market Attractiveness by Product Type, 2023 to 2033

Figure 134: Eastern Europe Market Share and BPS Analysis by Diameter – 2023 & 2033

Figure 135: Eastern Europe Market Y-o-Y Growth Projections by Diameter, 2023 to 2033

Figure 136: Eastern Europe Market Attractiveness by Diameter, 2023 to 2033

Figure 137: Eastern Europe Market Share and BPS Analysis By Application– 2023 & 2033

Figure 138: Eastern Europe Market Y-o-Y Growth Projections By Application, 2023 to 2033

Figure 139: Eastern Europe Market Attractiveness By Application, 2023 to 2033

Figure 140: Central Asia Market Share and BPS Analysis by Product Type – 2023 & 2033

Figure 141: Central Asia Market Y-o-Y Growth Projections by Product Type, 2023 to 2033

Figure 142: Central Asia Market Attractiveness by Product Type, 2023 to 2033

Figure 143: Central Asia Market Share and BPS Analysis by Diameter – 2023 & 2033

Figure 144: Central Asia Market Y-o-Y Growth Projections by Diameter, 2023 to 2033

Figure 145: Central Asia Market Attractiveness by Diameter, 2023 to 2033

Figure 146: Central Asia Market Share and BPS Analysis By Application– 2023 & 2033

Figure 147: Central Asia Market Y-o-Y Growth Projections By Application, 2023 to 2033

Figure 148: Central Asia Market Attractiveness By Application, 2023 to 2033

Figure 149: Russia & Belarus Market Share and BPS Analysis by Product Type – 2023 & 2033

Figure 150: Russia & Belarus Market Y-o-Y Growth Projections by Product Type, 2023 to 2033

Figure 151: Russia & Belarus Market Attractiveness by Product Type, 2023 to 2033

Figure 152: Russia & Belarus Market Share and BPS Analysis by Diameter – 2023 & 2033

Figure 153: Russia & Belarus Market Y-o-Y Growth Projections by Diameter, 2023 to 2033

Figure 154: Russia & Belarus Market Attractiveness by Diameter, 2023 to 2033

Figure 155: Russia & Belarus Market Share and BPS Analysis By Application– 2023 & 2033

Figure 156: Russia & Belarus Market Y-o-Y Growth Projections By Application, 2023 to 2033

Figure 157: Russia & Belarus Market Attractiveness By Application, 2023 to 2033

Figure 158: Balkan & Baltic Market Share and BPS Analysis by Product Type – 2023 & 2033

Figure 159: Balkan & Baltic Market Y-o-Y Growth Projections by Product Type, 2023 to 2033

Figure 160: Balkan & Baltic Market Attractiveness by Product Type, 2023 to 2033

Figure 161: Balkan & Baltic Market Share and BPS Analysis by Diameter – 2023 & 2033

Figure 162: Balkan & Baltic Market Y-o-Y Growth Projections by Diameter, 2023 to 2033

Figure 163: Balkan & Baltic Market Attractiveness by Diameter, 2023 to 2033

Figure 164: Balkan & Baltic Market Share and BPS Analysis By Application– 2023 & 2033

Figure 165: Balkan & Baltic Market Y-o-Y Growth Projections By Application, 2023 to 2033

Figure 166: Balkan & Baltic Market Attractiveness By Application, 2023 to 2033

Figure 167: Middle East & Africa Market Share and BPS Analysis by Country– 2023 & 2033

Figure 168: Middle East & Africa Market Y-o-Y Growth Projections by Country, 2023 to 2033

Figure 169: Middle East & Africa Market Attractiveness by Country, 2023 to 2033

Figure 170: Middle East & Africa Market Absolute $ Opportunity 2023 to 2033, by KSA

Figure 171: Middle East & Africa Market Absolute $ Opportunity 2023 to 2033, by UAE

Figure 172: Middle East & Africa Market Absolute $ Opportunity 2023 to 2033, by Türkiye

Figure 173: Middle East & Africa Market Absolute $ Opportunity 2023 to 2033, by Northern Africa

Figure 174: Middle East & Africa Market Absolute $ Opportunity 2023 to 2033, by South Africa

Figure 175: Middle East & Africa Market Absolute $ Opportunity 2023 to 2033, by Israel

Figure 176: Middle East & Africa Market Absolute $ Opportunity 2023 to 2033, by Rest of MEA

Figure 177: Middle East & Africa Market Share and BPS Analysis by Product Type – 2023 & 2033

Figure 178: Middle East & Africa Market Y-o-Y Growth Projections by Product Type, 2023 to 2033

Figure 179: Middle East & Africa Market Attractiveness by Product Type, 2023 to 2033

Figure 180: Middle East & Africa Market Share and BPS Analysis by Diameter – 2023 & 2033

Figure 181: Middle East & Africa Market Y-o-Y Growth Projections by Diameter, 2023 to 2033

Figure 182: Middle East & Africa Market Attractiveness by Diameter, 2023 to 2033

Figure 183: Middle East & Africa Market Share and BPS Analysis By Application– 2023 & 2033

Figure 184: Middle East & Africa Market Y-o-Y Growth Projections By Application, 2023 to 2033

Figure 185: Middle East & Africa Market Attractiveness By Application, 2023 to 2033 

Recommendations

Industrial Automation

Bridge Bearing Market

Published : April 2024

Industrial Automation

Marine Bearings Market

Published : June 2022

Explore Industrial Automation Insights

View Reports

Large Scale Bearing Market