Descaler Market
Market Insights on Descaler covering sales outlook, demand forecast & up-to-date key trends
Descaler Market by Application, Format, End Use, Packaging, Sales Channel & Region - Forecast 2022 – 2032
Descaler Market Snapshot (2022-2032)
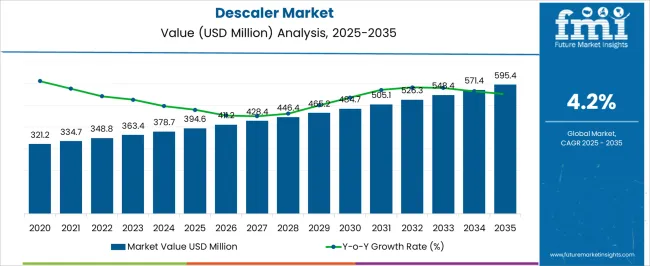
[302 Pages Report] Sales of descalers are expected to reach US$ 490 Million in 2032, against US$ 348 Million in 2021. The anticipated CAGR is 3.1% during the forecast period from 2022 to 2032. Growing demand to remove stains, lime scale, cement, concrete, and hard-food build-up in kitchen utensils is expected to play a key role in strengthening the market during the forecast period.
Report Attribute |
Details |
Projected Base Year Value (2021) |
US$ 348 Million |
Estimated Market Value (2022) |
US$ 360.11 Million |
Anticipated Forecast Value (2032) |
US$ 490 Million |
Expected Growth Rate (2022-2032) |
3.1% |
Increasing installation of coffee machines at commercial sites such as; malls, offices, and others, is expected to propel the descaler market growth in the forthcoming period. The importance of maintaining machinery and other devices is anticipated to provide a significant boost to the demand for descalers in the forecast period. Another significant factor boosting the descaler market is the expansion of refineries, the food and beverage industry, and the energy and power industries.
The electronic water scale removal system is gaining traction across the globe. Various entities are manufacturing technologically advanced electronic scale removal systems. The magnetic water scale removal system is one of the innovative methods that uses magnets to create a magnetic field in the water that impacts the way the hardness ions act.
Let us know your requirement to get
100% FREE customization
What are the Major Drivers Spearheading Descaler Market Growth?
The rapid industrialization in developing countries is anticipated to play a significant growth in strengthening the market during the forecast period. Developing economies are the focus of various developed nations to establish their business through FDI incentive schemes. Emerging economies such as; India, China, Japan, Brazil, and Indonesia have experienced significant growth in the manufacturing and service sector. Rapid industrialization is expected to boost market growth by enhancing demand for descalers.
The launch of innovative products in developing countries is expected to widen the market size during the forecast period. For instance, in May 2022, Carysil, an Indian company, collaborated with Vaani Kapoor, an Indian actress, to launch a one-of-a-kind coffee maker with the new built-in innovative features to provide an indulging coffee experience for caffeine lovers. The coffee maker contains a smart automatic self-maintenance system with in-built cleaning and descaling indicator. Such initiatives are expected to boost the market growth during the forecast period.
Other salient factors increasing the demand for descalers are growing skin problems due to hard water, dry scalp, dry skin, and others. Also, the presence of high levels of calcium and magnesium can impact human health severely. Thus, owing to the aforementioned factors, the market is projected to expand significantly in the forthcoming period.
What are the Factors Hampering Descaler Demand?
Changes in consumer preference for eco-friendly products are expected to play a significant role in hampering the market during the forecast period. Bio-based products have lesser chemicals and are made from natural ingredients, they reduce the scope of side effects. Also, the descaling solution can be harmful to human health as it can result in irritation in the respiratory tract and cause nausea, vomiting, and other problems related to ingestion.
The availability of alternative technologies installed in commercial, residential, and commercial sites is anticipated to be another factor limiting the market growth. Moreover, lack of awareness about the damages caused due to water scaling in underdeveloped and developing nations is projected to be another cause hampering the market during the assessment period.
Find your sweet spots for generating winning opportunities in this market.
Talk to AnalystWhy is APAC Emerging as an Opportunistic Market for Descalers?
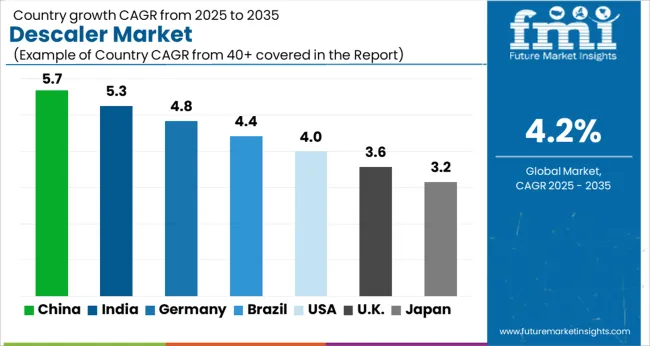
According to the analysis, the APAC region is anticipated to witness maximum opportunities in the descaler market during the forecast period. The growth of the region can be attributed to the rapid industrialization and increasing demand for modern residential water treatment systems. Developing nations such as India, China, Japan, Indonesia, and others have been identified as the most crucial contributors to market growth.
Growing initiatives of players in emerging economies are expected to augment the APAC market size. For instance, in August 2020, India-based Pon Pure Chemicals Group entered the retail segment by rolling out green chemistry and eco-friendly products under its flagship brand, Vooki. Vooki has a portfolio of more than 30 products such as Descaler, dish wash, liquid soap, and others. Owing to the aforementioned factors, the market in APAC is expected to flourish considerably in the forecast period.
What is the status of Descalers Market in North America and Europe?
As per the analysis, North America is projected to dominate the market during the forecast period. The growth of the market can be attributed to the launch of eco-friendly products and the implementation of stringent government rules regarding water treatment. The U.S is expected to dominate the market during the forecast period.
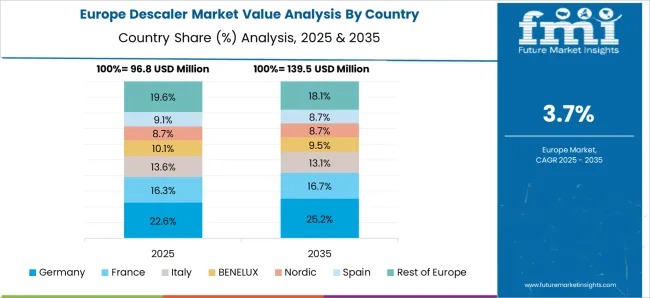
Europe is expected to witness decent market growth during the forecast period. Owing to the government standards for wastewater treatment, the industry is projected to experience significant expansion in the forecast period. The U.K is expected to lead the region as the U.K is a pioneer in the treatment of wastewater. As per the U.K government records, there are about 10,814 sewage treatment works and community septic tanks in Northern Ireland and Scotland. Owing to such factors, the market in Europe is expected to experience notable development in the forthcoming time.

An unified Market Research Subscription Platform, built for today’s disparate research needs.
Market Competition
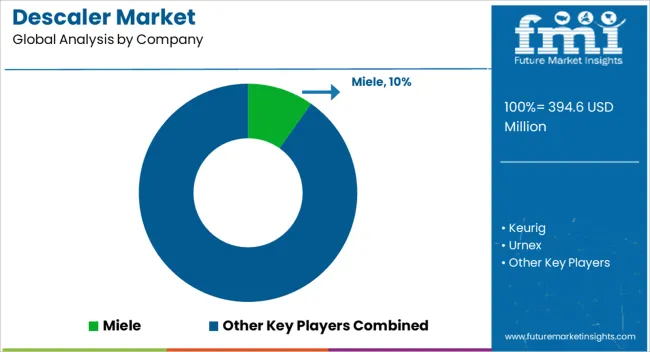
Key players in the global descaler market include Miele, Keurig, Urnex, OXO, Nespresso, Kao, S.C Johnson & Son, Lion, Blue Moon, Pure Water Filters, Saeco, Nafine, Brodys, and Prochem.
In July 2021, Keurig launched a new BrewID smart coffee maker technology. IT connects to your smartphone for extra strength, temperature, size, and auto-brew controls. Such product launches are expected to boost demand for descaler, thus, augmenting the market size in the forecast period.
Report Scope
Report Attribute |
Details |
Growth Rate |
3.1% CAGR from 2022 to 2032 |
Market Value in 2022 |
US$ 360.11 Million |
Market Value in 2032 |
US$ 490 Million |
Base Year for Estimation |
2021 |
Historical Data |
2017-2021 |
Forecast Period |
2022-2032 |
Quantitative Units |
USD Million for Value |
Report Coverage |
Revenue Forecast, Volume Forecast, Company Ranking, Competitive Landscape, Growth Factors, Trends, and Pricing Analysis |
Segments Covered |
|
Regions Covered |
|
Key Countries Profiled |
|
Key Companies Profiled |
|
Customization Scope |
Available upon Request |
Key Segments Profiles in the Global Descaler Market
Descaler Market by Application:
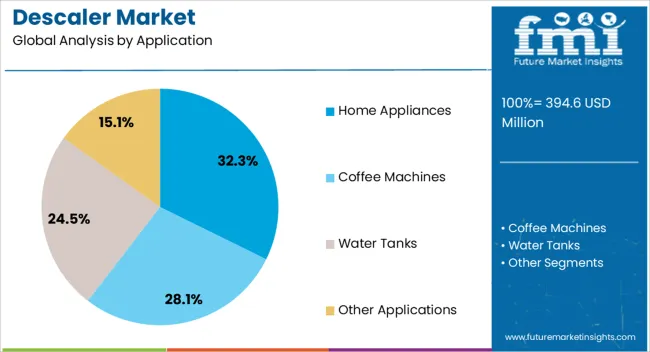
- Descaler in Home Appliances
- Descaler in Coffee Machines
- Descaler in Water Tanks
- Descaler in Other Applications
Descaler Market by Format:
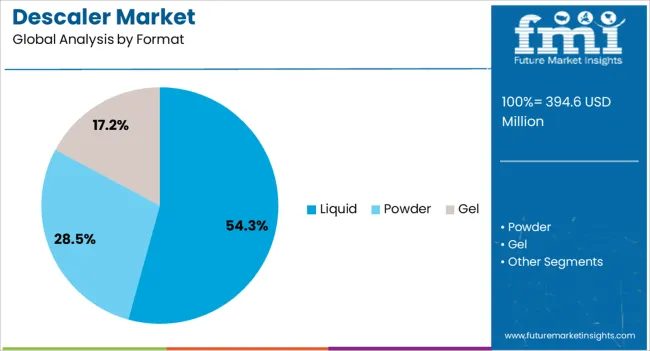
- Descaler Liquid
- Descaler Powder
- Descaler Gel
Descaler Market by End Use:
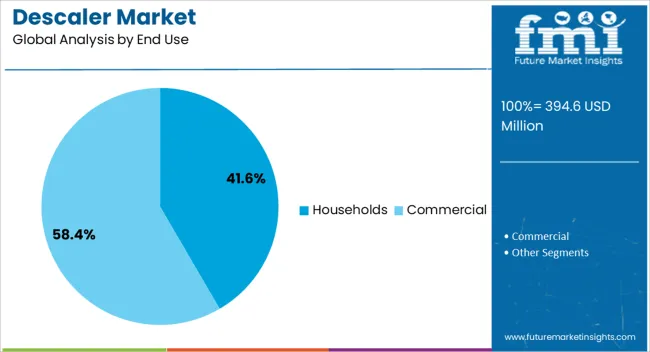
- Descaler in Households
- Descaler in Commercial
Descaler Market by Packaging:
- Descaler Bottles
- Descaler Tubes
- Descaler Pumps
Descaler Market by Sales Channel:
- Descaler Sales via Wholesaler/ Distributers
- Descaler Sales via Hypermarket/Supermarkets
- Descaler Sales via Specialty Stores
- Descaler Sales through Online Stores
Descaler Market by Region:
- North America Descaler Market
- Latin America Descaler Market
- Europe Descaler Market
- East Asia Descaler Market
- South Asia Descaler Market
- Oceania Descaler Market
- Middle East & Africa Descaler Market
Frequently Asked Questions
The global descaler market is expected to grow at a CAGR of 3.1% from 2022 to 2032
APAC is projected to be the most lucrative market for descalers across the forecast period
Kao, S.C Johnson & Son, Lion, Blue Moon, and Brodys are some of the known manufacturers of descalers
1. Executive Summary
1.1. Global Market Outlook
1.2. Demand-side Trends
1.3. Supply-side Trends
1.4. Technology Roadmap Analysis
1.5. Analysis and Recommendations
2. Market Overview
2.1. Market Coverage / Taxonomy
2.2. Market Definition / Scope / Limitations
3. Market Background
3.1. Market Dynamics
3.1.1. Drivers
3.1.2. Restraints
3.1.3. Opportunity
3.1.4. Trends
3.2. Scenario Forecast
3.2.1. Demand in Optimistic Scenario
3.2.2. Demand in Likely Scenario
3.2.3. Demand in Conservative Scenario
3.3. Opportunity Map Analysis
3.4. Investment Feasibility Matrix
3.5. PESTLE and Porter’s Analysis
3.6. Regulatory Landscape
3.6.1. By Key Regions
3.6.2. By Key Countries
4. Global Descaler Market Analysis 2017-2021 and Forecast, 2022-2032
4.1. Historical Market Size Value (US$ Mn) & Volume (Mn Units) Analysis, 2017-2021
4.2. Current and Future Market Size Value (US$ Mn) & Volume (Mn Units) Projections, 2022-2032
4.2.1. Y-o-Y Growth Trend Analysis
4.2.2. Absolute $ Opportunity Analysis
5. Global Descaler Market Analysis 2017-2021 and Forecast 2022-2032, By Application
5.1. Introduction / Key Findings
5.2. Historical Market Size Value (US$ Mn) & Volume (Mn Units) Analysis By Application, 2017-2021
5.3. Current and Future Market Size Value (US$ Mn) & Volume (Mn Units) Analysis and Forecast By Application, 2022-2032
5.3.1. Home appliances
5.3.2. Coffee machines
5.3.3. Water tanks
5.3.4. Others
5.4. Y-o-Y Growth Trend Analysis By Application, 2017-2021
5.5. Absolute $ Opportunity Analysis By Application, 2022-2032
6. Global Descaler Market Analysis 2017-2021 and Forecast 2022-2032, By By Format
6.1. Introduction / Key Findings
6.2. Historical Market Size Value (US$ Mn) & Volume (Mn Units) Analysis By By Format , 2017-2021
6.3. Current and Future Market Size Value (US$ Mn) & Volume (Mn Units) Analysis and Forecast By By Format , 2022-2032
6.3.1. Powder
6.3.2. Liquid
6.3.3. Gel
6.4. Y-o-Y Growth Trend Analysis By By Format , 2017-2021
6.5. Absolute $ Opportunity Analysis By By Format , 2022-2032
7. Global Descaler Market Analysis 2017-2021 and Forecast 2022-2032, By End Use
7.1. Introduction / Key Findings
7.2. Historical Market Size Value (US$ Mn) & Volume (Mn Units) Analysis By End Use, 2017-2021
7.3. Current and Future Market Size Value (US$ Mn) & Volume (Mn Units) Analysis and Forecast By End Use, 2022-2032
7.3.1. Households
7.3.2. Commerical
7.4. Y-o-Y Growth Trend Analysis By End Use, 2017-2021
7.5. Absolute $ Opportunity Analysis By End Use, 2022-2032
8. Global Descaler Market Analysis 2017-2021 and Forecast 2022-2032, By By Packaging
8.1. Introduction / Key Findings
8.2. Historical Market Size Value (US$ Mn) & Volume (Mn Units) Analysis By By Packaging, 2017-2021
8.3. Current and Future Market Size Value (US$ Mn) & Volume (Mn Units) Analysis and Forecast By By Packaging, 2022-2032
8.3.1. Bottles
8.3.2. Tubes
8.3.3. Pump
8.4. Y-o-Y Growth Trend Analysis By By Packaging, 2017-2021
8.5. Absolute $ Opportunity Analysis By By Packaging, 2022-2032
9. Global Descaler Market Analysis 2017-2021 and Forecast 2022-2032, By Sales Channels
9.1. Introduction / Key Findings
9.2. Historical Market Size Value (US$ Mn) & Volume (Mn Units) Analysis By Sales Channels , 2017-2021
9.3. Current and Future Market Size Value (US$ Mn) & Volume (Mn Units) Analysis and Forecast By Sales Channels , 2022-2032
9.3.1. Wholesaler/Distributors
9.3.2. Hypermarket/Supermarket
9.3.3. Specialty Store
9.3.4. Online Store
9.3.5. Others
9.4. Y-o-Y Growth Trend Analysis By Sales Channels , 2017-2021
9.5. Absolute $ Opportunity Analysis By Sales Channels , 2022-2032
10. Global Descaler Market Analysis 2017-2021 and Forecast 2022-2032, By Region
10.1. Introduction
10.2. Historical Market Size Value (US$ Mn) & Volume (Mn Units) Analysis By Region, 2017-2021
10.3. Current Market Size Value (US$ Mn) & Volume (Mn Units) Analysis and Forecast By Region, 2022-2032
10.3.1. North America
10.3.2. Latin America
10.3.3. Europe
10.3.4. East Asia
10.3.5. South Asia
10.3.6. Oceania
10.3.7. MEA
10.4. Market Attractiveness Analysis By Region
11. North America Descaler Market Analysis 2017-2021 and Forecast 2022-2032, By Country
11.1. Historical Market Size Value (US$ Mn) & Volume (Mn Units) Trend Analysis By Market Taxonomy, 2017-2021
11.2. Market Size Value (US$ Mn) & Volume (Mn Units) Forecast By Market Taxonomy, 2022-2032
11.2.1. By Country
11.2.1.1. U.S.
11.2.1.2. Canada
11.2.2. By Application
11.2.3. By By Format
11.2.4. By End Use
11.2.5. By By Packaging
11.2.6. By Sales Channels
11.3. Market Attractiveness Analysis
11.3.1. By Country
11.3.2. By Application
11.3.3. By By Format
11.3.4. By End Use
11.3.5. By By Packaging
11.3.6. By Sales Channels
11.4. Key Takeaways
12. Latin America Descaler Market Analysis 2017-2021 and Forecast 2022-2032, By Country
12.1. Historical Market Size Value (US$ Mn) & Volume (Mn Units) Trend Analysis By Market Taxonomy, 2017-2021
12.2. Market Size Value (US$ Mn) & Volume (Mn Units) Forecast By Market Taxonomy, 2022-2032
12.2.1. By Country
12.2.1.1. Brazil
12.2.1.2. Mexico
12.2.1.3. Rest of Latin America
12.2.2. By Application
12.2.3. By By Format
12.2.4. By End Use
12.2.5. By By Packaging
12.2.6. By Sales Channels
12.3. Market Attractiveness Analysis
12.3.1. By Country
12.3.2. By Application
12.3.3. By By Format
12.3.4. By End Use
12.3.5. By By Packaging
12.3.6. By Sales Channels
12.4. Key Takeaways
13. Europe Descaler Market Analysis 2017-2021 and Forecast 2022-2032, By Country
13.1. Historical Market Size Value (US$ Mn) & Volume (Mn Units) Trend Analysis By Market Taxonomy, 2017-2021
13.2. Market Size Value (US$ Mn) & Volume (Mn Units) Forecast By Market Taxonomy, 2022-2032
13.2.1. By Country
13.2.1.1. Germany
13.2.1.2. Italy
13.2.1.3. France
13.2.1.4. U.K.
13.2.1.5. Spain
13.2.1.6. Russia
13.2.1.7. BENELUX
13.2.1.8. Rest of Europe
13.2.2. By Application
13.2.3. By By Format
13.2.4. By End Use
13.2.5. By By Packaging
13.2.6. By Sales Channels
13.3. Market Attractiveness Analysis
13.3.1. By Country
13.3.2. By Application
13.3.3. By By Format
13.3.4. By End Use
13.3.5. By By Packaging
13.3.6. By Sales Channels
13.4. Key Takeaways
14. East Asia Descaler Market Analysis 2017-2021 and Forecast 2022-2032, By Country
14.1. Historical Market Size Value (US$ Mn) & Volume (Mn Units) Trend Analysis By Market Taxonomy, 2017-2021
14.2. Market Size Value (US$ Mn) & Volume (Mn Units) Forecast By Market Taxonomy, 2022-2032
14.2.1. By Country
14.2.1.1. China
14.2.1.2. Japan
14.2.1.3. South Korea
14.2.2. By Application
14.2.3. By By Format
14.2.4. By End Use
14.2.5. By By Packaging
14.2.6. By Sales Channels
14.3. Market Attractiveness Analysis
14.3.1. By Country
14.3.2. By Application
14.3.3. By By Format
14.3.4. By End Use
14.3.5. By By Packaging
14.3.6. By Sales Channels
14.4. Key Takeaways
15. South Asia Descaler Market Analysis 2017-2021 and Forecast 2022-2032, By Country
15.1. Historical Market Size Value (US$ Mn) & Volume (Mn Units) Trend Analysis By Market Taxonomy, 2017-2021
15.2. Market Size Value (US$ Mn) & Volume (Mn Units) Forecast By Market Taxonomy, 2022-2032
15.2.1. By Country
15.2.1.1. India
15.2.1.2. Thailand
15.2.1.3. Malaysia
15.2.1.4. Indonesia
15.2.1.5. Rest of South Asia
15.2.2. By Application
15.2.3. By By Format
15.2.4. By End Use
15.2.5. By By Packaging
15.2.6. By Sales Channels
15.3. Market Attractiveness Analysis
15.3.1. By Country
15.3.2. By Application
15.3.3. By By Format
15.3.4. By End Use
15.3.5. By By Packaging
15.3.6. By Sales Channels
15.4. Key Takeaways
16. Oceania Descaler Market Analysis 2017-2021 and Forecast 2022-2032, By Country
16.1. Historical Market Size Value (US$ Mn) & Volume (Mn Units) Trend Analysis By Market Taxonomy, 2017-2021
16.2. Market Size Value (US$ Mn) & Volume (Mn Units) Forecast By Market Taxonomy, 2022-2032
16.2.1. By Country
16.2.1.1. Australia
16.2.1.2. New Zealand
16.2.2. By Application
16.2.3. By By Format
16.2.4. By End Use
16.2.5. By By Packaging
16.2.6. By Sales Channels
16.3. Market Attractiveness Analysis
16.3.1. By Country
16.3.2. By Application
16.3.3. By By Format
16.3.4. By End Use
16.3.5. By By Packaging
16.3.6. By Sales Channels
16.4. Key Takeaways
17. MEA Descaler Market Analysis 2017-2021 and Forecast 2022-2032, By Country
17.1. Historical Market Size Value (US$ Mn) & Volume (Mn Units) Trend Analysis By Market Taxonomy, 2017-2021
17.2. Market Size Value (US$ Mn) & Volume (Mn Units) Forecast By Market Taxonomy, 2022-2032
17.2.1. By Country
17.2.1.1. GCC Countries
17.2.1.2. Turkey
17.2.1.3. Israel
17.2.1.4. South Africa
17.2.1.5. Egypt
17.2.1.6. Rest Of MEA
17.2.2. By Application
17.2.3. By By Format
17.2.4. By End Use
17.2.5. By By Packaging
17.2.6. By Sales Channels
17.3. Market Attractiveness Analysis
17.3.1. By Country
17.3.2. By Application
17.3.3. By By Format
17.3.4. By End Use
17.3.5. By By Packaging
17.3.6. By Sales Channels
17.4. Key Takeaways
18. Key Countries Descaler Market Analysis
18.1. U.S.
18.1.1. Pricing Analysis
18.1.2. Market Share Analysis, 2021
18.1.2.1. By Application
18.1.2.2. By By Format
18.1.2.3. By End Use
18.1.2.4. By By Packaging
18.1.2.5. By Sales Channels
18.2. Canada
18.2.1. Pricing Analysis
18.2.2. Market Share Analysis, 2021
18.2.2.1. By Application
18.2.2.2. By By Format
18.2.2.3. By End Use
18.2.2.4. By By Packaging
18.2.2.5. By Sales Channels
18.3. Brazil
18.3.1. Pricing Analysis
18.3.2. Market Share Analysis, 2021
18.3.2.1. By Application
18.3.2.2. By By Format
18.3.2.3. By End Use
18.3.2.4. By By Packaging
18.3.2.5. By Sales Channels
18.4. Mexico
18.4.1. Pricing Analysis
18.4.2. Market Share Analysis, 2021
18.4.2.1. By Application
18.4.2.2. By By Format
18.4.2.3. By End Use
18.4.2.4. By By Packaging
18.4.2.5. By Sales Channels
18.5. Argentina
18.5.1. Pricing Analysis
18.5.2. Market Share Analysis, 2021
18.5.2.1. By Application
18.5.2.2. By By Format
18.5.2.3. By End Use
18.5.2.4. By By Packaging
18.5.2.5. By Sales Channels
18.6. Germany
18.6.1. Pricing Analysis
18.6.2. Market Share Analysis, 2021
18.6.2.1. By Application
18.6.2.2. By By Format
18.6.2.3. By End Use
18.6.2.4. By By Packaging
18.6.2.5. By Sales Channels
18.7. Italy
18.7.1. Pricing Analysis
18.7.2. Market Share Analysis, 2021
18.7.2.1. By Application
18.7.2.2. By By Format
18.7.2.3. By End Use
18.7.2.4. By By Packaging
18.7.2.5. By Sales Channels
18.8. France
18.8.1. Pricing Analysis
18.8.2. Market Share Analysis, 2021
18.8.2.1. By Application
18.8.2.2. By By Format
18.8.2.3. By End Use
18.8.2.4. By By Packaging
18.8.2.5. By Sales Channels
18.9. U.K.
18.9.1. Pricing Analysis
18.9.2. Market Share Analysis, 2021
18.9.2.1. By Application
18.9.2.2. By By Format
18.9.2.3. By End Use
18.9.2.4. By By Packaging
18.9.2.5. By Sales Channels
18.10. Spain
18.10.1. Pricing Analysis
18.10.2. Market Share Analysis, 2021
18.10.2.1. By Application
18.10.2.2. By By Format
18.10.2.3. By End Use
18.10.2.4. By By Packaging
18.10.2.5. By Sales Channels
18.11. Russia
18.11.1. Pricing Analysis
18.11.2. Market Share Analysis, 2021
18.11.2.1. By Application
18.11.2.2. By By Format
18.11.2.3. By End Use
18.11.2.4. By By Packaging
18.11.2.5. By Sales Channels
18.12. BENELUX
18.12.1. Pricing Analysis
18.12.2. Market Share Analysis, 2021
18.12.2.1. By Application
18.12.2.2. By By Format
18.12.2.3. By End Use
18.12.2.4. By By Packaging
18.12.2.5. By Sales Channels
18.13. China
18.13.1. Pricing Analysis
18.13.2. Market Share Analysis, 2021
18.13.2.1. By Application
18.13.2.2. By By Format
18.13.2.3. By End Use
18.13.2.4. By By Packaging
18.13.2.5. By Sales Channels
18.14. Japan
18.14.1. Pricing Analysis
18.14.2. Market Share Analysis, 2021
18.14.2.1. By Application
18.14.2.2. By By Format
18.14.2.3. By End Use
18.14.2.4. By By Packaging
18.14.2.5. By Sales Channels
18.15. South Korea
18.15.1. Pricing Analysis
18.15.2. Market Share Analysis, 2021
18.15.2.1. By Application
18.15.2.2. By By Format
18.15.2.3. By End Use
18.15.2.4. By By Packaging
18.15.2.5. By Sales Channels
18.16. India
18.16.1. Pricing Analysis
18.16.2. Market Share Analysis, 2021
18.16.2.1. By Application
18.16.2.2. By By Format
18.16.2.3. By End Use
18.16.2.4. By By Packaging
18.16.2.5. By Sales Channels
18.17. GCC Countries
18.17.1. Pricing Analysis
18.17.2. Market Share Analysis, 2021
18.17.2.1. By Application
18.17.2.2. By By Format
18.17.2.3. By End Use
18.17.2.4. By By Packaging
18.17.2.5. By Sales Channels
18.18. Turkey
18.18.1. Pricing Analysis
18.18.2. Market Share Analysis, 2021
18.18.2.1. By Application
18.18.2.2. By By Format
18.18.2.3. By End Use
18.18.2.4. By By Packaging
18.18.2.5. By Sales Channels
18.19. Israel
18.19.1. Pricing Analysis
18.19.2. Market Share Analysis, 2021
18.19.2.1. By Application
18.19.2.2. By By Format
18.19.2.3. By End Use
18.19.2.4. By By Packaging
18.19.2.5. By Sales Channels
18.20. South Africa
18.20.1. Pricing Analysis
18.20.2. Market Share Analysis, 2021
18.20.2.1. By Application
18.20.2.2. By By Format
18.20.2.3. By End Use
18.20.2.4. By By Packaging
18.20.2.5. By Sales Channels
18.21. Egypt
18.21.1. Pricing Analysis
18.21.2. Market Share Analysis, 2021
18.21.2.1. By Application
18.21.2.2. By By Format
18.21.2.3. By End Use
18.21.2.4. By By Packaging
18.21.2.5. By Sales Channels
19. Market Structure Analysis
19.1. Competition Dashboard
19.2. Competition Benchmarking
19.3. Market Share Analysis of Top Players
19.3.1. By Regional
19.3.2. By Application
19.3.3. By By Format
19.3.4. By End Use
19.3.5. By By Packaging
19.3.6. By Sales Channels
20. Competition Analysis
20.1. Competition Deep Dive
20.1.1. Miele
20.1.1.1. Overview
20.1.1.2. Product Portfolio
20.1.1.3. Profitability by Market Segment
20.1.1.4. Sales Footprint
20.1.1.5. Strategy Overview
20.1.1.5.1. Marketing Strategy
20.1.1.5.2. Product Strategy
20.1.2. Keurig
20.1.2.1. Overview
20.1.2.2. Product Portfolio
20.1.2.3. Profitability by Market Segment
20.1.2.4. Sales Footprint
20.1.2.5. Strategy Overview
20.1.2.5.1. Marketing Strategy
20.1.2.5.2. Product Strategy
20.1.3. Urnex
20.1.3.1. Overview
20.1.3.2. Product Portfolio
20.1.3.3. Profitability by Market Segment
20.1.3.4. Sales Footprint
20.1.3.5. Strategy Overview
20.1.3.5.1. Marketing Strategy
20.1.3.5.2. Product Strategy
20.1.4. OXO
20.1.4.1. Overview
20.1.4.2. Product Portfolio
20.1.4.3. Profitability by Market Segment
20.1.4.4. Sales Footprint
20.1.4.5. Strategy Overview
20.1.4.5.1. Marketing Strategy
20.1.4.5.2. Product Strategy
20.1.5. Nespresso
20.1.5.1. Overview
20.1.5.2. Product Portfolio
20.1.5.3. Profitability by Market Segment
20.1.5.4. Sales Footprint
20.1.5.5. Strategy Overview
20.1.5.5.1. Marketing Strategy
20.1.5.5.2. Product Strategy
20.1.6. Kao
20.1.6.1. Overview
20.1.6.2. Product Portfolio
20.1.6.3. Profitability by Market Segment
20.1.6.4. Sales Footprint
20.1.6.5. Strategy Overview
20.1.6.5.1. Marketing Strategy
20.1.6.5.2. Product Strategy
20.1.7. S. C. Johnson & Son
20.1.7.1. Overview
20.1.7.2. Product Portfolio
20.1.7.3. Profitability by Market Segment
20.1.7.4. Sales Footprint
20.1.7.5. Strategy Overview
20.1.7.5.1. Marketing Strategy
20.1.7.5.2. Product Strategy
20.1.8. Lion
20.1.8.1. Overview
20.1.8.2. Product Portfolio
20.1.8.3. Profitability by Market Segment
20.1.8.4. Sales Footprint
20.1.8.5. Strategy Overview
20.1.8.5.1. Marketing Strategy
20.1.8.5.2. Product Strategy
20.1.9. Blue Moon
20.1.9.1. Overview
20.1.9.2. Product Portfolio
20.1.9.3. Profitability by Market Segment
20.1.9.4. Sales Footprint
20.1.9.5. Strategy Overview
20.1.9.5.1. Marketing Strategy
20.1.9.5.2. Product Strategy
20.1.10. PureWater Filters
20.1.10.1. Overview
20.1.10.2. Product Portfolio
20.1.10.3. Profitability by Market Segment
20.1.10.4. Sales Footprint
20.1.10.5. Strategy Overview
20.1.10.5.1. Marketing Strategy
20.1.10.5.2. Product Strategy
20.1.11. Saeco
20.1.11.1. Overview
20.1.11.2. Product Portfolio
20.1.11.3. Profitability by Market Segment
20.1.11.4. Sales Footprint
20.1.11.5. Strategy Overview
20.1.11.5.1. Marketing Strategy
20.1.11.5.2. Product Strategy
20.1.12. Nafine
20.1.12.1. Overview
20.1.12.2. Product Portfolio
20.1.12.3. Profitability by Market Segment
20.1.12.4. Sales Footprint
20.1.12.5. Strategy Overview
20.1.12.5.1. Marketing Strategy
20.1.12.5.2. Product Strategy
20.1.13. Essential Values
20.1.13.1. Overview
20.1.13.2. Product Portfolio
20.1.13.3. Profitability by Market Segment
20.1.13.4. Sales Footprint
20.1.13.5. Strategy Overview
20.1.13.5.1. Marketing Strategy
20.1.13.5.2. Product Strategy
20.1.14. Brodys
20.1.14.1. Overview
20.1.14.2. Product Portfolio
20.1.14.3. Profitability by Market Segment
20.1.14.4. Sales Footprint
20.1.14.5. Strategy Overview
20.1.14.5.1. Marketing Strategy
20.1.14.5.2. Product Strategy
20.1.15. Prochem
20.1.15.1. Overview
20.1.15.2. Product Portfolio
20.1.15.3. Profitability by Market Segment
20.1.15.4. Sales Footprint
20.1.15.5. Strategy Overview
20.1.15.5.1. Marketing Strategy
20.1.15.5.2. Product Strategy
21. Assumptions & Acronyms Used
22. Research Methodology
Let us know your requirement to get
100% FREE customization
Table 1: Global Descaler Market Value (US$ Mn) Forecast by Region, 2017-2032
Table 2: Global Descaler Market Volume (Mn Units) Forecast by Region, 2017-2032
Table 3: Global Descaler Market Value (US$ Mn) Forecast by Application, 2017-2032
Table 4: Global Descaler Market Volume (Mn Units) Forecast by Application, 2017-2032
Table 5: Global Descaler Market Value (US$ Mn) Forecast by By Format , 2017-2032
Table 6: Global Descaler Market Volume (Mn Units) Forecast by By Format , 2017-2032
Table 7: Global Descaler Market Value (US$ Mn) Forecast by End Use, 2017-2032
Table 8: Global Descaler Market Volume (Mn Units) Forecast by End Use, 2017-2032
Table 9: Global Descaler Market Value (US$ Mn) Forecast by By Packaging, 2017-2032
Table 10: Global Descaler Market Volume (Mn Units) Forecast by By Packaging, 2017-2032
Table 11: Global Descaler Market Value (US$ Mn) Forecast by Sales Channels , 2017-2032
Table 12: Global Descaler Market Volume (Mn Units) Forecast by Sales Channels , 2017-2032
Table 13: North America Descaler Market Value (US$ Mn) Forecast by Country, 2017-2032
Table 14: North America Descaler Market Volume (Mn Units) Forecast by Country, 2017-2032
Table 15: North America Descaler Market Value (US$ Mn) Forecast by Application, 2017-2032
Table 16: North America Descaler Market Volume (Mn Units) Forecast by Application, 2017-2032
Table 17: North America Descaler Market Value (US$ Mn) Forecast by By Format , 2017-2032
Table 18: North America Descaler Market Volume (Mn Units) Forecast by By Format , 2017-2032
Table 19: North America Descaler Market Value (US$ Mn) Forecast by End Use, 2017-2032
Table 20: North America Descaler Market Volume (Mn Units) Forecast by End Use, 2017-2032
Table 21: North America Descaler Market Value (US$ Mn) Forecast by By Packaging, 2017-2032
Table 22: North America Descaler Market Volume (Mn Units) Forecast by By Packaging, 2017-2032
Table 23: North America Descaler Market Value (US$ Mn) Forecast by Sales Channels , 2017-2032
Table 24: North America Descaler Market Volume (Mn Units) Forecast by Sales Channels , 2017-2032
Table 25: Latin America Descaler Market Value (US$ Mn) Forecast by Country, 2017-2032
Table 26: Latin America Descaler Market Volume (Mn Units) Forecast by Country, 2017-2032
Table 27: Latin America Descaler Market Value (US$ Mn) Forecast by Application, 2017-2032
Table 28: Latin America Descaler Market Volume (Mn Units) Forecast by Application, 2017-2032
Table 29: Latin America Descaler Market Value (US$ Mn) Forecast by By Format , 2017-2032
Table 30: Latin America Descaler Market Volume (Mn Units) Forecast by By Format , 2017-2032
Table 31: Latin America Descaler Market Value (US$ Mn) Forecast by End Use, 2017-2032
Table 32: Latin America Descaler Market Volume (Mn Units) Forecast by End Use, 2017-2032
Table 33: Latin America Descaler Market Value (US$ Mn) Forecast by By Packaging, 2017-2032
Table 34: Latin America Descaler Market Volume (Mn Units) Forecast by By Packaging, 2017-2032
Table 35: Latin America Descaler Market Value (US$ Mn) Forecast by Sales Channels , 2017-2032
Table 36: Latin America Descaler Market Volume (Mn Units) Forecast by Sales Channels , 2017-2032
Table 37: Europe Descaler Market Value (US$ Mn) Forecast by Country, 2017-2032
Table 38: Europe Descaler Market Volume (Mn Units) Forecast by Country, 2017-2032
Table 39: Europe Descaler Market Value (US$ Mn) Forecast by Application, 2017-2032
Table 40: Europe Descaler Market Volume (Mn Units) Forecast by Application, 2017-2032
Table 41: Europe Descaler Market Value (US$ Mn) Forecast by By Format , 2017-2032
Table 42: Europe Descaler Market Volume (Mn Units) Forecast by By Format , 2017-2032
Table 43: Europe Descaler Market Value (US$ Mn) Forecast by End Use, 2017-2032
Table 44: Europe Descaler Market Volume (Mn Units) Forecast by End Use, 2017-2032
Table 45: Europe Descaler Market Value (US$ Mn) Forecast by By Packaging, 2017-2032
Table 46: Europe Descaler Market Volume (Mn Units) Forecast by By Packaging, 2017-2032
Table 47: Europe Descaler Market Value (US$ Mn) Forecast by Sales Channels , 2017-2032
Table 48: Europe Descaler Market Volume (Mn Units) Forecast by Sales Channels , 2017-2032
Table 49: East Asia Descaler Market Value (US$ Mn) Forecast by Country, 2017-2032
Table 50: East Asia Descaler Market Volume (Mn Units) Forecast by Country, 2017-2032
Table 51: East Asia Descaler Market Value (US$ Mn) Forecast by Application, 2017-2032
Table 52: East Asia Descaler Market Volume (Mn Units) Forecast by Application, 2017-2032
Table 53: East Asia Descaler Market Value (US$ Mn) Forecast by By Format , 2017-2032
Table 54: East Asia Descaler Market Volume (Mn Units) Forecast by By Format , 2017-2032
Table 55: East Asia Descaler Market Value (US$ Mn) Forecast by End Use, 2017-2032
Table 56: East Asia Descaler Market Volume (Mn Units) Forecast by End Use, 2017-2032
Table 57: East Asia Descaler Market Value (US$ Mn) Forecast by By Packaging, 2017-2032
Table 58: East Asia Descaler Market Volume (Mn Units) Forecast by By Packaging, 2017-2032
Table 59: East Asia Descaler Market Value (US$ Mn) Forecast by Sales Channels , 2017-2032
Table 60: East Asia Descaler Market Volume (Mn Units) Forecast by Sales Channels , 2017-2032
Table 61: South Asia Descaler Market Value (US$ Mn) Forecast by Country, 2017-2032
Table 62: South Asia Descaler Market Volume (Mn Units) Forecast by Country, 2017-2032
Table 63: South Asia Descaler Market Value (US$ Mn) Forecast by Application, 2017-2032
Table 64: South Asia Descaler Market Volume (Mn Units) Forecast by Application, 2017-2032
Table 65: South Asia Descaler Market Value (US$ Mn) Forecast by By Format , 2017-2032
Table 66: South Asia Descaler Market Volume (Mn Units) Forecast by By Format , 2017-2032
Table 67: South Asia Descaler Market Value (US$ Mn) Forecast by End Use, 2017-2032
Table 68: South Asia Descaler Market Volume (Mn Units) Forecast by End Use, 2017-2032
Table 69: South Asia Descaler Market Value (US$ Mn) Forecast by By Packaging, 2017-2032
Table 70: South Asia Descaler Market Volume (Mn Units) Forecast by By Packaging, 2017-2032
Table 71: South Asia Descaler Market Value (US$ Mn) Forecast by Sales Channels , 2017-2032
Table 72: South Asia Descaler Market Volume (Mn Units) Forecast by Sales Channels , 2017-2032
Table 73: Oceania Descaler Market Value (US$ Mn) Forecast by Country, 2017-2032
Table 74: Oceania Descaler Market Volume (Mn Units) Forecast by Country, 2017-2032
Table 75: Oceania Descaler Market Value (US$ Mn) Forecast by Application, 2017-2032
Table 76: Oceania Descaler Market Volume (Mn Units) Forecast by Application, 2017-2032
Table 77: Oceania Descaler Market Value (US$ Mn) Forecast by By Format , 2017-2032
Table 78: Oceania Descaler Market Volume (Mn Units) Forecast by By Format , 2017-2032
Table 79: Oceania Descaler Market Value (US$ Mn) Forecast by End Use, 2017-2032
Table 80: Oceania Descaler Market Volume (Mn Units) Forecast by End Use, 2017-2032
Table 81: Oceania Descaler Market Value (US$ Mn) Forecast by By Packaging, 2017-2032
Table 82: Oceania Descaler Market Volume (Mn Units) Forecast by By Packaging, 2017-2032
Table 83: Oceania Descaler Market Value (US$ Mn) Forecast by Sales Channels , 2017-2032
Table 84: Oceania Descaler Market Volume (Mn Units) Forecast by Sales Channels , 2017-2032
Table 85: MEA Descaler Market Value (US$ Mn) Forecast by Country, 2017-2032
Table 86: MEA Descaler Market Volume (Mn Units) Forecast by Country, 2017-2032
Table 87: MEA Descaler Market Value (US$ Mn) Forecast by Application, 2017-2032
Table 88: MEA Descaler Market Volume (Mn Units) Forecast by Application, 2017-2032
Table 89: MEA Descaler Market Value (US$ Mn) Forecast by By Format , 2017-2032
Table 90: MEA Descaler Market Volume (Mn Units) Forecast by By Format , 2017-2032
Table 91: MEA Descaler Market Value (US$ Mn) Forecast by End Use, 2017-2032
Table 92: MEA Descaler Market Volume (Mn Units) Forecast by End Use, 2017-2032
Table 93: MEA Descaler Market Value (US$ Mn) Forecast by By Packaging, 2017-2032
Table 94: MEA Descaler Market Volume (Mn Units) Forecast by By Packaging, 2017-2032
Table 95: MEA Descaler Market Value (US$ Mn) Forecast by Sales Channels , 2017-2032
Table 96: MEA Descaler Market Volume (Mn Units) Forecast by Sales Channels , 2017-2032
Find your sweet spots for generating winning opportunities in this market.
Talk to AnalystFigure 1: Global Descaler Market Value (US$ Mn) by Application, 2022-2032
Figure 2: Global Descaler Market Value (US$ Mn) by By Format , 2022-2032
Figure 3: Global Descaler Market Value (US$ Mn) by End Use, 2022-2032
Figure 4: Global Descaler Market Value (US$ Mn) by By Packaging, 2022-2032
Figure 5: Global Descaler Market Value (US$ Mn) by Sales Channels , 2022-2032
Figure 6: Global Descaler Market Value (US$ Mn) by Region, 2022-2032
Figure 7: Global Descaler Market Value (US$ Mn) Analysis by Region, 2017-2032
Figure 8: Global Descaler Market Volume (Mn Units) Analysis by Region, 2017-2032
Figure 9: Global Descaler Market Value Share (%) and BPS Analysis by Region, 2022-2032
Figure 10: Global Descaler Market Y-o-Y Growth (%) Projections by Region, 2022-2032
Figure 11: Global Descaler Market Value (US$ Mn) Analysis by Application, 2017-2032
Figure 12: Global Descaler Market Volume (Mn Units) Analysis by Application, 2017-2032
Figure 13: Global Descaler Market Value Share (%) and BPS Analysis by Application, 2022-2032
Figure 14: Global Descaler Market Y-o-Y Growth (%) Projections by Application, 2022-2032
Figure 15: Global Descaler Market Value (US$ Mn) Analysis by By Format , 2017-2032
Figure 16: Global Descaler Market Volume (Mn Units) Analysis by By Format , 2017-2032
Figure 17: Global Descaler Market Value Share (%) and BPS Analysis by By Format , 2022-2032
Figure 18: Global Descaler Market Y-o-Y Growth (%) Projections by By Format , 2022-2032
Figure 19: Global Descaler Market Value (US$ Mn) Analysis by End Use, 2017-2032
Figure 20: Global Descaler Market Volume (Mn Units) Analysis by End Use, 2017-2032
Figure 21: Global Descaler Market Value Share (%) and BPS Analysis by End Use, 2022-2032
Figure 22: Global Descaler Market Y-o-Y Growth (%) Projections by End Use, 2022-2032
Figure 23: Global Descaler Market Value (US$ Mn) Analysis by By Packaging, 2017-2032
Figure 24: Global Descaler Market Volume (Mn Units) Analysis by By Packaging, 2017-2032
Figure 25: Global Descaler Market Value Share (%) and BPS Analysis by By Packaging, 2022-2032
Figure 26: Global Descaler Market Y-o-Y Growth (%) Projections by By Packaging, 2022-2032
Figure 27: Global Descaler Market Value (US$ Mn) Analysis by Sales Channels , 2017-2032
Figure 28: Global Descaler Market Volume (Mn Units) Analysis by Sales Channels , 2017-2032
Figure 29: Global Descaler Market Value Share (%) and BPS Analysis by Sales Channels , 2022-2032
Figure 30: Global Descaler Market Y-o-Y Growth (%) Projections by Sales Channels , 2022-2032
Figure 31: Global Descaler Market Attractiveness by Application, 2022-2032
Figure 32: Global Descaler Market Attractiveness by By Format , 2022-2032
Figure 33: Global Descaler Market Attractiveness by End Use, 2022-2032
Figure 34: Global Descaler Market Attractiveness by By Packaging, 2022-2032
Figure 35: Global Descaler Market Attractiveness by Sales Channels , 2022-2032
Figure 36: Global Descaler Market Attractiveness by Region, 2022-2032
Figure 37: North America Descaler Market Value (US$ Mn) by Application, 2022-2032
Figure 38: North America Descaler Market Value (US$ Mn) by By Format , 2022-2032
Figure 39: North America Descaler Market Value (US$ Mn) by End Use, 2022-2032
Figure 40: North America Descaler Market Value (US$ Mn) by By Packaging, 2022-2032
Figure 41: North America Descaler Market Value (US$ Mn) by Sales Channels , 2022-2032
Figure 42: North America Descaler Market Value (US$ Mn) by Country, 2022-2032
Figure 43: North America Descaler Market Value (US$ Mn) Analysis by Country, 2017-2032
Figure 44: North America Descaler Market Volume (Mn Units) Analysis by Country, 2017-2032
Figure 45: North America Descaler Market Value Share (%) and BPS Analysis by Country, 2022-2032
Figure 46: North America Descaler Market Y-o-Y Growth (%) Projections by Country, 2022-2032
Figure 47: North America Descaler Market Value (US$ Mn) Analysis by Application, 2017-2032
Figure 48: North America Descaler Market Volume (Mn Units) Analysis by Application, 2017-2032
Figure 49: North America Descaler Market Value Share (%) and BPS Analysis by Application, 2022-2032
Figure 50: North America Descaler Market Y-o-Y Growth (%) Projections by Application, 2022-2032
Figure 51: North America Descaler Market Value (US$ Mn) Analysis by By Format , 2017-2032
Figure 52: North America Descaler Market Volume (Mn Units) Analysis by By Format , 2017-2032
Figure 53: North America Descaler Market Value Share (%) and BPS Analysis by By Format , 2022-2032
Figure 54: North America Descaler Market Y-o-Y Growth (%) Projections by By Format , 2022-2032
Figure 55: North America Descaler Market Value (US$ Mn) Analysis by End Use, 2017-2032
Figure 56: North America Descaler Market Volume (Mn Units) Analysis by End Use, 2017-2032
Figure 57: North America Descaler Market Value Share (%) and BPS Analysis by End Use, 2022-2032
Figure 58: North America Descaler Market Y-o-Y Growth (%) Projections by End Use, 2022-2032
Figure 59: North America Descaler Market Value (US$ Mn) Analysis by By Packaging, 2017-2032
Figure 60: North America Descaler Market Volume (Mn Units) Analysis by By Packaging, 2017-2032
Figure 61: North America Descaler Market Value Share (%) and BPS Analysis by By Packaging, 2022-2032
Figure 62: North America Descaler Market Y-o-Y Growth (%) Projections by By Packaging, 2022-2032
Figure 63: North America Descaler Market Value (US$ Mn) Analysis by Sales Channels , 2017-2032
Figure 64: North America Descaler Market Volume (Mn Units) Analysis by Sales Channels , 2017-2032
Figure 65: North America Descaler Market Value Share (%) and BPS Analysis by Sales Channels , 2022-2032
Figure 66: North America Descaler Market Y-o-Y Growth (%) Projections by Sales Channels , 2022-2032
Figure 67: North America Descaler Market Attractiveness by Application, 2022-2032
Figure 68: North America Descaler Market Attractiveness by By Format , 2022-2032
Figure 69: North America Descaler Market Attractiveness by End Use, 2022-2032
Figure 70: North America Descaler Market Attractiveness by By Packaging, 2022-2032
Figure 71: North America Descaler Market Attractiveness by Sales Channels , 2022-2032
Figure 72: North America Descaler Market Attractiveness by Country, 2022-2032
Figure 73: Latin America Descaler Market Value (US$ Mn) by Application, 2022-2032
Figure 74: Latin America Descaler Market Value (US$ Mn) by By Format , 2022-2032
Figure 75: Latin America Descaler Market Value (US$ Mn) by End Use, 2022-2032
Figure 76: Latin America Descaler Market Value (US$ Mn) by By Packaging, 2022-2032
Figure 77: Latin America Descaler Market Value (US$ Mn) by Sales Channels , 2022-2032
Figure 78: Latin America Descaler Market Value (US$ Mn) by Country, 2022-2032
Figure 79: Latin America Descaler Market Value (US$ Mn) Analysis by Country, 2017-2032
Figure 80: Latin America Descaler Market Volume (Mn Units) Analysis by Country, 2017-2032
Figure 81: Latin America Descaler Market Value Share (%) and BPS Analysis by Country, 2022-2032
Figure 82: Latin America Descaler Market Y-o-Y Growth (%) Projections by Country, 2022-2032
Figure 83: Latin America Descaler Market Value (US$ Mn) Analysis by Application, 2017-2032
Figure 84: Latin America Descaler Market Volume (Mn Units) Analysis by Application, 2017-2032
Figure 85: Latin America Descaler Market Value Share (%) and BPS Analysis by Application, 2022-2032
Figure 86: Latin America Descaler Market Y-o-Y Growth (%) Projections by Application, 2022-2032
Figure 87: Latin America Descaler Market Value (US$ Mn) Analysis by By Format , 2017-2032
Figure 88: Latin America Descaler Market Volume (Mn Units) Analysis by By Format , 2017-2032
Figure 89: Latin America Descaler Market Value Share (%) and BPS Analysis by By Format , 2022-2032
Figure 90: Latin America Descaler Market Y-o-Y Growth (%) Projections by By Format , 2022-2032
Figure 91: Latin America Descaler Market Value (US$ Mn) Analysis by End Use, 2017-2032
Figure 92: Latin America Descaler Market Volume (Mn Units) Analysis by End Use, 2017-2032
Figure 93: Latin America Descaler Market Value Share (%) and BPS Analysis by End Use, 2022-2032
Figure 94: Latin America Descaler Market Y-o-Y Growth (%) Projections by End Use, 2022-2032
Figure 95: Latin America Descaler Market Value (US$ Mn) Analysis by By Packaging, 2017-2032
Figure 96: Latin America Descaler Market Volume (Mn Units) Analysis by By Packaging, 2017-2032
Figure 97: Latin America Descaler Market Value Share (%) and BPS Analysis by By Packaging, 2022-2032
Figure 98: Latin America Descaler Market Y-o-Y Growth (%) Projections by By Packaging, 2022-2032
Figure 99: Latin America Descaler Market Value (US$ Mn) Analysis by Sales Channels , 2017-2032
Figure 100: Latin America Descaler Market Volume (Mn Units) Analysis by Sales Channels , 2017-2032
Figure 101: Latin America Descaler Market Value Share (%) and BPS Analysis by Sales Channels , 2022-2032
Figure 102: Latin America Descaler Market Y-o-Y Growth (%) Projections by Sales Channels , 2022-2032
Figure 103: Latin America Descaler Market Attractiveness by Application, 2022-2032
Figure 104: Latin America Descaler Market Attractiveness by By Format , 2022-2032
Figure 105: Latin America Descaler Market Attractiveness by End Use, 2022-2032
Figure 106: Latin America Descaler Market Attractiveness by By Packaging, 2022-2032
Figure 107: Latin America Descaler Market Attractiveness by Sales Channels , 2022-2032
Figure 108: Latin America Descaler Market Attractiveness by Country, 2022-2032
Figure 109: Europe Descaler Market Value (US$ Mn) by Application, 2022-2032
Figure 110: Europe Descaler Market Value (US$ Mn) by By Format , 2022-2032
Figure 111: Europe Descaler Market Value (US$ Mn) by End Use, 2022-2032
Figure 112: Europe Descaler Market Value (US$ Mn) by By Packaging, 2022-2032
Figure 113: Europe Descaler Market Value (US$ Mn) by Sales Channels , 2022-2032
Figure 114: Europe Descaler Market Value (US$ Mn) by Country, 2022-2032
Figure 115: Europe Descaler Market Value (US$ Mn) Analysis by Country, 2017-2032
Figure 116: Europe Descaler Market Volume (Mn Units) Analysis by Country, 2017-2032
Figure 117: Europe Descaler Market Value Share (%) and BPS Analysis by Country, 2022-2032
Figure 118: Europe Descaler Market Y-o-Y Growth (%) Projections by Country, 2022-2032
Figure 119: Europe Descaler Market Value (US$ Mn) Analysis by Application, 2017-2032
Figure 120: Europe Descaler Market Volume (Mn Units) Analysis by Application, 2017-2032
Figure 121: Europe Descaler Market Value Share (%) and BPS Analysis by Application, 2022-2032
Figure 122: Europe Descaler Market Y-o-Y Growth (%) Projections by Application, 2022-2032
Figure 123: Europe Descaler Market Value (US$ Mn) Analysis by By Format , 2017-2032
Figure 124: Europe Descaler Market Volume (Mn Units) Analysis by By Format , 2017-2032
Figure 125: Europe Descaler Market Value Share (%) and BPS Analysis by By Format , 2022-2032
Figure 126: Europe Descaler Market Y-o-Y Growth (%) Projections by By Format , 2022-2032
Figure 127: Europe Descaler Market Value (US$ Mn) Analysis by End Use, 2017-2032
Figure 128: Europe Descaler Market Volume (Mn Units) Analysis by End Use, 2017-2032
Figure 129: Europe Descaler Market Value Share (%) and BPS Analysis by End Use, 2022-2032
Figure 130: Europe Descaler Market Y-o-Y Growth (%) Projections by End Use, 2022-2032
Figure 131: Europe Descaler Market Value (US$ Mn) Analysis by By Packaging, 2017-2032
Figure 132: Europe Descaler Market Volume (Mn Units) Analysis by By Packaging, 2017-2032
Figure 133: Europe Descaler Market Value Share (%) and BPS Analysis by By Packaging, 2022-2032
Figure 134: Europe Descaler Market Y-o-Y Growth (%) Projections by By Packaging, 2022-2032
Figure 135: Europe Descaler Market Value (US$ Mn) Analysis by Sales Channels , 2017-2032
Figure 136: Europe Descaler Market Volume (Mn Units) Analysis by Sales Channels , 2017-2032
Figure 137: Europe Descaler Market Value Share (%) and BPS Analysis by Sales Channels , 2022-2032
Figure 138: Europe Descaler Market Y-o-Y Growth (%) Projections by Sales Channels , 2022-2032
Figure 139: Europe Descaler Market Attractiveness by Application, 2022-2032
Figure 140: Europe Descaler Market Attractiveness by By Format , 2022-2032
Figure 141: Europe Descaler Market Attractiveness by End Use, 2022-2032
Figure 142: Europe Descaler Market Attractiveness by By Packaging, 2022-2032
Figure 143: Europe Descaler Market Attractiveness by Sales Channels , 2022-2032
Figure 144: Europe Descaler Market Attractiveness by Country, 2022-2032
Figure 145: East Asia Descaler Market Value (US$ Mn) by Application, 2022-2032
Figure 146: East Asia Descaler Market Value (US$ Mn) by By Format , 2022-2032
Figure 147: East Asia Descaler Market Value (US$ Mn) by End Use, 2022-2032
Figure 148: East Asia Descaler Market Value (US$ Mn) by By Packaging, 2022-2032
Figure 149: East Asia Descaler Market Value (US$ Mn) by Sales Channels , 2022-2032
Figure 150: East Asia Descaler Market Value (US$ Mn) by Country, 2022-2032
Figure 151: East Asia Descaler Market Value (US$ Mn) Analysis by Country, 2017-2032
Figure 152: East Asia Descaler Market Volume (Mn Units) Analysis by Country, 2017-2032
Figure 153: East Asia Descaler Market Value Share (%) and BPS Analysis by Country, 2022-2032
Figure 154: East Asia Descaler Market Y-o-Y Growth (%) Projections by Country, 2022-2032
Figure 155: East Asia Descaler Market Value (US$ Mn) Analysis by Application, 2017-2032
Figure 156: East Asia Descaler Market Volume (Mn Units) Analysis by Application, 2017-2032
Figure 157: East Asia Descaler Market Value Share (%) and BPS Analysis by Application, 2022-2032
Figure 158: East Asia Descaler Market Y-o-Y Growth (%) Projections by Application, 2022-2032
Figure 159: East Asia Descaler Market Value (US$ Mn) Analysis by By Format , 2017-2032
Figure 160: East Asia Descaler Market Volume (Mn Units) Analysis by By Format , 2017-2032
Figure 161: East Asia Descaler Market Value Share (%) and BPS Analysis by By Format , 2022-2032
Figure 162: East Asia Descaler Market Y-o-Y Growth (%) Projections by By Format , 2022-2032
Figure 163: East Asia Descaler Market Value (US$ Mn) Analysis by End Use, 2017-2032
Figure 164: East Asia Descaler Market Volume (Mn Units) Analysis by End Use, 2017-2032
Figure 165: East Asia Descaler Market Value Share (%) and BPS Analysis by End Use, 2022-2032
Figure 166: East Asia Descaler Market Y-o-Y Growth (%) Projections by End Use, 2022-2032
Figure 167: East Asia Descaler Market Value (US$ Mn) Analysis by By Packaging, 2017-2032
Figure 168: East Asia Descaler Market Volume (Mn Units) Analysis by By Packaging, 2017-2032
Figure 169: East Asia Descaler Market Value Share (%) and BPS Analysis by By Packaging, 2022-2032
Figure 170: East Asia Descaler Market Y-o-Y Growth (%) Projections by By Packaging, 2022-2032
Figure 171: East Asia Descaler Market Value (US$ Mn) Analysis by Sales Channels , 2017-2032
Figure 172: East Asia Descaler Market Volume (Mn Units) Analysis by Sales Channels , 2017-2032
Figure 173: East Asia Descaler Market Value Share (%) and BPS Analysis by Sales Channels , 2022-2032
Figure 174: East Asia Descaler Market Y-o-Y Growth (%) Projections by Sales Channels , 2022-2032
Figure 175: East Asia Descaler Market Attractiveness by Application, 2022-2032
Figure 176: East Asia Descaler Market Attractiveness by By Format , 2022-2032
Figure 177: East Asia Descaler Market Attractiveness by End Use, 2022-2032
Figure 178: East Asia Descaler Market Attractiveness by By Packaging, 2022-2032
Figure 179: East Asia Descaler Market Attractiveness by Sales Channels , 2022-2032
Figure 180: East Asia Descaler Market Attractiveness by Country, 2022-2032
Figure 181: South Asia Descaler Market Value (US$ Mn) by Application, 2022-2032
Figure 182: South Asia Descaler Market Value (US$ Mn) by By Format , 2022-2032
Figure 183: South Asia Descaler Market Value (US$ Mn) by End Use, 2022-2032
Figure 184: South Asia Descaler Market Value (US$ Mn) by By Packaging, 2022-2032
Figure 185: South Asia Descaler Market Value (US$ Mn) by Sales Channels , 2022-2032
Figure 186: South Asia Descaler Market Value (US$ Mn) by Country, 2022-2032
Figure 187: South Asia Descaler Market Value (US$ Mn) Analysis by Country, 2017-2032
Figure 188: South Asia Descaler Market Volume (Mn Units) Analysis by Country, 2017-2032
Figure 189: South Asia Descaler Market Value Share (%) and BPS Analysis by Country, 2022-2032
Figure 190: South Asia Descaler Market Y-o-Y Growth (%) Projections by Country, 2022-2032
Figure 191: South Asia Descaler Market Value (US$ Mn) Analysis by Application, 2017-2032
Figure 192: South Asia Descaler Market Volume (Mn Units) Analysis by Application, 2017-2032
Figure 193: South Asia Descaler Market Value Share (%) and BPS Analysis by Application, 2022-2032
Figure 194: South Asia Descaler Market Y-o-Y Growth (%) Projections by Application, 2022-2032
Figure 195: South Asia Descaler Market Value (US$ Mn) Analysis by By Format , 2017-2032
Figure 196: South Asia Descaler Market Volume (Mn Units) Analysis by By Format , 2017-2032
Figure 197: South Asia Descaler Market Value Share (%) and BPS Analysis by By Format , 2022-2032
Figure 198: South Asia Descaler Market Y-o-Y Growth (%) Projections by By Format , 2022-2032
Figure 199: South Asia Descaler Market Value (US$ Mn) Analysis by End Use, 2017-2032
Figure 200: South Asia Descaler Market Volume (Mn Units) Analysis by End Use, 2017-2032
Figure 201: South Asia Descaler Market Value Share (%) and BPS Analysis by End Use, 2022-2032
Figure 202: South Asia Descaler Market Y-o-Y Growth (%) Projections by End Use, 2022-2032
Figure 203: South Asia Descaler Market Value (US$ Mn) Analysis by By Packaging, 2017-2032
Figure 204: South Asia Descaler Market Volume (Mn Units) Analysis by By Packaging, 2017-2032
Figure 205: South Asia Descaler Market Value Share (%) and BPS Analysis by By Packaging, 2022-2032
Figure 206: South Asia Descaler Market Y-o-Y Growth (%) Projections by By Packaging, 2022-2032
Figure 207: South Asia Descaler Market Value (US$ Mn) Analysis by Sales Channels , 2017-2032
Figure 208: South Asia Descaler Market Volume (Mn Units) Analysis by Sales Channels , 2017-2032
Figure 209: South Asia Descaler Market Value Share (%) and BPS Analysis by Sales Channels , 2022-2032
Figure 210: South Asia Descaler Market Y-o-Y Growth (%) Projections by Sales Channels , 2022-2032
Figure 211: South Asia Descaler Market Attractiveness by Application, 2022-2032
Figure 212: South Asia Descaler Market Attractiveness by By Format , 2022-2032
Figure 213: South Asia Descaler Market Attractiveness by End Use, 2022-2032
Figure 214: South Asia Descaler Market Attractiveness by By Packaging, 2022-2032
Figure 215: South Asia Descaler Market Attractiveness by Sales Channels , 2022-2032
Figure 216: South Asia Descaler Market Attractiveness by Country, 2022-2032
Figure 217: Oceania Descaler Market Value (US$ Mn) by Application, 2022-2032
Figure 218: Oceania Descaler Market Value (US$ Mn) by By Format , 2022-2032
Figure 219: Oceania Descaler Market Value (US$ Mn) by End Use, 2022-2032
Figure 220: Oceania Descaler Market Value (US$ Mn) by By Packaging, 2022-2032
Figure 221: Oceania Descaler Market Value (US$ Mn) by Sales Channels , 2022-2032
Figure 222: Oceania Descaler Market Value (US$ Mn) by Country, 2022-2032
Figure 223: Oceania Descaler Market Value (US$ Mn) Analysis by Country, 2017-2032
Figure 224: Oceania Descaler Market Volume (Mn Units) Analysis by Country, 2017-2032
Figure 225: Oceania Descaler Market Value Share (%) and BPS Analysis by Country, 2022-2032
Figure 226: Oceania Descaler Market Y-o-Y Growth (%) Projections by Country, 2022-2032
Figure 227: Oceania Descaler Market Value (US$ Mn) Analysis by Application, 2017-2032
Figure 228: Oceania Descaler Market Volume (Mn Units) Analysis by Application, 2017-2032
Figure 229: Oceania Descaler Market Value Share (%) and BPS Analysis by Application, 2022-2032
Figure 230: Oceania Descaler Market Y-o-Y Growth (%) Projections by Application, 2022-2032
Figure 231: Oceania Descaler Market Value (US$ Mn) Analysis by By Format , 2017-2032
Figure 232: Oceania Descaler Market Volume (Mn Units) Analysis by By Format , 2017-2032
Figure 233: Oceania Descaler Market Value Share (%) and BPS Analysis by By Format , 2022-2032
Figure 234: Oceania Descaler Market Y-o-Y Growth (%) Projections by By Format , 2022-2032
Figure 235: Oceania Descaler Market Value (US$ Mn) Analysis by End Use, 2017-2032
Figure 236: Oceania Descaler Market Volume (Mn Units) Analysis by End Use, 2017-2032
Figure 237: Oceania Descaler Market Value Share (%) and BPS Analysis by End Use, 2022-2032
Figure 238: Oceania Descaler Market Y-o-Y Growth (%) Projections by End Use, 2022-2032
Figure 239: Oceania Descaler Market Value (US$ Mn) Analysis by By Packaging, 2017-2032
Figure 240: Oceania Descaler Market Volume (Mn Units) Analysis by By Packaging, 2017-2032
Figure 241: Oceania Descaler Market Value Share (%) and BPS Analysis by By Packaging, 2022-2032
Figure 242: Oceania Descaler Market Y-o-Y Growth (%) Projections by By Packaging, 2022-2032
Figure 243: Oceania Descaler Market Value (US$ Mn) Analysis by Sales Channels , 2017-2032
Figure 244: Oceania Descaler Market Volume (Mn Units) Analysis by Sales Channels , 2017-2032
Figure 245: Oceania Descaler Market Value Share (%) and BPS Analysis by Sales Channels , 2022-2032
Figure 246: Oceania Descaler Market Y-o-Y Growth (%) Projections by Sales Channels , 2022-2032
Figure 247: Oceania Descaler Market Attractiveness by Application, 2022-2032
Figure 248: Oceania Descaler Market Attractiveness by By Format , 2022-2032
Figure 249: Oceania Descaler Market Attractiveness by End Use, 2022-2032
Figure 250: Oceania Descaler Market Attractiveness by By Packaging, 2022-2032
Figure 251: Oceania Descaler Market Attractiveness by Sales Channels , 2022-2032
Figure 252: Oceania Descaler Market Attractiveness by Country, 2022-2032
Figure 253: MEA Descaler Market Value (US$ Mn) by Application, 2022-2032
Figure 254: MEA Descaler Market Value (US$ Mn) by By Format , 2022-2032
Figure 255: MEA Descaler Market Value (US$ Mn) by End Use, 2022-2032
Figure 256: MEA Descaler Market Value (US$ Mn) by By Packaging, 2022-2032
Figure 257: MEA Descaler Market Value (US$ Mn) by Sales Channels , 2022-2032
Figure 258: MEA Descaler Market Value (US$ Mn) by Country, 2022-2032
Figure 259: MEA Descaler Market Value (US$ Mn) Analysis by Country, 2017-2032
Figure 260: MEA Descaler Market Volume (Mn Units) Analysis by Country, 2017-2032
Figure 261: MEA Descaler Market Value Share (%) and BPS Analysis by Country, 2022-2032
Figure 262: MEA Descaler Market Y-o-Y Growth (%) Projections by Country, 2022-2032
Figure 263: MEA Descaler Market Value (US$ Mn) Analysis by Application, 2017-2032
Figure 264: MEA Descaler Market Volume (Mn Units) Analysis by Application, 2017-2032
Figure 265: MEA Descaler Market Value Share (%) and BPS Analysis by Application, 2022-2032
Figure 266: MEA Descaler Market Y-o-Y Growth (%) Projections by Application, 2022-2032
Figure 267: MEA Descaler Market Value (US$ Mn) Analysis by By Format , 2017-2032
Figure 268: MEA Descaler Market Volume (Mn Units) Analysis by By Format , 2017-2032
Figure 269: MEA Descaler Market Value Share (%) and BPS Analysis by By Format , 2022-2032
Figure 270: MEA Descaler Market Y-o-Y Growth (%) Projections by By Format , 2022-2032
Figure 271: MEA Descaler Market Value (US$ Mn) Analysis by End Use, 2017-2032
Figure 272: MEA Descaler Market Volume (Mn Units) Analysis by End Use, 2017-2032
Figure 273: MEA Descaler Market Value Share (%) and BPS Analysis by End Use, 2022-2032
Figure 274: MEA Descaler Market Y-o-Y Growth (%) Projections by End Use, 2022-2032
Figure 275: MEA Descaler Market Value (US$ Mn) Analysis by By Packaging, 2017-2032
Figure 276: MEA Descaler Market Volume (Mn Units) Analysis by By Packaging, 2017-2032
Figure 277: MEA Descaler Market Value Share (%) and BPS Analysis by By Packaging, 2022-2032
Figure 278: MEA Descaler Market Y-o-Y Growth (%) Projections by By Packaging, 2022-2032
Figure 279: MEA Descaler Market Value (US$ Mn) Analysis by Sales Channels , 2017-2032
Figure 280: MEA Descaler Market Volume (Mn Units) Analysis by Sales Channels , 2017-2032
Figure 281: MEA Descaler Market Value Share (%) and BPS Analysis by Sales Channels , 2022-2032
Figure 282: MEA Descaler Market Y-o-Y Growth (%) Projections by Sales Channels , 2022-2032
Figure 283: MEA Descaler Market Attractiveness by Application, 2022-2032
Figure 284: MEA Descaler Market Attractiveness by By Format , 2022-2032
Figure 285: MEA Descaler Market Attractiveness by End Use, 2022-2032
Figure 286: MEA Descaler Market Attractiveness by By Packaging, 2022-2032
Figure 287: MEA Descaler Market Attractiveness by Sales Channels , 2022-2032
Figure 288: MEA Descaler Market Attractiveness by Country, 2022-2032
Need specific information?
Request CustomizationExplore Consumer Product Insights
View Reports