Large Industrial Displays Market
Market Insights on Large Industrial Displays covering sales outlook, demand forecast & up-to-date key trends
Large Industrial Displays Market By Product Type (Open Frame Displays, Panel Mount Displays, Industrial Monitors), Technology (LCD, LED, OLED), End Use (Process Manufacturing, Discrete Manufacturing) & Region - Forecast to 2021- 2031
Large Industrial Displays Market Snapshot
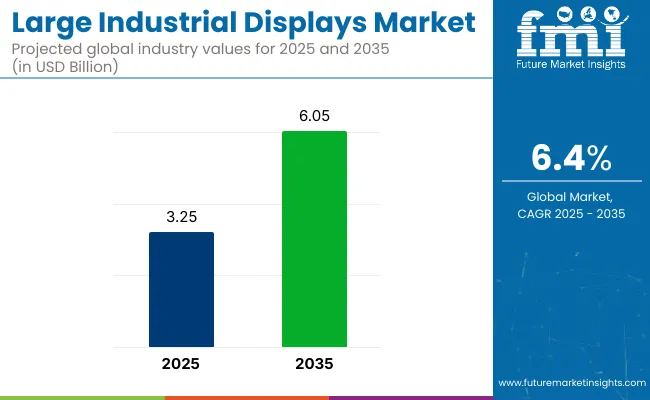
As per Future Market Insights (FMI) analysis, the large industrial displays sales volume will total 110,000 units between by 2031. Overall sales are projected to grow consistently at 6.0% between 2021and 2031.
The North America large industrial displays market will rise at around 5.8% CAGR through the assessment period. Rising application in automotive industries and military sector will guarantee robust growth in the region, as per FMI’s findings.
Despite obstacles faced amid COVID-19 outbreak, large industrial displays market exhibited impressive 3.0% year-on-year growth between 2020 and 2021. According to FMI’s data, the market valuation is expected to surpass US$ 2,657.8 Mn in 2021.
Let us know your requirement to get
100% FREE customization
Key Points Covered In Large Industrial Displays Market Research
- Market Estimates And Forecast 2021 - 2031
- Key drivers and restraints impacting the market growth
- Segment wise, Country-wise, and Region-wise Analysis
- Competition Mapping and Benchmarking
- Brand share and Market share Analysis
- Key Product Innovations and Regulatory Climate
- COVID-19 Impact on large industrial displays Market And How to Navigate
- Recommendations on Key Winning Strategies
Large Industrial Displays Market Future Outlook Brighter in Comparison to Historic Growth
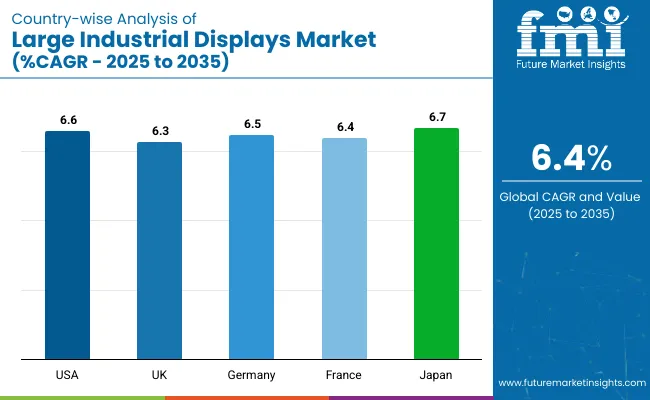
The global large industrial displays market is anticipated to exhibit a CAGR of approximately 6.0% over the forecast period 2021-2031.
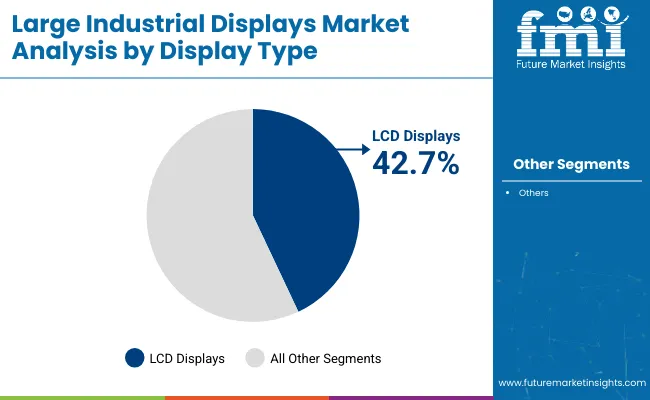
Recent advancements in light emitting diode (LED) backlit and liquid-crystal display (LCD) based display solutions, rising acquisition of Internet of Things (IoT) based devices, and the increasing demand from digital signage applications will positively influence the demand outlook the forecast period.
Some of the leading industrial displays manufacturers are striving to bolster their footprint via strategies such as innovating and developing advanced products.
For instance, in 2020, Advantech, a leading industrial computing platform provider, announced the launch of its new TPC-300 series-the subsequent generation of its widely accepted TPC industrial panel PC concentrated over IoT applications and machine automation.
Its key features include, true-flat touchscreen with IP66-rated front panel, supports panel and VESA mounting for convenient installation, comprehensive operating temperature range and others which facilitates skyrocketing sales in the market.
Other companies in the market are likely to join the bandwagon, following a rising demand from consumers.
For instance, in 2020, Emerson announced the new portfolio launch of RXi industrial display and panel pc products for examining, conceptualizing and enhancing day-to-day production processes in metals, mining, manufacturing, technology and life sciences. Therefore, the RXi industrial displays are modular, responsive and vivid, offering enhanced performance even in the difficult and challenging environments.
With improved research & developmental strategies and innovations in product portfolio, the global large industrial displays market is estimated to gain impetus over the forecast period.
Large Industrial Displays Market - Key Research Findings
- The global large industrial displays market size will surpass US$ 2.65 Bn by 2021.
- The large industrial displays market is estimated to rise ~ 6% CAGR during the forecast period.
- The prominent regions for the large industrial displays market are East Asia, Europe, and South Asia.
- The prominent regions for the large industrial displays market are East Asia, Europe, and South Asia, due to the rising adoption of large industrial displays for video walls and increasing new applications of industries for the expansion of large industrial displays for diverse uses.
- Marketing synergies and distribution among organizations are estimated to exploit the large industrial displays market growth scenarios.
- Prominent players such as Advantech Co., Ltd., Leyard, NEC Display Solutions, Ltd., and Delta Electronics, Inc., in the large industrial displays market are engaging more interactive methods such as co-promotion and co-marketing of products with other businesses. These interactions among partners are presenting an immediate growth influence as related to mergers and acquisitions.
- Video walls are projected to be the most chosen product type section in the large industrial displays market.
- The increasing demand for video walls can be directly related to the global development of the OLED technology. The growing influences such as green technology and safety security concerns are anticipated to boost the development of the large industrial displays market.
Find your sweet spots for generating winning opportunities in this market.
Talk to AnalystTop Factors Shaping The Large Industrial Displays Market
Launch Of Digital Signage And New Products Propelling The Large Industrial Displays Market Growth
Significant market players such as Advantech Co., Ltd., Leyard, NEC Display Solutions, Ltd., and Delta Electronics, Inc., are concentrating more on the growth of large industrial displays product portfolios through launching new products and distribution agreements. For example-
- In 2015, Leyard acquired all the common stocks of Planar System, Inc., a specialist in the production and development of large industrial displays.
- In 2018, NEC Display Solutions acquired S[quadrat] GmbH, a prominent provider of LED solutions. The company is expanding its display technology portfolio to include LED systems for indoor and outdoor solutions.
Emerging Applications Of Flexible Displays
New grounds within industries are evolving the addition of electronics and technologies for the development of the large industrial displays market. The consumer preference towards a single board computer integration i.e. all-in-one concept and a user-friendly touch monitor, is designed to serve as a reliable and flexible platform, which is anticipated to result in the healthy growth of the large industrial displays market.
OLED Technology To Drive Large Industrial Displays Sales
Manufacturers are continuously enhancing and refining their pipeline competencies and its well-established existence in the large industrial displays market by introducing new technology OLED products.
Market Structure Analysis for Large Industrial Displays
- The large industrial displays market is an average-fragmented market with global and regional market players.
- Some prominent companies in the large industrial displays market are Advantech Co., Ltd., Leyard, NEC Display Solutions, Ltd., Delta Electronics, Inc., Daktronics, Data Modul, DFI, Inc., Winmate Inc., Sparton Corporation, Electro-Matic Products, Inc., IP Displays, and others.
- The strategic focus of key players is to uphold the expansion of agreements and distribution partnerships for the global market growth.
- Top manufacturers contributing a high revenue share to the large industrial displays market are Advantech Co., Ltd., Leyard, NEC Display Solutions, Ltd., and Delta Electronics, Inc.

A unified Market Research Subscription Platform, built for today's disparate research needs.
Large Industrial Displays - Meeting Diverse Visual Display Demand in Industrial Environments
As the billboard industry continues to face the heat of environmental regulations, the large industrial displays remain sought-after as they provide an effective means of communication. Furthermore, as industrial robotics and automation is gathering pace, high-performance large industrial displays are becoming a necessity for visibility of real-time data that drives productivity.
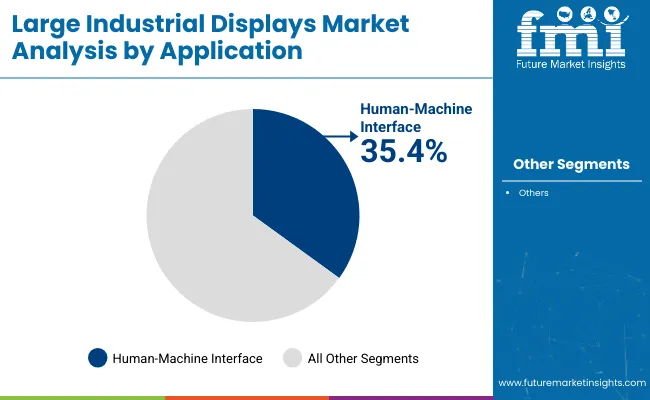
Surging demand for human-machine interface devices to monitor manufacturing processes is likely to impart a new dimension to applications of large industrial displays. Design differentiation will remain a key focus area for manufacturers, aiming sales closure, which has initiated the entry of a series of new-age displays - flexible, foldable, and slimmer.
‘Battle of Adoption’ From ‘Screen-Less’ - The Next Big Thing
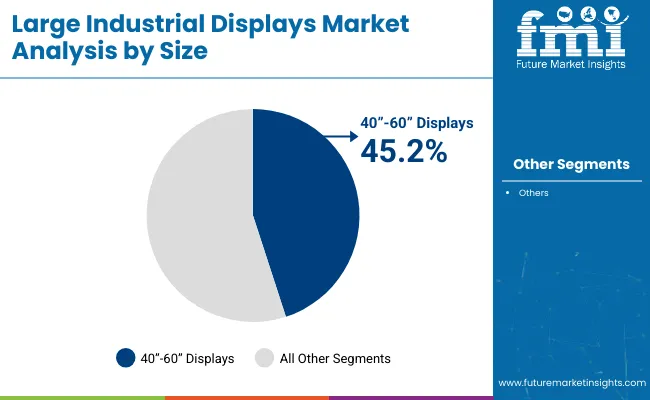
It has been observed, recently, that slimmer large industrial displays beat their wider equivalents in terms of performance, resolution, and space consumption, which enhances their degree of marketability. As end users’ quest for optimizing manufacturing capabilities can be better met with slim-framed large industrial displays, their adoption is likely to remain high in key industries, such as automotive & transportation, and electrical & electronics.
However, large industrial displays are likely to face the ‘battle of adoption’ from the latest breakthrough technology, i.e. screen-less displays 4k display resolution and projectors. With massive energy demands of large industrial displays, it is highly likely that the ‘screen-less’ will pose strong competition to both, large displays and touchscreen displays
Enabling End Users to Achieve Process Efficiency, As Automation Firms Up
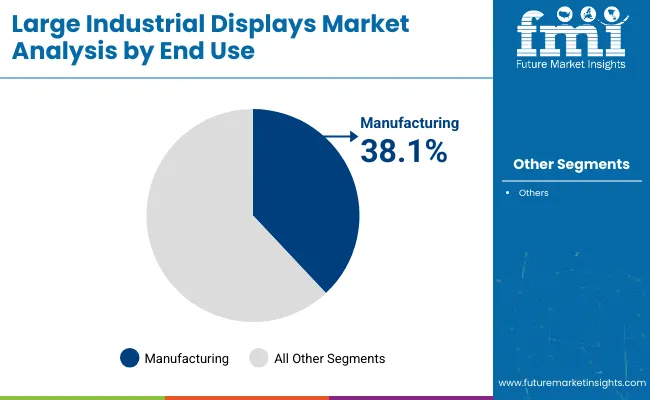
End users are rapidly embracing digitalization to direct their efforts towards achieving process efficiency. Industries, such as pharmaceutical, where product count is crucial, leverage these displays to ensure standard packaging of tablets and medicines.
The U.S. and Canada have been, and will continue to spectate growth in the manufacturing capabilities of numerous industries, as innovation drives automation and advancement in the landscape. As foreign investments move towards developing countries, demand for automation and IoT is likely to influence sales of large industrial displays in East Asia
The Broader Perspective
As consumers are showing remarkable proclivity for novel interactive displays, leading manufacturers of large industrial displays continue to zoom in the focus on R&D, to reach the ever-rising quality bar. Key suppliers are also prioritizing effective adherence to the thriving trend of customization, in an effort to attract revenues through long-term buyer engagement.
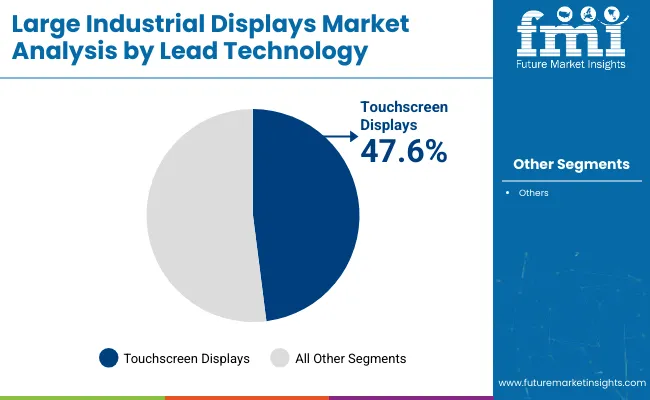
Considering the impact of the penetration of advanced technologies, remote controlled and touchscreen technologies are spreading their roots at a breakneck pace, as a sizeable population of modern consumers seeks ‘interaction’ more than anything, in this space.
How Will the Growth Unfold
While large industrial displays are rapidly solidifying their position as an indispensable instrument within automation enabled industrial ecosystems, catering to custom industry needs will particularly enable manufacturers to retain their customer base in the long run.
Creating shorter wait windows for clientele is likely to be a key strategy for better sales closure opportunities, as minimal TTM continues to be of paramount importance. Besides digital signage, the lightweight OLEDs are also marking a flourishing trend in the large industrial displays market. Spectacular growth in the adoption of IoT is also favoring the growth of large industrial displays market.
Key Segment
By Product Type:
- Open Frame Displays
- Panel Mount Displays
- Industrial Monitors
- Video Walls
By Technology:
- LCD
- LED
- OLED
By Size:
- Open Frame Display, Panel Mount Displays and Industrial Monitors
- 20”-40”
- Above 40”
- Video Walls
- Less than 6 screens
- Above 6 screens
End-use Industry:
- Discrete Manufacturing
- Automotive and Transportation
- General Manufacturing
- Electronics & Electricals
- Process Manufacturing
- Chemicals & Pharmaceutical
- Food & Beverage
- Oil & Gas
By Region:
- North America
- Latin America
- Europe
- South Asia
- East Asia
- Oceania
- Middle East and Africa
Frequently Asked Questions
The global large industrial displays market will reach a valuation of US$ 2,657.8 Mn in 2021.
The large industrial displays market exhibited growth at 4.9% CAGR between 2016 and 2020.
The market share of top 5 players including, Advantech Co., Ltd., Leyard, NEC Display Solutions, Ltd. and Delta Electronics, Inc. stood at 8%, 7%, 6.5% and 5% respectively of the overall market.
The top exporters of large industrial displays include Japan, U.S., China and Germany
The demand for large industrial displays is anticipated to rise at 5.8% in North America between 2021 and 2031.
The Europe market is estimated to grow at an average annual rate of 6.4% in the forecast period.
U.S., Japan, Taiwan, China and Germany are touted as chief producers of large Industrial displays.
Growing demand for multi-featured Human Machine Interface (HMI) devices and rising adoption of Industrial Internet of Things will drive sales of large industrial displays significantly.
Increasing preference of OLED based display units and employment of omnichannel sales by original equipment manufacturers (OEMs) are key trends observed in the market.
Japan and South Korea markets for large industrial display will account for 12.0% of demand registered globally in 2021.
Table of Content
1. Executive Summary
1.1. Global Market Outlook
1.2. Demand Side Trends
1.3. Supply Side Trends
1.4. Technology Roadmap
1.5. Analysis and Recommendations
2. Market Overview
2.1. Market Coverage / Taxonomy
2.2. Market Definition / Scope / Limitations
3. Global Large Industrial Displays Market Demand Analysis 2014–2018 and Forecast, 2019-2029
3.1. Market Volume (Units) Analysis, 2014–2029
3.2. Pricing Analysis, 2018
3.3. Market Value Analysis 2014-2029
4. Market Background
4.1. Macro-Economic Factors
4.1.1. Global Economic Outlook
4.1.2. Global GDP Outlook
4.1.3. Industry-Value Added Growth
4.1.4. Global Geopolitical Factors and Balance of Payments
4.1.5. Global Automotive Industry Outlook
4.1.6. Global Oil & Gas Industry Outlook
4.1.7. Global Chemical Industry Outlook
4.1.8. Global Food & Beverage Industry Outlook
4.1.9. Global Population Outlook
4.1.10. Urbanization Outlook
4.1.11. Global Industry Scenario
4.2. Forecast Factors - Relevance & Impact
4.3. Porter’s Five Forces Analysis
4.4. Value Chain
4.5. Market Dynamics
4.5.1. Drivers
4.5.2. Restraints
4.5.3. Opportunity
4.5.4. Trends
5. Global Large Industrial Displays Market Analysis 2014–2018 and Forecast 2019-2029, By Product Type
5.1. Introduction / Key Findings
5.2. Historical Market Size (US$ Mn) and Volume Analysis By Product Type, 2014 - 2018
5.3. Current and Future Market Size (US$ Mn) and Volume Analysis and Forecast By Product Type, 2019 - 2029
5.3.1. Open Frame Display
5.3.2. Panel Mount Display
5.3.3. Industrial Monitors
5.3.4. Video Walls
5.4. Market Attractiveness Analysis By Product Type
6. Global Large Industrial Displays Market Analysis 2014–2018 and Forecast 2019-2029, By Technology
6.1. Introduction / Key Findings
6.2. Historical Market Size (US$ Mn) and Volume Analysis By Technology, 2014 - 2018
6.3. Current and Future Market Size (US$ Mn) and Volume Analysis and Forecast By Technology, 2019 - 2029
6.3.1. LCD
6.3.2. LED
6.3.3. OLED
6.4. Market Attractiveness Analysis By Technology
7. Global Large Industrial Displays Market Analysis 2014–2018 and Forecast 2019-2029, By Size
7.1. Introduction / Key Findings
7.2. Historical Market Size (US$ Mn) and Volume Analysis By Size, 2014 - 2018
7.3. Current and Future Market Size (US$ Mn) and Volume Analysis and Forecast By Size, 2019 - 2029
7.3.1. Open Frame Display, Panel Mount Display, Industrial Monitors
7.3.1.1. 20”-40”
7.3.1.2. Above 40”
7.3.2. Video Walls
7.3.2.1. Less than 6 screens
7.3.2.2. Above 6 screens
7.4. Market Attractiveness Analysis By Size
8. Global Large Industrial Displays Market Analysis 2014–2018 and Forecast 2019-2029, By End Use
8.1. Introduction / Key Findings
8.2. Historical Market Size (US$ Mn) and Volume Analysis By End Use, 2014 - 2018
8.3. Current and Future Market Size (US$ Mn) and Volume Analysis and Forecast By End Use, 2019 - 2029
8.3.1. Discrete Manufacturing Industries
8.3.1.1. Automotive and Transportation
8.3.1.2. General Manufacturing
8.3.1.3. Electronics and Electricals
8.3.2. Process Manufacturing Industries
8.3.2.1. Chemicals & Pharmaceuticals
8.3.2.2. Food and Beverage
8.3.2.3. Oil and Gas
8.4. Market Attractiveness Analysis By End Use
9. Global Large Industrial Displays Market Analysis 2014–2018 and Forecast 2019-2029, by Region
9.1. Introduction
9.2. Historical Market Size (US$ Mn) and Volume Analysis By Region, 2014 - 2018
9.3. Current Market Size (US$ Mn) and Volume Analysis and Forecast By Region, 2019 - 2029
9.3.1. North America
9.3.2. Latin America
9.3.3. Europe
9.3.4. East Asia
9.3.5. South Asia
9.3.6. Middle East and Africa
9.3.7. Oceania
9.4. Market Attractiveness Analysis By Region
10. North America Large Industrial Displays Market Analysis 2014–2018 and Forecast 2019-2029
10.1. Introduction
10.2. Historical Market Size (US$ Mn) and Volume Trend Analysis By Market Taxonomy, 2014 - 2018
10.3. Market Size (US$ Mn) and Volume Forecast By Market Taxonomy, 2019 - 2029
10.3.1. By Country
10.3.1.1. U.S.
10.3.1.2. Canada
10.3.2. By Product Type
10.3.3. By Technology
10.3.4. By Size
10.3.5. By End Use
10.4. Market Attractiveness Analysis
10.4.1. By Country
10.4.2. By Product Type
10.4.3. By Technology
10.4.4. By Size
10.4.5. By End Use
10.5. Drivers and Restraints - Impact Analysis
11. Latin America Large Industrial Displays Market Analysis 2014–2018 and Forecast 2019-2029
11.1. Introduction
11.2. Historical Market Size (US$ Mn) and Volume Trend Analysis By Market Taxonomy, 2014 - 2018
11.3. Market Size (US$ Mn) and Volume Forecast By Market Taxonomy, 2019 - 2029
11.3.1. By Country
11.3.1.1. Brazil
11.3.1.2. Mexico
11.3.1.3. Rest of Latin America
11.3.2. By Product Type
11.3.3. By Technology
11.3.4. By Size
11.3.5. By End Use
11.4. Market Attractiveness Analysis
11.4.1. By Country
11.4.2. By Product Type
11.4.3. By Technology
11.4.4. By Size
11.4.5. By End Use
11.5. Drivers and Restraints - Impact Analysis
12. Europe Large Industrial Displays Market Analysis 2014–2018 and Forecast 2019-2029
12.1. Introduction
12.2. Historical Market Size (US$ Mn) and Volume Trend Analysis By Market Taxonomy, 2014 - 2018
12.3. Market Size (US$ Mn) and Volume Forecast By Market Taxonomy, 2019 - 2029
12.3.1. By Country
12.3.1.1. Germany
12.3.1.2. Italy
12.3.1.3. France
12.3.1.4. U.K.
12.3.1.5. Spain
12.3.1.6. BENELUX
12.3.1.7. Russia
12.3.1.8. Rest of Europe
12.3.2. By Product Type
12.3.3. By Technology
12.3.4. By Size
12.3.5. By End Use
12.4. Market Attractiveness Analysis
12.4.1. By Country
12.4.2. By Product Type
12.4.3. By Technology
12.4.4. By Size
12.4.5. By End Use
12.5. Drivers and Restraints - Impact Analysis
13. South Asia Large Industrial Displays Market Analysis 2014–2018 and Forecast 2019-2029
13.1. Introduction
13.2. Historical Market Size (US$ Mn) and Volume Trend Analysis By Market Taxonomy, 2014 - 2018
13.3. Market Size (US$ Mn) and Volume Forecast By Market Taxonomy, 2019 - 2029
13.3.1. By Country
13.3.1.1. India
13.3.1.2. Thailand
13.3.1.3. Indonesia
13.3.1.4. Malaysia
13.3.1.5. Philippines
13.3.1.6. Rest of South Asia
13.3.2. By Product Type
13.3.3. By Technology
13.3.4. By Size
13.3.5. By End Use
13.4. Market Attractiveness Analysis
13.4.1. By Country
13.4.2. By Product Type
13.4.3. By Technology
13.4.4. By Size
13.4.5. By End Use
13.5. Drivers and Restraints - Impact Analysis
14. East Asia Large Industrial Displays Market Analysis 2014–2018 and Forecast 2019-2029
14.1. Introduction
14.2. Historical Market Size (US$ Mn) and Volume Trend Analysis By Market Taxonomy, 2014 - 2018
14.3. Market Size (US$ Mn) and Volume Forecast By Market Taxonomy, 2019 - 2029
14.3.1. By Country
14.3.1.1. China
14.3.1.2. Japan
14.3.1.3. South Korea
14.3.2. By Product Type
14.3.3. By Technology
14.3.4. By Size
14.3.5. By End Use
14.4. Market Attractiveness Analysis
14.4.1. By Country
14.4.2. By Product Type
14.4.3. By Technology
14.4.4. By Size
14.4.5. By End Use
14.5. Drivers and Restraints - Impact Analysis
15. Oceania Large Industrial Displays Market Analysis 2014–2018 and Forecast 2019-2029
15.1. Introduction
15.2. Historical Market Size (US$ Mn) and Volume Trend Analysis By Market Taxonomy, 2014 - 2018
15.3. Market Size (US$ Mn) and Volume Forecast By Market Taxonomy, 2019 - 2029
15.3.1. By Country
15.3.1.1. Australia
15.3.1.2. New Zealand
15.3.2. By Product Type
15.3.3. By Technology
15.3.4. By Size
15.3.5. By End Use
15.4. Market Attractiveness Analysis
15.4.1. By Country
15.4.2. By Product Type
15.4.3. By Technology
15.4.4. By Size
15.4.5. By End Use
15.5. Drivers and Restraints - Impact Analysis
16. Middle East and Africa Large Industrial Displays Market Analysis 2014–2018 and Forecast 2019-2029
16.1. Introduction
16.2. Historical Market Size (US$ Mn) and Volume Trend Analysis By Market Taxonomy, 2014 - 2018
16.3. Market Size (US$ Mn) and Volume Forecast By Market Taxonomy, 2019 - 2029
16.3.1. By Country
16.3.1.1. Iran
16.3.1.2. Turkey
16.3.1.3. South Africa
16.3.1.4. Rest of Middle East and Africa
16.3.2. By Product Type
16.3.3. By Technology
16.3.4. By Size
16.3.5. By End Use
16.4. Market Attractiveness Analysis
16.4.1. By Country
16.4.2. By Product Type
16.4.3. By Technology
16.4.4. By Size
16.4.5. By End Use
16.5. Drivers and Restraints - Impact Analysis
17. Emerging Countries Large Industrial Displays Market Analysis 2014–2018 and Forecast 2019-2029
17.1. Introduction
17.1.1. Market Value Proportion Analysis, By Key Countries
17.1.2. Global Vs. Country Growth Comparison
17.2. China Large Industrial Displays Market Analysis
17.2.1. Introduction
17.2.2. Market Value Proportion Analysis by Market Taxonomy
17.2.3. Market Volume (Units) and Value (US$ Mn) Analysis and Forecast by Market Taxonomy
17.2.3.1. By Product Type
17.2.3.2. By Technology
17.2.3.3. By Size
17.2.3.4. By End Use
17.3. India Large Industrial Displays Market Analysis
17.3.1. Introduction
17.3.2. Market Value Proportion Analysis by Market Taxonomy
17.3.3. Market Volume (Units) and Value (US$ Mn) Analysis and Forecast by Market Taxonomy
17.3.3.1. By Product Type
17.3.3.2. By Technology
17.3.3.3. By Size
17.3.3.4. By End Use
17.4. Brazil Large Industrial Displays Market Analysis
17.4.1. Introduction
17.4.2. Market Value Proportion Analysis by Market Taxonomy
17.4.3. Market Volume (Units) and Value (US$ Mn) Analysis and Forecast by Market Taxonomy
17.4.3.1. By Product Type
17.4.3.2. By Technology
17.4.3.3. By Size
17.4.3.4. By End Use
18. Competition Analysis
18.1. Market Structure
18.2. Competition Benchmarking
18.3. Market Intensity Analysis
18.4. List of Manufacturers
18.5. Competition Deep Dive
18.5.1. Advantech Co., Ltd.
18.5.2. Leyard
18.5.3. Daktronics
18.5.4. Data Modul
18.5.5. DFI Inc.
18.5.6. Winmate Inc.
18.5.7. Sparton Corporation
18.5.8. NEC Display Solutions, Ltd.
18.5.9. Delta Electronics, Inc.
18.5.10. Kamal & Co
18.5.11. Electro-Matic Products, Inc.
18.5.12. Elo Touch Solutions, Inc.
18.5.13. IP Displays
18.5.14. Compucare India Pvt. Ltd.
19. Assumptions and Acronyms Used
20. Research Methodology
Let us know your requirement to get
100% FREE customization
List of Tables
Table 01: Global Large Industrial Displays Market Volume (Units) and Market Value (US$ Mn) Historical Data 2014 – 2018 and Forecast 2019 – 2029 by Product Type
Table 02: Global Large Industrial Displays Market Value (US$ Mn) and Volume (Units) Historical Data 2014 – 2018 and Forecast 2019 – 2029 by Technology
Table 03: Global Large Industrial Displays Market Value (US$ Mn) and Volume (Units) Historical Data 2014 – 2018 and Forecast 2019 – 2029 by Size
Table 04: Global Large Industrial Displays Market Value (US$ Mn) and Volume (Units) Historical Data 2014 – 2018 and Forecast 2019 – 2029 by End Use
Table 05: Global Large Industrial Displays Market Value (US$ Mn) and Volume (Units) Historical Data 2014 – 2018 and Forecast 2019 – 2029 by Region
Table 06: North America Large Industrial Displays Market Value (US$ Mn) and Volume (Units) Historical Data 2014 – 2018 and Forecast 2019 – 2029 by Product Type
Table 07: North America Large Industrial Displays Market Value (US$ Mn) and Volume (Units) Historical Data 2014 – 2018 and Forecast 2019 – 2029 by Technology
Table 08: North America Large Industrial Displays Market Value (US$ Mn) and Volume (Units) Historical Data 2014 – 2018 and Forecast 2019 – 2029 by Size
Table 09: North America Large Industrial Displays Market Value (US$ Mn) and Volume (Units) Historical Data 2014 – 2018 and Forecast 2019 – 2029 by End Use
Table 10: North America Large Industrial Displays Market Value (US$ Mn) and Volume (Units) Historical Data 2014 – 2018 and Forecast 2019 – 2029 by Country
Table 11: Latin America Large Industrial Displays Market Value (US$ Mn) and Volume (Units) Historical Data 2014 – 2018 and Forecast 2019 – 2029 by Product Type
Table 12: Latin America Large Industrial Displays Market Value (US$ Mn) and Volume (Units) Historical Data 2014 – 2018 and Forecast 2019 – 2029 by Technology
Table 13: Latin America Large Industrial Displays Market Value (US$ Mn) and Volume (Units) Historical Data 2014 – 2018 and Forecast 2019 – 2029 by Size
Table 14: Latin America Large Industrial Displays Market Value (US$ Mn) and Volume (Units) Historical Data 2014 – 2018 and Forecast 2019 – 2029 by End Use
Table 15: Latin America Large Industrial Displays Market Value (US$ Mn) and Volume (Units) Historical Data 2014 – 2018 and Forecast 2019 – 2029 by Country
Table 16: Europe Large Industrial Displays Market Value (US$ Mn) and Volume (Units) Historical Data 2014 – 2018 and Forecast 2019 – 2029 by Product Type
Table 17: Europe Large Industrial Displays Market Value (US$ Mn) and Volume (Units) Historical Data 2014 – 2018 and Forecast 2019 – 2029 by Technology
Table 18: Europe Large Industrial Displays Market Value (US$ Mn) and Volume (Units) Historical Data 2014 – 2018 and Forecast 2019 – 2029 by Size
Table 19: Europe Large Industrial Displays Market Value (US$ Mn) and Volume (Units) Historical Data 2014 – 2018 and Forecast 2019 – 2029 by End Use
Table 20: Europe Large Industrial Displays Market Value (US$ Mn) and Volume (Units) Historical Data 2014 – 2018 and Forecast 2019 – 2029 by Country
Table 21: South Asia Large Industrial Displays Market Value (US$ Mn) and Volume (Units) Historical Data 2014 – 2018 and Forecast 2019 – 2029 by Product Type
Table 22: South Asia Large Industrial Displays Market Value (US$ Mn) and Volume (Units) Historical Data 2014 – 2018 and Forecast 2019 – 2029 by Technology
Table 23: South Asia Large Industrial Displays Market Value (US$ Mn) and Volume (Units) Historical Data 2014 – 2018 and Forecast 2019 – 2029 by Size
Table 24: South Asia Large Industrial Displays Market Value (US$ Mn) and Volume (Units) Historical Data 2014 – 2018 and Forecast 2019 – 2029 by End Use
Table 25: South Asia Large Industrial Displays Market Value (US$ Mn) and Volume (Units) Historical Data 2014 – 2018 and Forecast 2019 – 2029 by Country
Table 26: East Asia Large Industrial Displays Market Value (US$ Mn) and Volume (Units) Historical Data 2014 – 2018 and Forecast 2019 – 2029 by Product Type
Table 27: East Asia Large Industrial Displays Market Value (US$ Mn) and Volume (Units) Historical Data 2014 – 2018 and Forecast 2019 – 2029 by Technology
Table 28: East Asia Large Industrial Displays Market Value (US$ Mn) and Volume (Units) Historical Data 2014 – 2018 and Forecast 2019 – 2029 by Size
Table 29: East Asia Large Industrial Displays Market Value (US$ Mn) and Volume (Units) Historical Data 2014 – 2018 and Forecast 2019 – 2029 by End Use
Table 30: East Asia Large Industrial Displays Market Value (US$ Mn) and Volume (Units) Historical Data 2014 – 2018 and Forecast 2019 – 2029 by Country
Table 31: Oceania Large Industrial Displays Market Value (US$ Mn) and Volume (Units) Historical Data 2014 – 2018 and Forecast 2019 – 2029 by Product Type
Table 32: Oceania Large Industrial Displays Market Value (US$ Mn) and Volume (Units) Historical Data 2014 – 2018 and Forecast 2019 – 2029 by Technology
Table 33: Oceania Large Industrial Displays Market Value (US$ Mn) and Volume (Units) Historical Data 2014 – 2018 and Forecast 2019 – 2029 by Size
Table 34: Oceania Large Industrial Displays Market Value (US$ Mn) and Volume (Units) Historical Data 2014 – 2018 and Forecast 2019 – 2029 by End Use
Table 35: Oceania Large Industrial Displays Market Value (US$ Mn) and Volume (Units) Historical Data 2014 – 2018 and Forecast 2019 – 2029 by Country
Table 36: Middle East and Africa Large Industrial Displays Market Value (US$ Mn) and Volume (Units) Historical Data 2014 – 2018 and Forecast 2019 – 2029 by Product Type
Table 37: Middle East and Africa Large Industrial Displays Market Value (US$ Mn) and Volume (Units) Historical Data 2014 – 2018 and Forecast 2019 – 2029 by Technology
Table 38: Middle East and Africa Large Industrial Displays Market Value (US$ Mn) and Volume (Units) Historical Data 2014 – 2018 and Forecast 2019 – 2029 by Size
Table 39: Middle East and Africa Large Industrial Displays Market Value (US$ Mn) and Volume (Units) Historical Data 2014 – 2018 and Forecast 2019 – 2029 by End Use
Table 40: Middle East and Africa Large Industrial Displays Market Value (US$ Mn) and Volume (Units) Historical Data 2014 – 2018 and Forecast 2019 – 2029 by Country
Table 41: China Large Industrial Displays Market Value (US$ Mn) and Volume (Units) Historical Data 2014 – 2018 and Forecast 2019 – 2029 by Product Type
Table 42: China Large Industrial Displays Market Value (US$ Mn) and Volume (Units) Historical Data 2014 – 2018 and Forecast 2019 – 2029 by Technology
Table 43: China Large Industrial Displays Market Value (US$ Mn) and Volume (Units) Historical Data 2014 – 2018 and Forecast 2019 – 2029 by Size
Table 44: China Large Industrial Displays Market Value (US$ Mn) and Volume (Units) Historical Data 2014 – 2018 and Forecast 2019 – 2029 by End Use
Table 45: India Large Industrial Displays Market Value (US$ Mn) and Volume (Units) Historical Data 2014 – 2018 and Forecast 2019 – 2029 by Product Type
Table 46: India Large Industrial Displays Market Value (US$ Mn) and Volume (Units) Historical Data 2014 – 2018 and Forecast 2019 – 2029 by Technology
Table 47: India Large Industrial Displays Market Value (US$ Mn) and Volume (Units) Historical Data 2014 – 2018 and Forecast 2019 – 2029 by Size
Table 48: India Large Industrial Displays Market Value (US$ Mn) and Volume (Units) Historical Data 2014 – 2018 and Forecast 2019 – 2029 by End Use
Table 49: Brazil Large Industrial Displays Market Value (US$ Mn) and Volume (Units) Historical Data 2014 – 2018 and Forecast 2019 – 2029 by Product Type
Table 50: Brazil Large Industrial Displays Market Value (US$ Mn) and Volume (Units) Historical Data 2014 – 2018 and Forecast 2019 – 2029 by Technology
Table 51: Brazil Large Industrial Displays Market Value (US$ Mn) and Volume (Units) Historical Data 2014 – 2018 and Forecast 2019 – 2029 by Size
Table 52: Brazil Large Industrial Displays Market Value (US$ Mn) and Volume (Units) Historical Data 2014 – 2018 and Forecast 2019 – 2029 by End Use
Find your sweet spots for generating winning opportunities in this market.
Talk to AnalystList of Charts
Figure 01: Global Large Industrial Displays Market Historical Volume (Units), 2014 – 2018
Figure 02: Global Large Industrial Displays Market Volume (Units) Forecast, 2019 – 2029
Figure 03: Global Large Industrial Displays Market Pricing Analysis (Region Segment, USD per Unit, 2018)
Figure 04: Global Large Industrial Displays Market Historical Value (US$ Mn) & Y-o-Y Growth (%), 2014–2018
Figure 05: Global Large Industrial Displays Market Value (US$ Mn) Forecast & Y-o-Y Growth (%), 2019–2029
Figure 06: Global Large Industrial Displays Market Absolute $ Opportunity, 2014–2029
Figure 07: Global Large Industrial Displays Market Share and BPS Analysis by Product Type – 2019 & 2029
Figure 08: Global Large Industrial Displays Market Y-o-Y Growth Projections by Product Type, 2019-2029
Figure 09: Global Large Industrial Displays Market Attractiveness by Product Type, 2019-2029
Figure 10: Global Large Industrial Displays Market Absolute $ Opportunity by Open Frame Display Segment
Figure 11: Global Large Industrial Displays Market Absolute $ Opportunity by Panel Mount Display Segment
Figure 12: Global Large Industrial Displays Market Absolute $ Opportunity by Industrial Monitors Segment
Figure 13: Global Large Industrial Displays Market Absolute $ Opportunity by Video Walls Segment
Figure 14: Global Large Industrial Displays Market Share and BPS Analysis by Technology – 2019 & 2029
Figure 15: Global Large Industrial Displays Market Y-o-Y Growth Projections by Technology, 2019-2029
Figure 16: Global Large Industrial Displays Market Attractiveness by Technology, 2019-2029
Figure 17: Global Large Industrial Displays Market Absolute $ Opportunity by LCD Segment
Figure 18: Global Large Industrial Displays Market Absolute $ Opportunity by LED Segment
Figure 19: Global Large Industrial Displays Market Absolute $ Opportunity by OLED Segment
Figure 20: Global Large Industrial Displays Market Share and BPS Analysis by Size (Open Frame, Panel Mount and Industrial Monitors) – 2019 & 2029
Figure 21: Global Large Industrial Displays Market Y-o-Y Growth Projections by Size (Open Frame, Panel Mount and Industrial Monitors) , 2019-2029
Figure 22: Global Large Industrial Displays Market (Open Frame, Panel Mount and Industrial Monitors) Attractiveness by Size, 2019-2029
Figure 23: Global Large Industrial Displays Market Share and BPS Analysis by Size (Video Walls: Less than 6 screens and Above 6 screens)– 2019 & 2029
Figure 24: Global Large Industrial Displays Market (Video Walls: Less than 6 screens and Above 6 screens)– Y-o-Y Growth Projections by Size, 2019-2029
Figure 25: Global Large Industrial Displays Market (Video Walls: Less than 6 screens and Above 6 screens)– Attractiveness by Size, 2019-2029
Figure 26: Global Large Industrial Displays Market Absolute $ Opportunity by 20”-40” Size Segment
Figure 27: Global Large Industrial Displays Market Absolute $ Opportunity by Above 40” Size Segment
Figure 28: Global Large Industrial Displays Market Absolute $ Opportunity by Less than 6 Screens Size Segment
Figure 29: Global Large Industrial Displays Market Absolute $ Opportunity by Above 6 Screens Size Segment
Figure 30: Global Large Industrial Displays Market Share and BPS Analysis by End Use – 2019 & 2029
Figure 31: Global Large Industrial Displays Market Y-o-Y Growth Projections by End Use, 2019-2029
Figure 32: Global Large Industrial Displays Market Attractiveness by End Use, 2019-2029
Figure 33: Global Large Industrial Displays Market Absolute $ Opportunity by Discrete Manufacturing Industries Segment
Figure 34: Global Large Industrial Displays Market Absolute $ Opportunity by Process Manufacturing Industries Segment
Figure 35: Global Large Industrial Displays Market Share and BPS Analysis by Region – 2019 & 2029
Figure 36: Global Large Industrial Displays Market Y-o-Y Growth Projections by Region, 2019-2029
Figure 37: Global Large Industrial Displays Market Attractiveness by Region, 2019-2029
Figure 38: Global Large Industrial Displays Market Absolute $ Opportunity by North America Segment
Figure 39: Global Large Industrial Displays Market Absolute $ Opportunity by Latin America Segment
Figure 40: Global Large Industrial Displays Market Absolute $ Opportunity by Europe Segment
Figure 41: Global Large Industrial Displays Market Absolute $ Opportunity by South Asia Segment
Figure 42: Global Large Industrial Displays Market Absolute $ Opportunity by East Asia Segment
Figure 43: Global Large Industrial Displays Market Absolute $ Opportunity by Oceania Segment
Figure 44: Global Large Industrial Displays Market Absolute $ Opportunity by Middle East and Africa Segment
Figure 45: North America Large Industrial Displays Market Share and BPS Analysis by Product Type – 2019 & 2029
Figure 46: North America Large Industrial Displays Market Y-o-Y Growth Projections by Product Type, 2019-2029
Figure 47: North America Large Industrial Displays Market Attractiveness by Product Type, 2019-2029
Figure 48: North America Large Industrial Displays Market Share and BPS Analysis by Technology – 2019 & 2029
Figure 49: North America Large Industrial Displays Market Y-o-Y Growth Projections by Technology, 2019-2029
Figure 50: North America Large Industrial Displays Market Attractiveness by Technology, 2019-2029
Figure 51: North America Large Industrial Displays Market Share and BPS Analysis by Size (Open Frame, Panel Mount and Industrial Monitors) – 2019 & 2029
Figure 52: North America Large Industrial Displays Market Y-o-Y Growth Projections by Size (Open Frame, Panel Mount and Industrial Monitors) , 2019-2029
Figure 53: North America Large Industrial Displays Market (Open Frame, Panel Mount and Industrial Monitors) Attractiveness by Size, 2019-2029
Figure 54: North America Large Industrial Displays Market Share and BPS Analysis by Size (Video Walls: Less than 6 screens and Above 6 screens)– 2019 & 2029
Figure 55: North America Large Industrial Displays Market (Video Walls: Less than 6 screens and Above 6 screens)– Y-o-Y Growth Projections by Size, 2019-2029
Figure 56: North America Large Industrial Displays Market (Video Walls: Less than 6 screens and Above 6 screens)– Attractiveness by Size, 2019-2029
Figure 57: North America Large Industrial Displays Market Share and BPS Analysis by End Use – 2019 & 2029
Figure 58: North America Large Industrial Displays Market Y-o-Y Growth Projections by End Use, 2019-2029
Figure 59: North America Large Industrial Displays Market Attractiveness by End Use, 2019-2029
Figure 60: North America Large Industrial Displays Market Share and BPS Analysis
Figure 61: North America Large Industrial Displays Market Y-o-Y Growth Projections
Figure 62: North America Large Industrial Displays Market Attractiveness by Country, 2019-2029
Figure 63: The U.S. Large Industrial Displays Market Absolute $ Opportunity
Figure 64: Canada Large Industrial Displays Market Absolute $ Opportunity
Figure 65: Latin America Large Industrial Displays Market Share and BPS Analysis by Product Type – 2019 & 2029
Figure 66: Latin America Large Industrial Displays Market Y-o-Y Growth Projections by Product Type, 2019-2029
Figure 67: Latin America Large Industrial Displays Market Attractiveness by Product Type, 2019-2029
Figure 68: Latin America Large Industrial Displays Market Share and BPS Analysis by Technology – 2019 & 2029
Figure 69: Latin America Large Industrial Displays Market Y-o-Y Growth Projections by Technology, 2019-2029
Figure 70: Latin America Large Industrial Displays Market Attractiveness by Technology, 2019-2029
Figure 71: Latin America Large Industrial Displays Market Share and BPS Analysis by Size (Open Frame, Panel Mount and Industrial Monitors) – 2019 & 2029
Figure 72: Latin America Large Industrial Displays Market Y-o-Y Growth Projections by Size (Open Frame, Panel Mount and Industrial Monitors) , 2019-2029
Figure 73: Latin America Large Industrial Displays Market (Open Frame, Panel Mount and Industrial Monitors) Attractiveness by Size, 2019-2029
Figure 74: Latin America Large Industrial Displays Market Share and BPS Analysis by Size (Video Walls: Less than 6 screens and Above 6 screens)– 2019 & 2029
Figure 75: Latin America Large Industrial Displays Market (Video Walls: Less than 6 screens and Above 6 screens)– Y-o-Y Growth Projections by Size, 2019-2029
Figure 76: Latin America Large Industrial Displays Market (Video Walls: Less than 6 screens and Above 6 screens)– Attractiveness by Size, 2019-2029
Figure 77: Latin America Large Industrial Displays Market Share and BPS Analysis by End Use – 2019 & 2029
Figure 78: Latin America Large Industrial Displays Market Y-o-Y Growth Projections by End Use, 2019-2029
Figure 79: Latin America Large Industrial Displays Market Attractiveness by End Use, 2019-2029
Figure 80: Latin America Large Industrial Displays Market Share and BPS Analysis
Figure 81: Latin America Large Industrial Displays Market Y-o-Y Growth Projections
Figure 82: Latin America Large Industrial Displays Market Attractiveness by Country, 2019-2029
Figure 83: Brazil Large Industrial Displays Market Absolute $ Opportunity
Figure 84: Mexico Large Industrial Displays Market Absolute $ Opportunity
Figure 85: Rest of Latin America Large Industrial Displays Market Absolute $ Opportunity
Figure 86: Europe Large Industrial Displays Market Share and BPS Analysis by Product Type – 2019 & 2029
Figure 87: Europe Large Industrial Displays Market Y-o-Y Growth Projections by Product Type, 2019-2029
Figure 88: Europe Large Industrial Displays Market Attractiveness by Product Type, 2019-2029
Figure 89: Europe Large Industrial Displays Market Share and BPS Analysis by Technology – 2019 & 2029
Figure 90: Europe Large Industrial Displays Market Y-o-Y Growth Projections by Technology, 2019-2029
Figure 91: Europe Large Industrial Displays Market Attractiveness by Technology, 2019-2029
Figure 92: Europe Large Industrial Displays Market Share and BPS Analysis by Size (Open Frame, Panel Mount and Industrial Monitors) – 2019 & 2029
Figure 93: Europe Large Industrial Displays Market Y-o-Y Growth Projections by Size (Open Frame, Panel Mount and Industrial Monitors) , 2019-2029
Figure 94: Europe Large Industrial Displays Market (Open Frame, Panel Mount and Industrial Monitors) Attractiveness by Size, 2019-2029
Figure 95: Europe Large Industrial Displays Market Share and BPS Analysis by Size (Video Walls: Less than 6 screens and Above 6 screens)– 2019 & 2029
Figure 96: Europe Large Industrial Displays Market (Video Walls: Less than 6 screens and Above 6 screens)– Y-o-Y Growth Projections by Size, 2019-2029
Figure 97: Europe Large Industrial Displays Market (Video Walls: Less than 6 screens and Above 6 screens)– Attractiveness by Size, 2019-2029
Figure 98: Europe Large Industrial Displays Market Share and BPS Analysis by End Use – 2019 & 2029
Figure 99: Europe Large Industrial Displays Market Y-o-Y Growth Projections by End Use, 2019-2029
Figure 100: Europe Large Industrial Displays Market Attractiveness by End Use, 2019-2029
Figure 101: Europe Large Industrial Displays Market Share and BPS Analysis
Figure 102: Europe Large Industrial Displays Market Y-o-Y Growth Projections
Figure 103: Europe Large Industrial Displays Market Attractiveness by Country, 2019-2029
Figure 104: Germany Large Industrial Displays Market Absolute $ Opportunity
Figure 105: Italy Large Industrial Displays Market Absolute $ Opportunity
Figure 106: France Large Industrial Displays Market Absolute $ Opportunity
Figure 107: U.K. Large Industrial Displays Market Absolute $ Opportunity
Figure 108: Spain Large Industrial Displays Market Absolute $ Opportunity
Figure 109: BENELUX Large Industrial Displays Market Absolute $ Opportunity
Figure 110: Russia Large Industrial Displays Market Absolute $ Opportunity
Figure 111: Rest of Europe Large Industrial Displays Market Absolute $ Opportunity
Figure 112: South Asia Large Industrial Displays Market Share and BPS Analysis by Product Type – 2019 & 2029
Figure 113: South Asia Large Industrial Displays Market Y-o-Y Growth Projections by Product Type, 2019-2029
Figure 114: South Asia Large Industrial Displays Market Attractiveness by Product Type, 2019-2029
Figure 115: South Asia Large Industrial Displays Market Share and BPS Analysis by Technology – 2019 & 2029
Figure 116: South Asia Large Industrial Displays Market Y-o-Y Growth Projections by Technology, 2019-2029
Figure 117: South Asia Large Industrial Displays Market Attractiveness by Technology, 2019-2029
Figure 118: South Asia Large Industrial Displays Market Share and BPS Analysis by Size (Open Frame, Panel Mount and Industrial Monitors) – 2019 & 2029
Figure 119: South Asia Large Industrial Displays Market Y-o-Y Growth Projections by Size (Open Frame, Panel Mount and Industrial Monitors) , 2019-2029
Figure 120: South Asia Large Industrial Displays Market (Open Frame, Panel Mount and Industrial Monitors) Attractiveness by Size, 2019-2029
Figure 121: South Asia Large Industrial Displays Market Share and BPS Analysis by Size (Video Walls: Less than 6 screens and Above 6 screens)– 2019 & 2029
Figure 122: South Asia Large Industrial Displays Market (Video Walls: Less than 6 screens and Above 6 screens)– Y-o-Y Growth Projections by Size, 2019-2029
Figure 123: South Asia Large Industrial Displays Market (Video Walls: Less than 6 screens and Above 6 screens)– Attractiveness by Size, 2019-2029
Figure 124: South Asia Large Industrial Displays Market Share and BPS Analysis by End Use – 2019 & 2029
Figure 125: South Asia Large Industrial Displays Market Y-o-Y Growth Projections by End Use, 2019-2029
Figure 126: South Asia Large Industrial Displays Market Attractiveness by End Use, 2019-2029
Figure 127: South Asia Large Industrial Displays Market Share and BPS Analysis
Figure 128: South Asia Large Industrial Displays Market Y-o-Y Growth Projections
Figure 129: South Asia Large Industrial Displays Market Attractiveness by Country, 2019-2029
Figure 130: India Large Industrial Displays Market Absolute $ Opportunity
Figure 131: Thailand Large Industrial Displays Market Absolute $ Opportunity
Figure 132: Indonesia Large Industrial Displays Market Absolute $ Opportunity
Figure 133: Malaysia Large Industrial Displays Market Absolute $ Opportunity
Figure 134: Philippines Large Industrial Displays Market Absolute $ Opportunity
Figure 135: Rest of South Asia Large Industrial Displays Market Absolute $ Opportunity
Figure 136: East Asia Large Industrial Displays Market Share and BPS Analysis by Product Type – 2019 & 2029
Figure 137: East Asia Large Industrial Displays Market Y-o-Y Growth Projections by Product Type, 2019-2029
Figure 138: East Asia Large Industrial Displays Market Attractiveness by Product Type, 2019-2029
Figure 139: East Asia Large Industrial Displays Market Share and BPS Analysis by Technology – 2019 & 2029
Figure 140: East Asia Large Industrial Displays Market Y-o-Y Growth Projections by Technology, 2019-2029
Figure 141: East Asia Large Industrial Displays Market Attractiveness by Technology, 2019-2029
Figure 142: East Asia Large Industrial Displays Market Share and BPS Analysis by Size (Open Frame, Panel Mount and Industrial Monitors) – 2019 & 2029
Figure 143: East Asia Large Industrial Displays Market Y-o-Y Growth Projections by Size (Open Frame, Panel Mount and Industrial Monitors) , 2019-2029
Figure 144: East Asia Large Industrial Displays Market (Open Frame, Panel Mount and Industrial Monitors) Attractiveness by Size, 2019-2029
Figure 145: East Asia Large Industrial Displays Market Share and BPS Analysis by Size (Video Walls: Less than 6 screens and Above 6 screens)– 2019 & 2029
Figure 146: East Asia Large Industrial Displays Market (Video Walls: Less than 6 screens and Above 6 screens)– Y-o-Y Growth Projections by Size, 2019-2029
Figure 147: East Asia Large Industrial Displays Market (Video Walls: Less than 6 screens and Above 6 screens)– Attractiveness by Size, 2019-2029
Figure 148: East Asia Large Industrial Displays Market Share and BPS Analysis by End Use – 2019 & 2029
Figure 149: East Asia Large Industrial Displays Market Y-o-Y Growth Projections by End Use, 2019-2029
Figure 150: East Asia Large Industrial Displays Market Attractiveness by End Use, 2019-2029
Figure 151: East Asia Large Industrial Displays Market Share and BPS Analysis
Figure 152: East Asia Large Industrial Displays Market Y-o-Y Growth Projections
Figure 153: East Asia Large Industrial Displays Market Attractiveness by Country, 2019-2029
Figure 154: China Large Industrial Displays Market Absolute $ Opportunity
Figure 155: Japan Large Industrial Displays Market Absolute $ Opportunity
Figure 156: South Korea Large Industrial Displays Market Absolute $ Opportunity
Figure 157: Oceania Large Industrial Displays Market Share and BPS Analysis by Product Type – 2019 & 2029
Figure 158: Oceania Large Industrial Displays Market Y-o-Y Growth Projections by Product Type, 2019-2029
Figure 159: Oceania Large Industrial Displays Market Attractiveness by Product Type, 2019-2029
Figure 160: Oceania Large Industrial Displays Market Share and BPS Analysis by Technology – 2019 & 2029
Figure 161: Oceania Large Industrial Displays Market Y-o-Y Growth Projections by Technology, 2019-2029
Figure 162: Oceania Large Industrial Displays Market Attractiveness by Technology, 2019-2029
Figure 163: Oceania Large Industrial Displays Market Share and BPS Analysis by Size (Open Frame, Panel Mount and Industrial Monitors) – 2019 & 2029
Figure 164: Oceania Large Industrial Displays Market Y-o-Y Growth Projections by Size (Open Frame, Panel Mount and Industrial Monitors) , 2019-2029
Figure 165: Oceania Large Industrial Displays Market (Open Frame, Panel Mount and Industrial Monitors) Attractiveness by Size, 2019-2029
Figure 166: Oceania Large Industrial Displays Market Share and BPS Analysis by Size (Video Walls: Less than 6 screens and Above 6 screens)– 2019 & 2029
Figure 167: Oceania Large Industrial Displays Market (Video Walls: Less than 6 screens and Above 6 screens)– Y-o-Y Growth Projections by Size, 2019-2029
Figure 168: Oceania Large Industrial Displays Market (Video Walls: Less than 6 screens and Above 6 screens)– Attractiveness by Size, 2019-2029
Figure 169: Oceania Large Industrial Displays Market Share and BPS Analysis by End Use – 2019 & 2029
Figure 170: Oceania Large Industrial Displays Market Y-o-Y Growth Projections by End Use, 2019-2029
Figure 171: Oceania Large Industrial Displays Market Attractiveness by End Use, 2019-2029
Figure 172: Oceania Large Industrial Displays Market Share and BPS Analysis
Figure 173: Oceania Large Industrial Displays Market Y-o-Y Growth Projections
Figure 174: Oceania Large Industrial Displays Market Attractiveness by Country, 2019-2029
Figure 175: Australia Large Industrial Displays Market Absolute $ Opportunity
Figure 176: New Zealand Large Industrial Displays Market Absolute $ Opportunity
Figure 177: Middle East and Africa Large Industrial Displays Market Share and BPS Analysis by Product Type – 2019 & 2029
Figure 178: Middle East and Africa Large Industrial Displays Market Y-o-Y Growth Projections by Product Type, 2019-2029
Figure 179: Middle East and Africa Large Industrial Displays Market Attractiveness by Product Type, 2019-2029
Figure 180: Middle East and Africa Large Industrial Displays Market Share and BPS Analysis by Technology – 2019 & 2029
Figure 181: Middle East and Africa Large Industrial Displays Market Y-o-Y Growth Projections by Technology, 2019-2029
Figure 182: Middle East and Africa Large Industrial Displays Market Attractiveness by Technology, 2019-2029
Figure 183: MEA Large Industrial Displays Market Share and BPS Analysis by Size (Open Frame, Panel Mount and Industrial Monitors) – 2019 & 2029
Figure 184: MEA Large Industrial Displays Market Y-o-Y Growth Projections by Size (Open Frame, Panel Mount and Industrial Monitors) , 2019-2029
Figure 185: MEA Large Industrial Displays Market (Open Frame, Panel Mount and Industrial Monitors) Attractiveness by Size, 2019-2029
Figure 186: MEA Large Industrial Displays Market Share and BPS Analysis by Size (Video Walls: Less than 6 screens and Above 6 screens)– 2019 & 2029
Figure 187: MEA Large Industrial Displays Market (Video Walls: Less than 6 screens and Above 6 screens)– Y-o-Y Growth Projections by Size, 2019-2029
Figure 188: MEA Large Industrial Displays Market (Video Walls: Less than 6 screens and Above 6 screens)– Attractiveness by Size, 2019-2029
Figure 189: Middle East and Africa Large Industrial Displays Market Share and BPS Analysis by End Use – 2019 & 2029
Figure 190: Middle East and Africa Large Industrial Displays Market Y-o-Y Growth Projections by End Use, 2019-2029
Figure 191: Middle East and Africa Large Industrial Displays Market Attractiveness by End Use, 2019-2029
Figure 192: Middle East and Africa Large Industrial Displays Market Share and BPS Analysis by Country – 2019 & 2029
Figure 193: Middle East and Africa Large Industrial Displays Market Y-o-Y Growth Projections by Country, 2019-2029
Figure 194: Middle East and Africa Large Industrial Displays Market Attractiveness by Country, 2019-2029
Figure 195: Iran Large Industrial Displays Market Absolute $ Opportunity
Figure 196: Turkey Large Industrial Displays Market Absolute $ Opportunity
Figure 197: South Africa Large Industrial Displays Market Absolute $ Opportunity
Figure 198: Rest of Middle East and Africa Large Industrial Displays Market Absolute $ Opportunity
Figure 199: Emerging Markets Large Industrial Displays Market Share by Country, 2019E
Figure 201: Global & Emerging Countries Large Industrial Displays Market Y-o-Y Growth Projections, 2019-2029
Figure 200: Global Large Industrial Displays Market Share by Region, 2019E
Figure 202: Global & Emerging Countries Market Share and BPS Analysis – 2019 & 2029
Need specific information?
Request CustomizationExplore Industrial Automation Insights
View Reports