The global contrast media injectors market is poised for steady expansion, with revenues expected to increase from approximately USD 5.2 billion in 2025 to nearly USD 9.3 billion by 2035, growing at a consistent CAGR of 6.0%. This growth is primarily driven by the rising demand for advanced diagnostic imaging procedures, which have become essential tools in the detection and management of chronic diseases worldwide.
The increasing prevalence of conditions such as cardiovascular diseases, cancers, and neurological disorders has significantly fueled the need for precise and reliable imaging technologies. Contrast media injectors serve a critical function in these procedures by delivering controlled doses of contrast agents that enhance image clarity and diagnostic accuracy, particularly in CT scans and angiographic examinations.
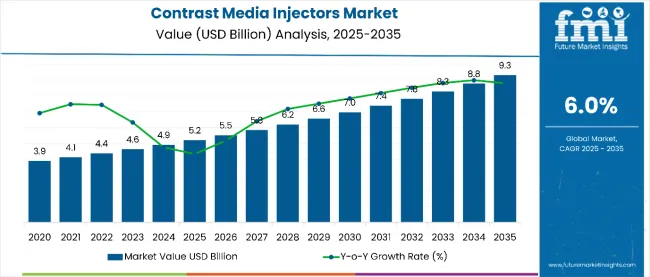
| Attributes | Key Insights |
|---|---|
| Historical Size, 2024 | USD 4.9 billion |
| Estimated Size, 2025 | USD 5.2 billion |
| Projected Size, 2035 | USD 9.3 billion |
| Value-based CAGR (2025 to 2035) | 6.0% |
Recent technological advancements have significantly improved the capabilities of contrast media injectors. Features such as automated injection protocols and real-time patient monitoring have increased procedural efficiency while enhancing patient safety.
These innovations allow healthcare professionals to administer contrast media with greater precision and consistency, minimizing risks and improving overall outcomes. Notably, in early 2025, a leading medical device manufacturer launched an AI-integrated contrast media injector system that optimizes dosage and monitors patient vitals simultaneously, representing a significant step toward smarter diagnostic tools.
Strategic collaborations among key market players are also accelerating product development and technological enhancements. Leading manufacturers are partnering with research institutions and technology firms to introduce next-generation devices that address the evolving needs of healthcare providers.
Additionally, global healthcare systems are investing heavily in upgrading diagnostic infrastructure, particularly in emerging economies where access to advanced imaging technology is rapidly improving. This expansion of healthcare infrastructure supports wider adoption of contrast media injectors across diverse geographies.
Despite the optimistic outlook, the market faces challenges including the high cost of advanced equipment and stringent regulatory requirements governing medical device approval and usage. These factors can delay product launches and limit accessibility, especially in lower-income regions. However, continuous research and development efforts, alongside growing healthcare investments, are anticipated to mitigate these barriers.
In summary, the contrast media injectors market is set to experience sustained growth over the next decade, driven by technological innovation, expanding healthcare infrastructure, and increasing demand for accurate and safe diagnostic imaging solutions.
The adoption of contrast media injectors is being shaped by published clinical outcomes and real-world performance data, especially in health systems driven by evidence-based procurement. Hospitals and diagnostic centers are increasingly favoring injector systems that show improvements in imaging precision, patient safety, and workflow reliability.
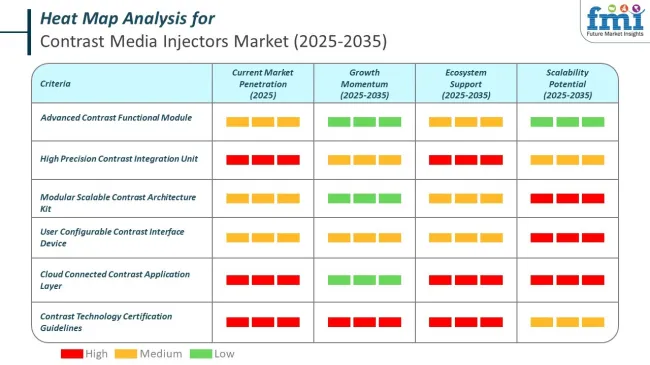
Regulation of contrast media injectors centers on ensuring safety, performance, and consistent quality throughout their lifecycle. Authorities classify devices by risk, require evidence before market entry, oversee manufacturing practices, and mandate tracking and reporting of problems after deployment. Regional bodies also enforce local registration and adapt global standards to national contexts, while encouraging convergence to simplify multi-country launches. Oversight extends to clinical use protocols, supply chain integrity, and transparency in upgrades and recalls, all of which directly influence procurement timing and vendor selection.
The table below compares the Compound Annual Growth Rate (CAGR) for the global contrast media injectors market from 2024 to 2025 during the first half of the year. This overview highlights key changes and trends in revenue growth, offering valuable insights into market dynamics. H1 covers January to June, while H2 spans July to December.
In the first half (H1) of the decade from 2024 to 2034, the business is predicted to surge at a CAGR of 6.6%, followed by a slightly decline in growth rate of 6.3% in the second half (H2) of the same decade.
| Particular | Value CAGR |
|---|---|
| H1 | 6.6% (2024 to 2034) |
| H2 | 6.3% (2024 to 2034) |
| H1 | 6% (2025 to 2035) |
| H2 | 5.4% (2025 to 2035) |
Moving into the subsequent period, from H1 2025 to H2 2035, the CAGR is projected to increase slightly to 6% in the first half and remain relatively moderate at 5.4% in the second half. In the first half (H1) the market witnessed a decrease of 70 BPS while in the second half (H2), the market witnessed a decrease of 90 BPS.
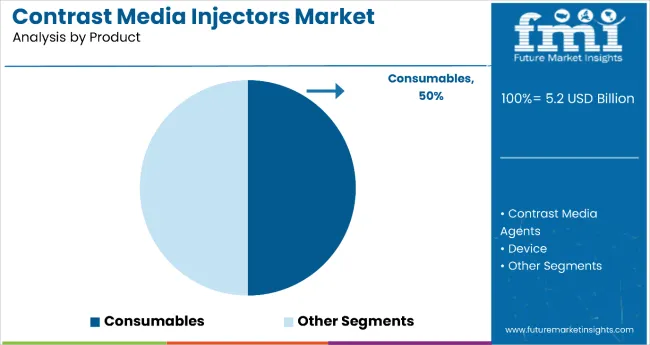
In terms of product, consumables segment accounts for 50% share. Contrast media consumables are widely used because they are essential components for safely and effectively administering contrast agents during imaging procedures.
These consumables include items like syringes, tubing, connectors, and patient-specific disposables, all designed to maintain sterility and ensure precise delivery. They help prevent cross-contamination between patients, supporting infection control practices.
Consumables are also tailored for compatibility with different imaging systems and injector types, ensuring consistent flow rates and accurate dosing. Their single-use nature enhances patient safety and meets regulatory standards.
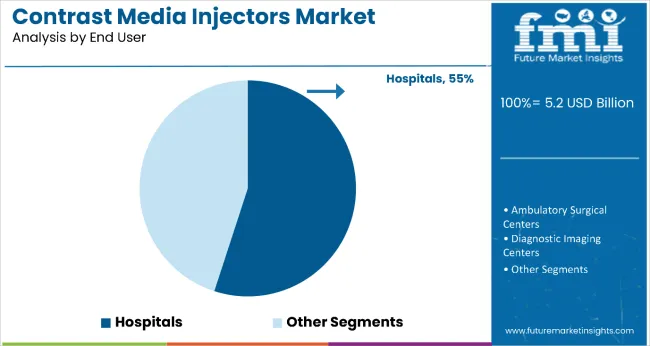
In terms of end user, the hospitals segment registers 55% share. Contrast media injectors are widely used in hospitals to enhance the accuracy and efficiency of diagnostic imaging procedures such as CT scans, MRIs, and angiographies. T
hese devices deliver contrast agents in controlled volumes and flow rates, improving the visibility of internal structures like blood vessels, organs, and tissues. This leads to more accurate and timely diagnoses of conditions such as tumors, blood clots, and vascular diseases.
Automated injectors also improve workflow in radiology departments by reducing manual errors and saving time. Additionally, they ensure patient safety by allowing dose adjustments based on individual characteristics.
The advantage provided by contrast media injectors such as improved precision in the delivery of contrast agents, and its variable use in different procedures has significantly contributed to its increased adoption in the healthcare facilities.
Growing emphasis of manufacturers towards including technological advancements such as inclusion of automation features which ensures accurate control over rates and volumes of injection during procedures further augments the market growth.
The major aim of manufacturers to advance and integrate technological advancements to these injectors is to strengthen their market position. In addition, manufacturers are also emphasizing on integrating these technologies into image acquisition systems like CT and MRI with an aim of further improving the workflow efficiency of the healthcare facilities.
In addition to this, inclusion of integration of increased safety features, such as real-time monitoring and automated warnings of adverse reactions at the time of injections, improve care quality and patient safety. The integration of user-friendly interfaces with programmable settings empowers more access to injectors by health professionals and thus ease of use and efficient operation in clinical settings.
Therefore, the continuous and growing emphasis of manufacturers on constantly evolving their products by integration of technologically advanced system is anticipating the growth of the market.
In recent past, there has been a significant increase in the prevalence of coronary artery diseases and stroke among young adults and baby boomers. With age, the risk of coronary artery as well as peripheral artery disease increases and adults over 60 years become more susceptible to cardiovascular risk.
This age group represents a cumulative prevalence of around 15%. This constant rise in the number of cardiac cases has led to increase demand for cardiovascular imaging.
Contrast media injectors are integral part of cardiovascular imaging as these devices have accurate, high-precision delivery of contrast agents in imaging procedures such as cardiac - CT magnetic resonance imaging angiography, and cardiac catheterization. These contrast agents act as a medium in visualization of blood vessels and cardiac structure to determine the severity of diseases for proper treatment strategies.
Other important factors driving the demand for advanced contrast media injectors include incessant technological advancements in imaging modalities. These devices are increasingly being integrated into the imaging systems so as to ensure optimal image quality, workflow efficiency, and patient safety. Therefore, the growing focus of healthcare systems on the early diagnosis and management of CVDs further fuels the market for contrast media injectors.
Growing emphasis of contrast media injector manufacturers on making strategic collaborations for leveraging the competitor company’s capability in research and development, technological innovation, and market access to sustain and increase market leadership is augmenting the growth of the market.
Majority of the strategic collaborations are aimed towards pooling their resources and competencies. The collaborations also aid manufacturers to accelerate and advance their injector technologies that may help healthcare providers and patients to meet changing requirements. These collaborations also aid manufacturer in integrating advanced features such as automation, advanced imaging capabilities, and more advanced patient safety features into new product offerings.
Increase in number of players focusing on introducing their products to the new market has created a sense of competitiveness among existing market players. Therefore, in order to stay ahead of the competition and strengthen their position in the new and existing market many of the key manufacturers are collaborating among themselves.
For instance, in November 2023, Bracco, a diagnostic imaging company collaborated with Ulrich GmbH & Co. KG, a medical device manufacturer in Germany. These strategic collaboration is aimed to o introduce this contrast media injector to the USA market and strengthen their market position.
Therefore, the growing emphasis of contrast media injector manufacturers on making strategic collaborations for strengthening their existing market position by enhancing innovation, expanding their product outreach, and improve overall operational efficiency is driving the growth of the contrast media injectors market.
The integration of contrast media injectors with hospital information systems allows healthcare facilities to maintain coherent data and maximizes clinical decision support. This integration supports health professionals to collect all relevant patient information, and make the best possible treatment plan for patients.
With the present tendency of upgrading imaging capabilities in healthcare facilities and a shift in focus toward advanced diagnostic techniques, the demand for sophisticated contrast media injectors is also on the rise to improve the patient outcome and operational efficiencies in modern healthcare facilities.
These factors are encouraging hospitals to make heavy investments state-of-the-art imaging technologies such as high-resolution computed tomography, magnetic resonance imaging, or angiography systems requiring minute administrations of special contrast agents is primarily attributing to the growth of the market.
These investments are made to enhance the quality of anatomical structures and pathological conditions for the clinician to make an informed decision on patient care.
The other factors for these heavy investment is to boost the operational efficiency and workflow of the patients without compromising on their safety. Therefore, the rise in demand for contrast media injectors from the new age healthcare industry is further attributing to the growth of the market.
The global contrast media injectors cover industry recorded a CAGR of 3.5% during the historical period between 2020 and 2024. The growth of contrast media injectors cover industry was positive as it reached a value of USD 4.9 billion in 2024 from 3,956.2 million in 2020.
Among the various influences, the increasing burden of chronic diseases, such as cardiovascular diseases, cancer, and nephrological disorders, increases the requirement for frequent and accurate diagnosis by imaging. Contrast media injectors are of immense importance in enhancing the visibility of anatomical structures and abnormalities in an imaging procedure such as CT scans, MRI scans, or angiography for the precise diagnosis and treatment of the disease.
Innovations and technological developments associated with imaging modalities and injectors such as automation features for accurate delivery of contrast agents, contributes to the growth of the market. This features are integrated with the imaging systems to improve workflow efficiency, and reduce possible risk during procedures.
Moreover, demographic trends, such as ageing populations, and growing healthcare infrastructure in the developing countries of emerging regions further augments the growth of the market. Investments in healthcare facilities and regulatory requirements that put a light on the safety and quality standard for patients also contributes to the growth expansion in this market.
Therefore, the trends in healthcare systems across the world working toward better patient outcomes and cost-efficient delivery of care, augments the growing demand for contrast media injectors.
Tier 1 companies comprise market leaders with a market revenue of above USD 100 million capturing significant market share of 15% to 20% in global market. These market leaders are characterized by high production capacity, wide product portfolio, and range of services in the market.
These market leaders are differentiating themselves from the market based on the technology, extensive expertise in manufacturing and broad geographical outreach reach in the market. These factors have aided them in serving a wide range of consumer base. Prominent companies within tier 1 include Mallinckrodt (Guerbet SA), GE Healthcare, Bayer AG, Ulrich GmbH & Co. KG, Bracco Imaging S.p.A
Tier 2 companies include mid-size players with revenue of USD 50 to 100 million having presence in specific regions with their high influence on the local market. These are characterized by a strong presence overseas and strong market knowledge. These market players have good technology and ensure regulatory compliance but may be limited to their availability in certain markets. Prominent companies in tier 2 include NemotoKyorindo Co. Ltd and Shenzhen Anke High-tech Co. Ltd;
Tier 3 includes the majority of companies that have limited geographical outreach or are operating at the local presence and serving niche markets having revenue below USD 50 million. These companies are focused towards fulfilling the demand from local market and are therefore classified as the tier 3 share segment.
They are comparatively small-scale players and are recognized as an unorganized market, which doesn’t have extensive infrastructure structure or higher production capabilities.
The section below covers the industry analysis for the contrast media injectors cover market for different countries. Market demand analysis on key countries in several regions of the globe, including North America, Asia Pacific, Europe, and others, is provided. The United States is anticipated to remain at the forefront in North America, and is projected to grow at a CAGR of 4.9% through 2035. In Asia Pacific, India is projected to witness a CAGR of 10% by 2035.
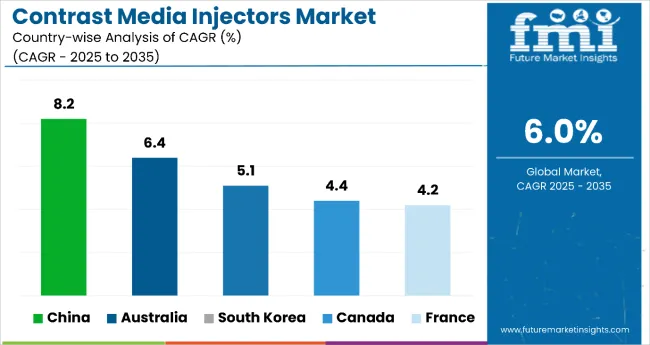
| Countries | Value CAGR (2025 to 2035) |
|---|---|
| Canada | 4.4% |
| Spain | 3.3% |
| France | 4.2% |
| South Korea | 5.1% |
| China | 8.2% |
| Australia | 6.4% |
Germany’s contrast media injectors cover market is poised to exhibit a CAGR of 4.9% between 2025 and 2035. The market for contrast media injectors market is expanding in countries like Germany, due to innovations in medical imaging technologies like CT and MRI that require advanced, sophisticated injectors propagating diagnostic accuracy.
Contrast media injectors plays an essential role in radiology. It enhances the visibility of internal body structures in imaging techniques like CT scans and MRIs. Growing expenditure on healthcare infrastructure supports the adoption of such devices. In addition, the rising incidence of chronic diseases, increase in aging population, drives demand for diagnostic imaging.
Manufacturers are responding to this demand by developing sophisticated contrast media injectors that offer improved automation, which has significantly contributed to its adoption in the market. Additionally, competitive dynamics and a focus on minimally invasive procedures are increasing the application of contrast media injectors among German healthcare facilities.
North America, spearheaded by the USA currently holds majority of the share of the global contrast media injectors cover industry. The market in the USA is anticipated to grow at a CAGR of 1.2% throughout the forecast period 2035.
Growing advances in the medical imaging devices such as, CT and MRI, with higher-end injectors for improving imaging quality, and the growing prevalence of chronic diseases that requires repeated diagnosis pantomimes, are few of the factors that are contributing to the growth of the market.
Moreover, the growing aging population and the existence of government healthcare policies with strong reimbursement systems for advanced medical equipment augments its further growth in the market. These policies covers wide range of imaging procedures which includes contrast media injectors.
In addition to this, the growing emphasis of manufacturers on expansion of product portfolio by launching new products to the USA market further propels the growth of the market.
Multidimensional growth in healthcare infrastructure of the country, coupled with growing investment in the installation of advanced medical technologies significantly contributes to the growth of contrast media injectors in the Chinese market.
China has witnessed significant investment in modernization of its healthcare facilities, owing to which it has experienced expansion in its quality of medical facilities across country. These modernization includes adoption of diagnostic imaging technologies such as CT scans and MRI machines which rely heavily on contrast media injectors for their image clarity.
Furthermore, the growing ageing population suffering from chronic diseases further anticipates the rise in demand for contrast media injectors in hospitals and diagnostic centers which aid in accurate and effective diagnosis and treatment of the diseases.
Moreover, the support extended by government and healthcare reform organizations for improving the accessibility and quality of healthcare to the growing population of the country further augments the growth of the market.
Key players operating in the contrast media injectors cover market are investing in development of advanced and innovative products that are more reliable and efficient. Also, many of the key players are emphasizing on making strategic collaborations and acquisition for expansion of their geographical presence and strengthening their market share.
| Report Attributes | Details |
|---|---|
| Current Total Market Size (2025) | USD 5.2 billion |
| Projected Market Size (2035) | USD 9.3 billion |
| CAGR (2025 to 2035) | 6.0% |
| Base Year for Estimation | 2024 |
| Historical Period | 2020 to 2024 |
| Projections Period | 2025 to 2035 |
| Quantitative Units | USD billion for value |
| Product Types Analyzed (Segment 1) | Devices (CT, MRI, Angiography, PET Injectors), Contrast Media Agents (Gadolinium, Iodine-based, Barium-based), Consumables (Contrast Syringes, Transfer Sets), Tube Systems, Others |
| Applications Covered (Segment 2) | Neurology, Cardiology, Oncology, Gastrointestinal, Others |
| End Users Covered (Segment 3) | Hospitals, Ambulatory Surgical Centers, Diagnostic Imaging Centers, Cancer Research Institutes, Cardiac Catheterization Labs |
| Regions Covered | North America; Latin America; Western Europe; Eastern Europe; East Asia; South Asia & Pacific; Middle East & Africa |
| Countries Covered | United States, Germany, France, United Kingdom, China, India, Japan, South Korea, Brazil, Canada |
| Key Players Influencing the Market | Mallinckrodt, GE Healthcare, Bayer AG, Ulrich GmbH & Co. KG, Bracco Imaging, Medtron, Nemoto Kyorindo, Shenzhen Anke High-tech, Sino Medical-Device Technology, APOLLO RT |
| Additional Attributes | Dollar sales by product and application, advances in AI and automation, growing neurology diagnostic demand, regulatory impacts on device safety and efficacy, regional adoption trends |
| Customization and Pricing | Customization and Pricing Available on Request |
In terms of product, the industry is divided into device (CT injector, MRI injector, angiography injector, PET injector), contrast media agents (gadolinium based, iodine based [iconic-water soluble agents, non-iconic water soluble agents], barium based), consumables (contrast syringes [CT contrast syringes, MR contrast syringes, angio/interventional syringes, syringes]), {contrast transfer sets [low pressure valve transfer sets, high pressure valve transfer sets]), tube systems ( single head tube system with drip chamber, double head tube system with drip chamber), and others
In terms of application, the industry is divided into cardiology, oncology, neurology, gastrointestinal and others
In terms of end user, the industry is segregated into hospitals, ambulatory surgical centers, diagnostic imaging centers, cancer research institutes and cardiac catheterization labs
Key countries of North America, Latin America, Western Europe, Eastern Europe, East Asia, South Asia & Pacific, and Middle East and Africa (MEA), have been covered in the report.
The global contrast media injectors cover industry is projected to witness CAGR of 6.0% between 2025 and 2035.
The global contrast media injectors cover industry stood at USD 5.2 billion.
The global contrast media injectors cover industry is anticipated to reach USD 9.3 billion by 2035 end.
India is set to record the highest CAGR of 10% in the assessment period.
The key players operating in the global contrast media injectors cover industry include GE Healthcare, Bayer AG, Ulrich GmbH & Co. KG and Mallinckrodt are few of the key players in the contrast media injectors cover industry.


Our Research Products

The "Full Research Suite" delivers actionable market intel, deep dives on markets or technologies, so clients act faster, cut risk, and unlock growth.

The Leaderboard benchmarks and ranks top vendors, classifying them as Established Leaders, Leading Challengers, or Disruptors & Challengers.

Locates where complements amplify value and substitutes erode it, forecasting net impact by horizon

We deliver granular, decision-grade intel: market sizing, 5-year forecasts, pricing, adoption, usage, revenue, and operational KPIs—plus competitor tracking, regulation, and value chains—across 60 countries broadly.

Spot the shifts before they hit your P&L. We track inflection points, adoption curves, pricing moves, and ecosystem plays to show where demand is heading, why it is changing, and what to do next across high-growth markets and disruptive tech

Real-time reads of user behavior. We track shifting priorities, perceptions of today’s and next-gen services, and provider experience, then pace how fast tech moves from trial to adoption, blending buyer, consumer, and channel inputs with social signals (#WhySwitch, #UX).

Partner with our analyst team to build a custom report designed around your business priorities. From analysing market trends to assessing competitors or crafting bespoke datasets, we tailor insights to your needs.
Supplier Intelligence
Discovery & Profiling
Capacity & Footprint
Performance & Risk
Compliance & Governance
Commercial Readiness
Who Supplies Whom
Scorecards & Shortlists
Playbooks & Docs
Category Intelligence
Definition & Scope
Demand & Use Cases
Cost Drivers
Market Structure
Supply Chain Map
Trade & Policy
Operating Norms
Deliverables
Buyer Intelligence
Account Basics
Spend & Scope
Procurement Model
Vendor Requirements
Terms & Policies
Entry Strategy
Pain Points & Triggers
Outputs
Pricing Analysis
Benchmarks
Trends
Should-Cost
Indexation
Landed Cost
Commercial Terms
Deliverables
Brand Analysis
Positioning & Value Prop
Share & Presence
Customer Evidence
Go-to-Market
Digital & Reputation
Compliance & Trust
KPIs & Gaps
Outputs
Full Research Suite comprises of:
Market outlook & trends analysis
Interviews & case studies
Strategic recommendations
Vendor profiles & capabilities analysis
5-year forecasts
8 regions and 60+ country-level data splits
Market segment data splits
12 months of continuous data updates
DELIVERED AS:
PDF EXCEL ONLINE
Contrast-Enhanced Ultrasound Market Growth – Trends & Forecast 2025 to 2035
Contrast Injection Lines Market
Non-Contrast CT Imaging Market Size and Share Forecast Outlook 2025 to 2035
Magnetic Resonance Imaging (MRI) Contrast Agents Market Size and Share Forecast Outlook 2025 to 2035
Media Processing Solutions Market Size and Share Forecast Outlook 2025 to 2035
Media Asset Management Market Size and Share Forecast Outlook 2025 to 2035
Media Editing App Market Size and Share Forecast Outlook 2025 to 2035
Media Monitoring Tools Market Size and Share Forecast Outlook 2025 to 2035
Intermediate Bulk Container (IBC) Market Forecast and Outlook 2025 to 2035
Loop-Mediated Isothermal Amplification Market Analysis - Size, Share, and Forecast Outlook 2025 to 2035
Breaking Down Market Share in Intermediate Bulk Containers
Korea Intermediate Bulk Container Market Growth – Trends & Forecast 2023-2033
Western Europe Intermediate Bulk Container Market Growth – Trends & Forecast 2023-2033
Japan Intermediate Bulk Container Market Insights – Growth & Forecast 2023-2033
Multimedia Projectors Market Analysis – Growth & Industry Trends 2023-2033
AI in Media and Entertainment Market Size and Share Forecast Outlook 2025 to 2035
APOL1 Mediated Kidney Disease Market - Demand, Growth & Forecast 2025 to 2035
Social Media Records Management Market Size and Share Forecast Outlook 2025 to 2035
Social Media Engagement Applications Market Size and Share Forecast Outlook 2025 to 2035
Social Media Content Creation Market Size and Share Forecast Outlook 2025 to 2035

Thank you!
You will receive an email from our Business Development Manager. Please be sure to check your SPAM/JUNK folder too.
Chat With
MaRIA