Reports

- Global Locations -

Headquarters

Future Market Insights, Inc.

Christiana Corporate, 200
Continental Drive, Suite 401,
Newark, Delaware - 19713,
United States

T: +1-845-579-5705

Americas

Future Market Insights, Inc.

616 Corporate Way, Suite 2-9018,
Valley Cottage, NY 10989, United States

T: +1-347-918-3531

MEA

Future Market Insights

1602-6 Jumeirah Bay X2 Tower, Plot No: JLT-PH2-X2A,
Jumeirah Lakes Towers, Dubai,
United Arab Emirates

Europe

Future Market Insights

3rd Floor, 207 Regent Street,
W1B 3HH London
United Kingdom

T: + 44 (0) 20 8123 9659
D: +44 (0) 20 3287 4268

Asia Pacific

Future Market Insights

IndiaLand Global Tech Park, Unit UG-1, Behind Grand HighStreet, Phase 1, Hinjawadi, MH, Pune – 411057, India

Media Editing App Market Outlook (2022 to 2032)

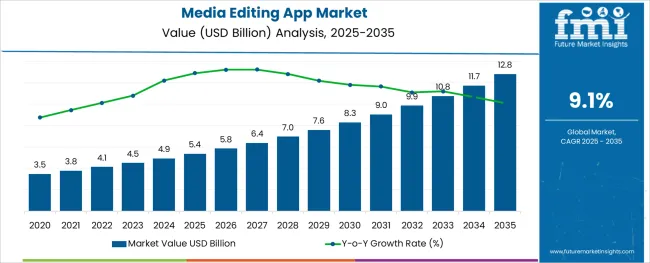
In 2021, the global media editing app market was worth US$ 3,782.5 Million. Due to the enormous increase in the popularity of editing software in recent years, the market is anticipated to rise from US$ 4,085.1 Million in 2022 to US$ 9,747.3 Million by 2032, representing a CAGR of 9.1% over the forecast period.

Recently, the use of media editing apps has skyrocketed because it has become essential for those who wish to transform unprocessed media into shareable, polished, professional images and films. This demand is met by a wide variety of applications and software. Some have carved out a niche for themselves by specializing in a certain type of photo and video editing or by undercutting their rivals' prices. Some companies have maintained their position at the top by concentrating on a variety of features, while others have created a distinctive market niche by fusing expert and amateur characteristics.

The global increase in demand for media editing applications with reshuffled features is to blame for the market expansion. Other dynamics prompting the market growth are as follows:

  • Editing applications offer a wide range of tools and controls for editing-related tasks including rendering power, planning out complicated projects, color grading panels, and optical flow, which continues to be popular among numerous leading and up-and-coming on-premises editing platforms.
  • The rising rate of technical innovation in camera equipment, demand for high-quality photographs, and the need for special effects like color, tints, and much more.
  • The pragmatic need for editing software in content management for personal use and AV professionals is attributable to its rising demand.
  • The media-editing application industry is growing in tandem with the surge in demand for cloud-based applications.
  • As social media, digital marketing, and influencer platforms have mushroomed, consumers are becoming gradually more interested in influencer marketing.
  • The accessibility of high-definition screens coupled with the penetration of smartphones and cameras.
  • Since so many individuals are posting videos on their social media platforms, the practice of video editing software is mounting.
  • The market is also expanding owing to rising demand for professional video editing apps for live streaming and AI-based photo-to-video converter apps.
  • The need for audio and video editing software has surged due to an astounding shift toward work-from-home prerequisites.
  • The expansion of the global media editing app market is also being driven by an increase in the usage of online cloud editing software by people and groups.

However, several issues, including expensive costs and a lack of appropriate technical expertise, are impeding the market's progress. Some additional factors hampering the market growth are:

  • Since there is a growing array of open-source and free editing tools, sales of media editing apps have recently declined.
  • The media editing software industry is confronted with serious problems with pirated software.
  • The resources are charging more since there is a shortage of skilled labor that can use the developing technology of the time.

Given the rising demand for these media editing apps, several manufacturers have included novel features. Here are some trends and opportunities in the media editing app market:

  • To provide customers with practical experience with the program and increase conversions, companies in the audio and video editing software industry are making more free tools available.
  • A growing number of social media influencers, YouTubers, and online business entrepreneurs use audio and video editing apps to foster creativity in their online video production.
  • OTT platforms make it simple to access entertainment, which drives up demand for content and boosts the profitability of media editing apps.
  • Since video content (rather than simply text or images) is more beneficial for learning than traditional educational techniques alone, multimedia enterprises that employ video content should anticipate seeing more market growth.
  • To diversify their revenue sources, companies are aiming their audio and video editing apps toward small enterprises.
Attributes Details
Media Editing App Market Value (2022) US$ 4,085.1 Million
Media Editing App Market Expected Value (2032) US$ 9,747.3 Million
Media Editing App Market Projected CAGR (2022 to 2032) 9.1%

Don't pay for what you don't need

Customize your report by selecting specific countries or regions and save 30%!

A Brief Overview of the Historical Market Scenario and the Present Growth Statistics

Prior to the widespread use of digital non-linear editing techniques, all films underwent their first editing using a film work print, also known as a cutting copy in the United Kingdom, which included physically cutting and splicing together sections of the film. The global market for media editing apps is expanding rapidly at present. The global increase in interest in restructured feature picture editing applications is mostly responsible for the market expansion.

The market expansion is expected to be refueled by an increase in the use of blur video backdrop applications. The market is also expanding as a result of the rising demand for live-streaming video editing apps. Additionally, a surge in demand for AI-based photo-to-video converter applications is promoting market expansion. Besides, the market expansion is being fueled by the rising need for useful filter applications.

The media editing app market generated US$ US$ 3,782.5 Million in sales in 2021. Future Market Insight researchers forecast that the market for media editing apps is poised to go through a significant transition that will alter how market players operate. The market is expected to increase at a CAGR of 9.1% to reach from US$ 4,085.1 Million in 2022 to US$ 9,747.3 Million by 2032.

The popularity of social media sites like Instagram, YouTube, and Twitter has increased the sharing of online content, therefore having good editing applications and software makes the difference between millions of potential views or impressions. The availability of several automated machine learning media editors and enhancement software alternatives has allowed users to automatically edit photos, videos, and audio in a matter of minutes, even though many individuals may be familiar with standard editing software options like Adobe Premiere. Customers can now effortlessly edit hours of video footage without having to spend an outrageous amount of time and money owing to these editing applications.

A variety of top editing platforms continue to be fans of the media editing apps since they offer a wide variety of tools and controls for editing-related tasks. The program on the cloud exhibits complexity and capable characteristics. On desktops like Windows and Mac or mobile applications like iOS and Android, it offers fundamental video editing skills via a cloud environment for subscription-based business models. The functional necessity of content management for both individuals and professionals is another factor contributing to the increased demand for media editing software.

Comparative Analysis of Adjacent Markets

Media Editing App Market:

Differentiating Aspects Media Editing App Market
CAGR 9.1%
Market Valuation in 2022 US$ 4,085.1 Million
Projected Market Value in 2032 US$ 9,747.3 Million
Driver Growing requirement for AI-based photo-to-video converter applications and professional video editing software for live broadcasting.
Trend Owing to the growing number of online entrepreneurs, aspiring YouTube stars, and social media influencers, vendors are expanding their free trial period offerings.
Opportunity Given the ongoing demand for video content for entertainment and documentation through OTT platforms, there is a huge requirement for media editing apps.

AI in Media & Entertainment Market:

Differentiating Aspects AI in Media & Entertainment Market
CAGR 26%
Market Valuation in 2022 13.1 Billion
Projected Market Value in 2032 132.16 Billion
Driver Ability to tailor their content to the individual interests and preferences of the client in order to increase content consumption.
Trend By enhancing the user experience and bringing it into the future, media, and entertainment firms are extending their reach.
Opportunity Improving online gaming experiences and the rising popularity of OTT platforms.

Social Media Content Creation Market:

Differentiating Aspects Social Media Content Creation Market
CAGR 13.1%
Market Valuation in 2022 US$ 2,510.86 Million
Projected Market Value in 2032 US$ 8,567.93 Million
Driver There is an increase in demand for social media content creation due to the quick development of social media platforms like Twitter and LinkedIn, and others.
Trend Organizations are placing greater importance on consumer interaction and effective online advertising.
Opportunity Customers are exhibiting a propensity towards unpaid advertising techniques over organic content produced by social media content creators.
Sudip Saha
Sudip Saha

Principal Consultant

Talk to Analyst

Find your sweet spots for generating winning opportunities in this market.

Category-wise Insights

Based on Media Type, the Video Segment Commands the Media Editing App Market

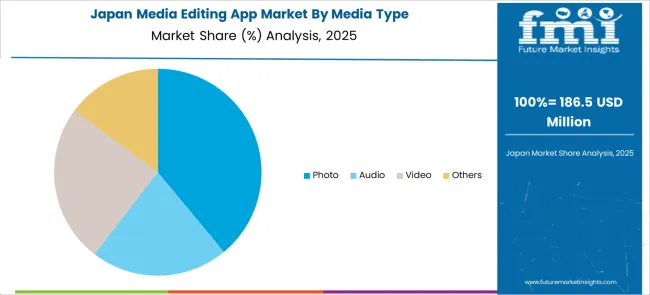
On the basis of media type, the media editing app market is classified into audio, video, photo, and others. Among these segments, the video segment dominates the market. This market had a 46.1% share of the global market in 2021 and is now growing rapidly and lucratively at a CAGR of 10.1%. The spreading out of the market is being driven by the following aspects:

  • The rapid surge in streaming services such as Netflix and OTT platforms
  • High demand for video editing software due to the ongoing demand for better video content for entertainment
  • Widespread use of smart devices like smart TVs and smartphones
  • People are now posting videos to social media sites, which has increased the adoption of video editing apps.
  • Small companies have become more reliant on video production to keep up with the expanding influencer culture.

Depending on End-user, the Dominant Category Contributing to Revenue Generation in the Media Editing App Market is the Individuals

As far as the end-user segment is concerned, the media editing market is broken down into individuals and professional editors. The individual segment has the highest market share among these sectors since these apps assist individuals in making creative works more intriguing and captivating for viewers by adding polished features. The CAGR for the individual segment is currently anticipated to be 7.1%, which would indicate considerable growth throughout the forecast period. The category held a 62.9% market share globally in 2021. The grounds for sustained growth are:

  • Individuals can effortlessly improve their videos using these media editing apps without employing specialists.
  • As these apps are mostly easy to use, individuals prefer to edit their photos and videos through these apps without any professional skill.
  • With the help of these apps, individuals can merge several video clips, add music, titles, and special effects, and then share the final videos with their family members and friends.
  • Before posting their movies to social media platforms or sharing them on other digital sites to be trendy, many users utilize media editing apps to enhance the quality of their photos and videos.

However, the professional editor segment is expected to witness the fastest growth over the forecast period, exhibiting a CAGR of 9.6%. Using media editing apps, professional editors can easily and rapidly edit photographs or videos for their clients, finish incomplete projects, add titles and subtitles, incorporate special effects and audio when needed, and transition between segments in a movie. These elements help the market expansion.
Country-wise Insight

With 35.5% of the global market share in 2021, North America held the highest market share. During the forecast period, it is anticipated that North America will expand at a CAGR of 6.5% and will keep dominating the market. Due to government initiatives that encourage innovation, the region is one of the most important areas for new technology. The region with the fastest growth is expected to be East Asia, where the demand for video editing software is expected to increase at a CAGR of 11.8% as a result of the increasing popularity of various types of video content on social media channels.
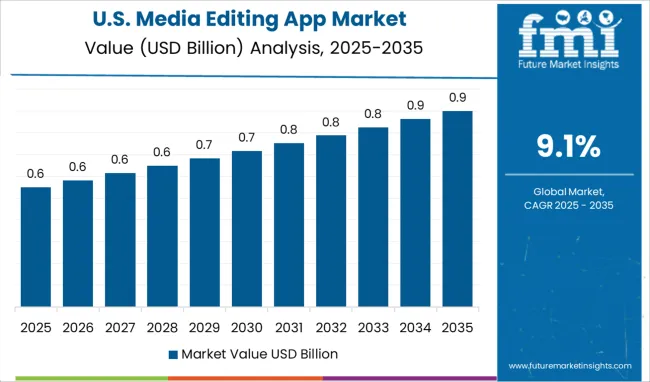
Strong Uptake of Media Editing Apps in the USA as it has the Largest Media and Entertainment Sector

With a CAGR of 6.7%, the USA is the market leader for media editing apps in North America. In 2021, the USA media editing app market gained 21.5% of the global market share. The nation has a strong industrial foundation, a large population engaged in science-related occupations, and high purchasing power.

The consequence has been an increase in social networks, which have multiplied over time as technology has allowed the state to utilize new gadgets like laptops and cellphones that require top-notch media editing software to operate properly.

Additionally, various smartphone-specific software programs with tailored dashboards for quick video editing solutions have been released by multiple firms active in the USA media editing app market to cater to these rapidly expanding users. Furthermore, the use of automatic slideshow production applications is a new trend that is assisting market expansion in the USA. The market growth is also anticipated to accelerate due to the rising popularity of animated text and title effects in photos and videos. Moreover, it is projected that the market would develop as a result of the growing need in the USA for graphic apps to be easily integrated.

In addition, small companies in the USA spend a lot of money on social media marketing firms. Sales through this channel are being significantly increased by the e-commerce business in the USA's growing usage of immersive and alluring advanced picture editing software as well as AI technology.

Development of the European Media Editing App Market is Fueled by the Increasing Occurrences of Filmmaking

The second-largest region in Europe. A CAGR of 7.8% is predicted for its growth over the forecast period. Given that it captured 20.8% of the global market in 2021, the market for media editing apps in Europe is predicted to expand rapidly. The majority of the money spent on the European media editing app market share is attributed to the United Kingdom, Germany, France, Russia, and Italy. The German media editing app market is the biggest in all of Europe, with a reported 11.2% market share. The market is anticipated to expand at a CAGR of 5.8% during the forecast period.

The potential for development in the European market is enormous given the rising consumer demand and rising film output. Recent years have seen the introduction of innovative features and effective functions, which is a key market driver.

Additionally, the popularity of streaming movies online over conventional media is driving up customer demand for these services. The European region's video editing software market is expected to develop as a result of the rising popularity of virtual reality and augmented reality.

People in Asia Pacific have become additionally Enthusiastic about Pro-media Editing Applications

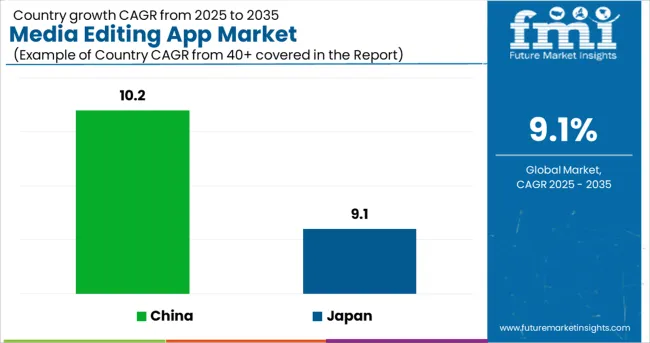
The fastest-growing region is Asia Pacific. Major economies in this area include China, Japan, South Korea, India, and Australia. China and Japan have the fastest rates of development among these nations. Media editing software is becoming more in demand in this region as a result of the popularity of various video content on social media platforms. South Asia held a significant market share in 2021 which was around 18.7% of the global market. It is envisaged that the market expansion would be aided by the growing need for preconfigured settings with predetermined defaults and switching capability in picture and video apps.

Country China
Market Share (2021) 10.3%
CAGR (2022 to 2032) 10.2%
Growth Factors The adoption of technologically advanced applications with the ability to alter the pace and create transition effects is becoming more popular in China, which is boosting market expansion. Another factor propelling market expansion is the rapidly expanding entertainment and media business.
Country Japan
Market Share (2021) 8.1%
CAGR (2022 to 2032) 9.1%
Growth Factors The market in Japan is being pushed by the increase in popularity of machine learning-based picture and video apps. Another significant element influencing market development is the use of video editing software for academic purposes.

Get the data you need at a Fraction of the cost

Personalize your report by choosing insights you need
and save 40%!

Media Editing App Market Initiatives: Recent Investments from Well-Known Brands in Start-ups

Business models vary throughout time, sometimes as a consequence of market shifts and other times as a result of technological advancements, which leads to the birth of exciting new trends. FMI regularly monitors the startup scene globally and has discovered several intriguing concepts that are gaining traction, one of which is the media editing app.

New companies in the media editing app industry are developing innovative applications and obtaining a competitive edge by utilizing technology improvements. These companies continuously spend money on Research and Development to stay on top of changing customer tastes and expectations from the end-use industry. The industry of media editing apps is being aided by initiatives to improve its standing in the forum.

Top Start-ups to Watch for

Start-up Company WeVideo
Country USA
Description For both businesses and individuals, WeVideo is a cloud-based collaborative video editing application. Enables collaboration and sharing of video clips among video creators using a single interface. With the help of the software, users may make personalized movies using a variety of tools, such as themes, filters, effects, transitions, emoticons, voiceover narration, music, etc. The organization furthermore provides an enterprise feature that is priced following the requirements of its customers. Android, iOS, and Windows PCs may all use the program. Both in-app purchases and advertisements are how the app is funded.
Start-up Company Camera360
Country China
Description Camera360 is the inventor of camera and photo editing apps. Selfie cameras with several shooting options, as well as tools for editing photos like animated stickers and skin-bleaching effects, are all part of its app portfolio. Beauty cameras, image editors, and photo collage makers are all part of it.

Competitive Landscape

Competition heats up in the Media Editing App Market: CyberLink Corp., MAGIX Software GmbH, and Steinberg Media Technologies GmbH are Cartelizing the Market

CyberLink Corp., a company established in 1996, is the industry pioneer in AI facial recognition technology and multimedia software. In order to continually reinvent the multimedia experience and consistently produce unique and interoperable solutions, the firm has developed and is the owner of over 200 patented technologies.

In addition to musical works that went on to top the charts throughout the world, MAGIX Software GmbH products have been used extensively in Oscar-winning film and television projects. With the aid of its numerous broadcasting firms and 35 million users, which have won awards for their SaaS solutions, amazing soundtracks and movies can be made, brands can be promoted, and stories can be told. Excellent methods for producing, designing, presenting, and archiving digital images, graphics, websites, videos, and music are highly valued.

Leading the way in sound technology, Steinberg Media Technologies GmbH has been producing robust, adaptable, and user-friendly audio software for many years. Steinberg offers the greatest applications, sounds, software, hardware, and tutorials to help everyone, from novice musicians, producers, and sound designers to the most seasoned professionals.

Recent Developments:

  • In June 2022, Adobe made substantial updates to the Creative Cloud software Photoshop, Lightroom, and Lightroom Classic, giving users additional features, benefits, and value. It will enhance Photoshop on the web's editing and usability, employ AI and machine learning from Adobe Sensei to make complex tasks easier for creatives, and improve cross-device collaborative workflows for Photoshop and Lightroom users (desktop, internet, and mobile).
  • In April 2022, a new version of iMovie was published by Apple with features that make it easier to create high-quality edited videos for the iPhone and iPad, as well as pre-made templates for popular sorts of videos shared on social media. Videos may be modified, and examples include DIY instructions, food demonstrations, product reviews, and science projects. Storyboards help prospective writers, filmmakers, and musicians hone their editing and narrative abilities.
  • In April 2022, to showcase technology demonstrations of video production solutions at NAB that would provide more advanced remote controls, Avid established a collaboration with Microsoft and Haivision.
  • In November 2018, Cyberlink Corporation proclaimed the launch of PhotoDirector 365, an all-inclusive and dynamic photo editing software. Layer Packs, HDR, Black & White and Split Tone Presets, Motion Still, Keystone Correction, and 360 picture editing are some of the user-friendly functions included in this photo editing program. Additionally, Tethered Shooting, Soft Proofing, and AI Style Effects are features of this program that enhance photo editing.

Some of the other key companies proliferating in the market are

  • Adobe
  • Apple
  • Autodesk, Inc.
  • Avid
  • Avid Technology, Inc.
  • Black Magic Design
  • Corel Corporation
  • FXHome
  • HairerSoft, iZotope, Inc.
  • Microsoft Corp
  • Movavi
  • NCH Software
  • Pinnacle
  • PreSonus Audio Electronics, Inc
  • Sony Corporation
  • Wondershare Technology

Key Segments in the Media Editing App Market

By Media Type:

  • Photo
  • Audio
  • Video
  • Others

By End-user:

  • Professional Editors
  • Individuals

By Region:

  • North America
  • Latin America
  • Europe
  • East Asia
  • South Asia
  • Middle East and Africa

Frequently Asked Questions

What is the size of the global Media Editing App market in 2022?

The media editing app market accounted for a market value of US$ 4,085.1 Million in 2022.

What is the expected growth rate of the global Media Editing App market?

The media editing app market is estimated to record a CAGR of 9.1% during the forecast period.

What is the Projected size of the global Media Editing App market in 2032?

The media editing app market size is predicted to be valued at US$ 747.3 Million by 2032.

What are the key regions in the global Media Editing App market?

The key regions in the global media editing app market are the USA, Germany, India, China, and Japan.

Which is the Leading Region in the global Media Editing App Market?

North America dominates the global media editing app Market.

Table of Content

1. Executive Summary | Media Editing App Market

    1.1. Global Market Outlook

    1.2. Demand-side Trends

    1.3. Supply-side Trends

    1.4. Technology Roadmap Analysis

    1.5. Analysis and Recommendations

2. Market Overview

    2.1. Market Coverage / Taxonomy

    2.2. Market Definition / Scope / Limitations

3. Market Background

    3.1. Market Dynamics

        3.1.1. Drivers

        3.1.2. Restraints

        3.1.3. Opportunity

        3.1.4. Trends

    3.2. Scenario Forecast

        3.2.1. Demand in Optimistic Scenario

        3.2.2. Demand in Likely Scenario

        3.2.3. Demand in Conservative Scenario

    3.3. Opportunity Map Analysis

    3.4. Investment Feasibility Matrix

    3.5. PESTLE and Porter’s Analysis

    3.6. Regulatory Landscape

        3.6.1. By Key Regions

        3.6.2. By Key Countries

    3.7. Regional Parent Market Outlook

4. Global Market Analysis 2017 to 2021 and Forecast, 2022 to 2032

    4.1. Historical Market Size Value (US$ Million) Analysis, 2017 to 2021

    4.2. Current and Future Market Size Value (US$ Million) Projections, 2022 to 2032

        4.2.1. Y-o-Y Growth Trend Analysis

        4.2.2. Absolute $ Opportunity Analysis

5. Global Market Analysis 2017 to 2021 and Forecast 2022 to 2032, By Types

    5.1. Introduction / Key Findings

    5.2. Historical Market Size Value (US$ Million) Analysis By Types, 2017 to 2021

    5.3. Current and Future Market Size Value (US$ Million) Analysis and Forecast By Types, 2022 to 2032

        5.3.1. Photo App

        5.3.2. Media App

    5.4. Y-o-Y Growth Trend Analysis By Types, 2017 to 2021

    5.5. Absolute $ Opportunity Analysis By Types, 2022 to 2032

6. Global Market Analysis 2017 to 2021 and Forecast 2022 to 2032, By Platform

    6.1. Introduction / Key Findings

    6.2. Historical Market Size Value (US$ Million) Analysis By Platform, 2017 to 2021

    6.3. Current and Future Market Size Value (US$ Million) Analysis and Forecast By Platform, 2022 to 2032

        6.3.1. IOS

        6.3.2. Android

        6.3.3. Universal

    6.4. Y-o-Y Growth Trend Analysis By Platform, 2017 to 2021

    6.5. Absolute $ Opportunity Analysis By Platform, 2022 to 2032

7. Global Market Analysis 2017 to 2021 and Forecast 2022 to 2032, By End-User

    7.1. Introduction / Key Findings

    7.2. Historical Market Size Value (US$ Million) Analysis By End-User, 2017 to 2021

    7.3. Current and Future Market Size Value (US$ Million) Analysis and Forecast By End-User, 2022 to 2032

        7.3.1. Individual Users

        7.3.2. Enterprise Users

    7.4. Y-o-Y Growth Trend Analysis By End-User, 2017 to 2021

    7.5. Absolute $ Opportunity Analysis By End-User, 2022 to 2032

8. Global Market Analysis 2017 to 2021 and Forecast 2022 to 2032, By Region

    8.1. Introduction

    8.2. Historical Market Size Value (US$ Million) Analysis By Region, 2017 to 2021

    8.3. Current Market Size Value (US$ Million) Analysis and Forecast By Region, 2022 to 2032

        8.3.1. North America

        8.3.2. Latin America

        8.3.3. Europe

        8.3.4. South Asia

        8.3.5. East Asia

        8.3.6. Oceania

        8.3.7. Middle East and Africa(MEA)

    8.4. Market Attractiveness Analysis By Region

9. North America Market Analysis 2017 to 2021 and Forecast 2022 to 2032, By Country

    9.1. Historical Market Size Value (US$ Million) Trend Analysis By Market Taxonomy, 2017 to 2021

    9.2. Market Size Value (US$ Million) Forecast By Market Taxonomy, 2022 to 2032

        9.2.1. By Country

            9.2.1.1. USA

            9.2.1.2. Canada

        9.2.2. By Types

        9.2.3. By Platform

        9.2.4. By End-User 

    9.3. Market Attractiveness Analysis

        9.3.1. By Country

        9.3.2. By Types

        9.3.3. By Platform

        9.3.4. By End-User

    9.4. Key Takeaways

10. Latin America Market Analysis 2017 to 2021 and Forecast 2022 to 2032, By Country

    10.1. Historical Market Size Value (US$ Million) Trend Analysis By Market Taxonomy, 2017 to 2021

    10.2. Market Size Value (US$ Million) Forecast By Market Taxonomy, 2022 to 2032

        10.2.1. By Country

            10.2.1.1. Brazil

            10.2.1.2. Mexico

            10.2.1.3. Rest of Latin America

        10.2.2. By Types

        10.2.3. By Platform

        10.2.4. By End-User

    10.3. Market Attractiveness Analysis

        10.3.1. By Country

        10.3.2. By Types

        10.3.3. By Platform

        10.3.4. By End-User

    10.4. Key Takeaways

11. Europe Market Analysis 2017 to 2021 and Forecast 2022 to 2032, By Country

    11.1. Historical Market Size Value (US$ Million) Trend Analysis By Market Taxonomy, 2017 to 2021

    11.2. Market Size Value (US$ Million) Forecast By Market Taxonomy, 2022 to 2032

        11.2.1. By Country

            11.2.1.1. Germany

            11.2.1.2. United Kingdom

            11.2.1.3. France

            11.2.1.4. Spain

            11.2.1.5. Italy

            11.2.1.6. Rest of Europe

        11.2.2. By Types

        11.2.3. By Platform

        11.2.4. By End-User

    11.3. Market Attractiveness Analysis

        11.3.1. By Country

        11.3.2. By Types

        11.3.3. By Platform

        11.3.4. By End-User

    11.4. Key Takeaways

12. South Asia Market Analysis 2017 to 2021 and Forecast 2022 to 2032, By Country

    12.1. Historical Market Size Value (US$ Million) Trend Analysis By Market Taxonomy, 2017 to 2021

    12.2. Market Size Value (US$ Million) Forecast By Market Taxonomy, 2022 to 2032

        12.2.1. By Country

            12.2.1.1. India

            12.2.1.2. Malaysia

            12.2.1.3. Singapore

            12.2.1.4. Thailand

            12.2.1.5. Rest of South Asia

        12.2.2. By Types

        12.2.3. By Platform

        12.2.4. By End-User

    12.3. Market Attractiveness Analysis

        12.3.1. By Country

        12.3.2. By Types

        12.3.3. By Platform

        12.3.4. By End-User

    12.4. Key Takeaways

13. East Asia Market Analysis 2017 to 2021 and Forecast 2022 to 2032, By Country

    13.1. Historical Market Size Value (US$ Million) Trend Analysis By Market Taxonomy, 2017 to 2021

    13.2. Market Size Value (US$ Million) Forecast By Market Taxonomy, 2022 to 2032

        13.2.1. By Country

            13.2.1.1. China

            13.2.1.2. Japan

            13.2.1.3. South Korea

        13.2.2. By Types

        13.2.3. By Platform

        13.2.4. By End-User

    13.3. Market Attractiveness Analysis

        13.3.1. By Country

        13.3.2. By Types

        13.3.3. By Platform

        13.3.4. By End-User

    13.4. Key Takeaways

14. Oceania Market Analysis 2017 to 2021 and Forecast 2022 to 2032, By Country

    14.1. Historical Market Size Value (US$ Million) Trend Analysis By Market Taxonomy, 2017 to 2021

    14.2. Market Size Value (US$ Million) Forecast By Market Taxonomy, 2022 to 2032

        14.2.1. By Country

            14.2.1.1. Australia

            14.2.1.2. New Zealand

        14.2.2. By Types

        14.2.3. By Platform

        14.2.4. By End-User

    14.3. Market Attractiveness Analysis

        14.3.1. By Country

        14.3.2. By Types

        14.3.3. By Platform

        14.3.4. By End-User

    14.4. Key Takeaways

15. MEA Market Analysis 2017 to 2021 and Forecast 2022 to 2032, By Country

    15.1. Historical Market Size Value (US$ Million) Trend Analysis By Market Taxonomy, 2017 to 2021

    15.2. Market Size Value (US$ Million) Forecast By Market Taxonomy, 2022 to 2032

        15.2.1. By Country

            15.2.1.1. GCC Countries

            15.2.1.2. South Africa

            15.2.1.3. Israel

            15.2.1.4. Rest of Middle East and Africa(MEA)

        15.2.2. By Types

        15.2.3. By Platform

        15.2.4. By End-User

    15.3. Market Attractiveness Analysis

        15.3.1. By Country

        15.3.2. By Types

        15.3.3. By Platform

        15.3.4. By End-User

    15.4. Key Takeaways

16. Key Countries Market Analysis

    16.1. USA

        16.1.1. Pricing Analysis

        16.1.2. Market Share Analysis, 2021

            16.1.2.1. By Types

            16.1.2.2. By Platform

            16.1.2.3. By End-User

    16.2. Canada

        16.2.1. Pricing Analysis

        16.2.2. Market Share Analysis, 2021

            16.2.2.1. By Types

            16.2.2.2. By Platform

            16.2.2.3. By End-User

    16.3. Brazil

        16.3.1. Pricing Analysis

        16.3.2. Market Share Analysis, 2021

            16.3.2.1. By Types

            16.3.2.2. By Platform

            16.3.2.3. By End-User

    16.4. Mexico

        16.4.1. Pricing Analysis

        16.4.2. Market Share Analysis, 2021

            16.4.2.1. By Types

            16.4.2.2. By Platform

            16.4.2.3. By End-User

    16.5. Germany

        16.5.1. Pricing Analysis

        16.5.2. Market Share Analysis, 2021

            16.5.2.1. By Types

            16.5.2.2. By Platform

            16.5.2.3. By End-User

    16.6. United Kingdom

        16.6.1. Pricing Analysis

        16.6.2. Market Share Analysis, 2021

            16.6.2.1. By Types

            16.6.2.2. By Platform

            16.6.2.3. By End-User

    16.7. France

        16.7.1. Pricing Analysis

        16.7.2. Market Share Analysis, 2021

            16.7.2.1. By Types

            16.7.2.2. By Platform

            16.7.2.3. By End-User

    16.8. Spain

        16.8.1. Pricing Analysis

        16.8.2. Market Share Analysis, 2021

            16.8.2.1. By Types

            16.8.2.2. By Platform

            16.8.2.3. By End-User

    16.9. Italy

        16.9.1. Pricing Analysis

        16.9.2. Market Share Analysis, 2021

            16.9.2.1. By Types

            16.9.2.2. By Platform

            16.9.2.3. By End-User

    16.10. India

        16.10.1. Pricing Analysis

        16.10.2. Market Share Analysis, 2021

            16.10.2.1. By Types

            16.10.2.2. By Platform

            16.10.2.3. By End-User

    16.11. Malaysia

        16.11.1. Pricing Analysis

        16.11.2. Market Share Analysis, 2021

            16.11.2.1. By Types

            16.11.2.2. By Platform

            16.11.2.3. By End-User

    16.12. Singapore

        16.12.1. Pricing Analysis

        16.12.2. Market Share Analysis, 2021

            16.12.2.1. By Types

            16.12.2.2. By Platform

            16.12.2.3. By End-User

    16.13. Thailand

        16.13.1. Pricing Analysis

        16.13.2. Market Share Analysis, 2021

            16.13.2.1. By Types

            16.13.2.2. By Platform

            16.13.2.3. By End-User

    16.14. China

        16.14.1. Pricing Analysis

        16.14.2. Market Share Analysis, 2021

            16.14.2.1. By Types

            16.14.2.2. By Platform

            16.14.2.3. By End-User

    16.15. Japan

        16.15.1. Pricing Analysis

        16.15.2. Market Share Analysis, 2021

            16.15.2.1. By Types

            16.15.2.2. By Platform

            16.15.2.3. By End-User

    16.16. South Korea

        16.16.1. Pricing Analysis

        16.16.2. Market Share Analysis, 2021

            16.16.2.1. By Types

            16.16.2.2. By Platform

            16.16.2.3. By End-User

    16.17. Australia

        16.17.1. Pricing Analysis

        16.17.2. Market Share Analysis, 2021

            16.17.2.1. By Types

            16.17.2.2. By Platform

            16.17.2.3. By End-User

    16.18. New Zealand

        16.18.1. Pricing Analysis

        16.18.2. Market Share Analysis, 2021

            16.18.2.1. By Types

            16.18.2.2. By Platform

            16.18.2.3. By End-User

    16.19. GCC Countries

        16.19.1. Pricing Analysis

        16.19.2. Market Share Analysis, 2021

            16.19.2.1. By Types

            16.19.2.2. By Platform

            16.19.2.3. By End-User

    16.20. South Africa

        16.20.1. Pricing Analysis

        16.20.2. Market Share Analysis, 2021

            16.20.2.1. By Types

            16.20.2.2. By Platform

            16.20.2.3. By End-User

    16.21. Israel

        16.21.1. Pricing Analysis

        16.21.2. Market Share Analysis, 2021

            16.21.2.1. By Types

            16.21.2.2. By Platform

            16.21.2.3. By End-User

17. Market Structure Analysis

    17.1. Competition Dashboard

    17.2. Competition Benchmarking

    17.3. Market Share Analysis of Top Players

        17.3.1. By Regional

        17.3.2. By Types

        17.3.3. By Platform

        17.3.4. By End-User

18. Competition Analysis

    18.1. Competition Deep Dive

        18.1.1. Pixlr

            18.1.1.1. Overview

            18.1.1.2. Product Portfolio

            18.1.1.3. Profitability by Market Segments

            18.1.1.4. Sales Footprint

            18.1.1.5. Strategy Overview

                18.1.1.5.1. Marketing Strategy

        18.1.2. VSCO

            18.1.2.1. Overview

            18.1.2.2. Product Portfolio

            18.1.2.3. Profitability by Market Segments

            18.1.2.4. Sales Footprint

            18.1.2.5. Strategy Overview

                18.1.2.5.1. Marketing Strategy

        18.1.3. Infltr

            18.1.3.1. Overview

            18.1.3.2. Product Portfolio

            18.1.3.3. Profitability by Market Segments

            18.1.3.4. Sales Footprint

            18.1.3.5. Strategy Overview

                18.1.3.5.1. Marketing Strategy

        18.1.4. WordSwag

            18.1.4.1. Overview

            18.1.4.2. Product Portfolio

            18.1.4.3. Profitability by Market Segments

            18.1.4.4. Sales Footprint

            18.1.4.5. Strategy Overview

                18.1.4.5.1. Marketing Strategy

        18.1.5. PicCollage

            18.1.5.1. Overview

            18.1.5.2. Product Portfolio

            18.1.5.3. Profitability by Market Segments

            18.1.5.4. Sales Footprint

            18.1.5.5. Strategy Overview

                18.1.5.5.1. Marketing Strategy

        18.1.6. Adobe Premiere Rush

            18.1.6.1. Overview

            18.1.6.2. Product Portfolio

            18.1.6.3. Profitability by Market Segments

            18.1.6.4. Sales Footprint

            18.1.6.5. Strategy Overview

                18.1.6.5.1. Marketing Strategy

        18.1.7. iMovie

            18.1.7.1. Overview

            18.1.7.2. Product Portfolio

            18.1.7.3. Profitability by Market Segments

            18.1.7.4. Sales Footprint

            18.1.7.5. Strategy Overview

                18.1.7.5.1. Marketing Strategy

        18.1.8. LumaFusion

            18.1.8.1. Overview

            18.1.8.2. Product Portfolio

            18.1.8.3. Profitability by Market Segments

            18.1.8.4. Sales Footprint

            18.1.8.5. Strategy Overview

                18.1.8.5.1. Marketing Strategy

        18.1.9. FilmoraGo

            18.1.9.1. Overview

            18.1.9.2. Product Portfolio

            18.1.9.3. Profitability by Market Segments

            18.1.9.4. Sales Footprint

            18.1.9.5. Strategy Overview

                18.1.9.5.1. Marketing Strategy

        18.1.10. Splice

            18.1.10.1. Overview

            18.1.10.2. Product Portfolio

            18.1.10.3. Profitability by Market Segments

            18.1.10.4. Sales Footprint

            18.1.10.5. Strategy Overview

                18.1.10.5.1. Marketing Strategy

19. Assumptions & Acronyms Used

20. Research Methodology

Don't pay for what you don't need

Customize your report by selecting specific countries or regions and save 30%!

List of Tables

Table 1: Global Market Value (US$ Million) Forecast by Region, 2017 to 2032

Table 2: Global Market Value (US$ Million) Forecast by Types, 2017 to 2032

Table 3: Global Market Value (US$ Million) Forecast by Platform, 2017 to 2032

Table 4: Global Market Value (US$ Million) Forecast by End-User, 2017 to 2032

Table 5: North America Market Value (US$ Million) Forecast by Country, 2017 to 2032

Table 6: North America Market Value (US$ Million) Forecast by Types, 2017 to 2032

Table 7: North America Market Value (US$ Million) Forecast by Platform, 2017 to 2032

Table 8: North America Market Value (US$ Million) Forecast by End-User, 2017 to 2032

Table 9: Latin America Market Value (US$ Million) Forecast by Country, 2017 to 2032

Table 10: Latin America Market Value (US$ Million) Forecast by Types, 2017 to 2032

Table 11: Latin America Market Value (US$ Million) Forecast by Platform, 2017 to 2032

Table 12: Latin America Market Value (US$ Million) Forecast by End-User, 2017 to 2032

Table 13: Europe Market Value (US$ Million) Forecast by Country, 2017 to 2032

Table 14: Europe Market Value (US$ Million) Forecast by Types, 2017 to 2032

Table 15: Europe Market Value (US$ Million) Forecast by Platform, 2017 to 2032

Table 16: Europe Market Value (US$ Million) Forecast by End-User, 2017 to 2032

Table 17: South Asia Market Value (US$ Million) Forecast by Country, 2017 to 2032

Table 18: South Asia Market Value (US$ Million) Forecast by Types, 2017 to 2032

Table 19: South Asia Market Value (US$ Million) Forecast by Platform, 2017 to 2032

Table 20: South Asia Market Value (US$ Million) Forecast by End-User, 2017 to 2032

Table 21: East Asia Market Value (US$ Million) Forecast by Country, 2017 to 2032

Table 22: East Asia Market Value (US$ Million) Forecast by Types, 2017 to 2032

Table 23: East Asia Market Value (US$ Million) Forecast by Platform, 2017 to 2032

Table 24: East Asia Market Value (US$ Million) Forecast by End-User, 2017 to 2032

Table 25: Oceania Market Value (US$ Million) Forecast by Country, 2017 to 2032

Table 26: Oceania Market Value (US$ Million) Forecast by Types, 2017 to 2032

Table 27: Oceania Market Value (US$ Million) Forecast by Platform, 2017 to 2032

Table 28: Oceania Market Value (US$ Million) Forecast by End-User, 2017 to 2032

Table 29: MEA Market Value (US$ Million) Forecast by Country, 2017 to 2032

Table 30: MEA Market Value (US$ Million) Forecast by Types, 2017 to 2032

Table 31: MEA Market Value (US$ Million) Forecast by Platform, 2017 to 2032

Table 32: MEA Market Value (US$ Million) Forecast by End-User, 2017 to 2032
Sudip Saha
Sudip Saha

Principal Consultant

Talk to Analyst

Find your sweet spots for generating winning opportunities in this market.

List of Charts

Figure 1: Global Market Value (US$ Million) by Types, 2022 to 2032

Figure 2: Global Market Value (US$ Million) by Platform, 2022 to 2032

Figure 3: Global Market Value (US$ Million) by End-User, 2022 to 2032

Figure 4: Global Market Value (US$ Million) by Region, 2022 to 2032

Figure 5: Global Market Value (US$ Million) Analysis by Region, 2017 to 2032

Figure 6: Global Market Value Share (%) and BPS Analysis by Region, 2022 to 2032

Figure 7: Global Market Y-o-Y Growth (%) Projections by Region, 2022 to 2032

Figure 8: Global Market Value (US$ Million) Analysis by Types, 2017 to 2032

Figure 9: Global Market Value Share (%) and BPS Analysis by Types, 2022 to 2032

Figure 10: Global Market Y-o-Y Growth (%) Projections by Types, 2022 to 2032

Figure 11: Global Market Value (US$ Million) Analysis by Platform, 2017 to 2032

Figure 12: Global Market Value Share (%) and BPS Analysis by Platform, 2022 to 2032

Figure 13: Global Market Y-o-Y Growth (%) Projections by Platform, 2022 to 2032

Figure 14: Global Market Value (US$ Million) Analysis by End-User, 2017 to 2032

Figure 15: Global Market Value Share (%) and BPS Analysis by End-User, 2022 to 2032

Figure 16: Global Market Y-o-Y Growth (%) Projections by End-User, 2022 to 2032

Figure 17: Global Market Attractiveness by Types, 2022 to 2032

Figure 18: Global Market Attractiveness by Platform, 2022 to 2032

Figure 19: Global Market Attractiveness by End-User, 2022 to 2032

Figure 20: Global Market Attractiveness by Region, 2022 to 2032

Figure 21: North America Market Value (US$ Million) by Types, 2022 to 2032

Figure 22: North America Market Value (US$ Million) by Platform, 2022 to 2032

Figure 23: North America Market Value (US$ Million) by End-User, 2022 to 2032

Figure 24: North America Market Value (US$ Million) by Country, 2022 to 2032

Figure 25: North America Market Value (US$ Million) Analysis by Country, 2017 to 2032

Figure 26: North America Market Value Share (%) and BPS Analysis by Country, 2022 to 2032

Figure 27: North America Market Y-o-Y Growth (%) Projections by Country, 2022 to 2032

Figure 28: North America Market Value (US$ Million) Analysis by Types, 2017 to 2032

Figure 29: North America Market Value Share (%) and BPS Analysis by Types, 2022 to 2032

Figure 30: North America Market Y-o-Y Growth (%) Projections by Types, 2022 to 2032

Figure 31: North America Market Value (US$ Million) Analysis by Platform, 2017 to 2032

Figure 32: North America Market Value Share (%) and BPS Analysis by Platform, 2022 to 2032

Figure 33: North America Market Y-o-Y Growth (%) Projections by Platform, 2022 to 2032

Figure 34: North America Market Value (US$ Million) Analysis by End-User, 2017 to 2032

Figure 35: North America Market Value Share (%) and BPS Analysis by End-User, 2022 to 2032

Figure 36: North America Market Y-o-Y Growth (%) Projections by End-User, 2022 to 2032

Figure 37: North America Market Attractiveness by Types, 2022 to 2032

Figure 38: North America Market Attractiveness by Platform, 2022 to 2032

Figure 39: North America Market Attractiveness by End-User, 2022 to 2032

Figure 40: North America Market Attractiveness by Country, 2022 to 2032

Figure 41: Latin America Market Value (US$ Million) by Types, 2022 to 2032

Figure 42: Latin America Market Value (US$ Million) by Platform, 2022 to 2032

Figure 43: Latin America Market Value (US$ Million) by End-User, 2022 to 2032

Figure 44: Latin America Market Value (US$ Million) by Country, 2022 to 2032

Figure 45: Latin America Market Value (US$ Million) Analysis by Country, 2017 to 2032

Figure 46: Latin America Market Value Share (%) and BPS Analysis by Country, 2022 to 2032

Figure 47: Latin America Market Y-o-Y Growth (%) Projections by Country, 2022 to 2032

Figure 48: Latin America Market Value (US$ Million) Analysis by Types, 2017 to 2032

Figure 49: Latin America Market Value Share (%) and BPS Analysis by Types, 2022 to 2032

Figure 50: Latin America Market Y-o-Y Growth (%) Projections by Types, 2022 to 2032

Figure 51: Latin America Market Value (US$ Million) Analysis by Platform, 2017 to 2032

Figure 52: Latin America Market Value Share (%) and BPS Analysis by Platform, 2022 to 2032

Figure 53: Latin America Market Y-o-Y Growth (%) Projections by Platform, 2022 to 2032

Figure 54: Latin America Market Value (US$ Million) Analysis by End-User, 2017 to 2032

Figure 55: Latin America Market Value Share (%) and BPS Analysis by End-User, 2022 to 2032

Figure 56: Latin America Market Y-o-Y Growth (%) Projections by End-User, 2022 to 2032

Figure 57: Latin America Market Attractiveness by Types, 2022 to 2032

Figure 58: Latin America Market Attractiveness by Platform, 2022 to 2032

Figure 59: Latin America Market Attractiveness by End-User, 2022 to 2032

Figure 60: Latin America Market Attractiveness by Country, 2022 to 2032

Figure 61: Europe Market Value (US$ Million) by Types, 2022 to 2032

Figure 62: Europe Market Value (US$ Million) by Platform, 2022 to 2032

Figure 63: Europe Market Value (US$ Million) by End-User, 2022 to 2032

Figure 64: Europe Market Value (US$ Million) by Country, 2022 to 2032

Figure 65: Europe Market Value (US$ Million) Analysis by Country, 2017 to 2032

Figure 66: Europe Market Value Share (%) and BPS Analysis by Country, 2022 to 2032

Figure 67: Europe Market Y-o-Y Growth (%) Projections by Country, 2022 to 2032

Figure 68: Europe Market Value (US$ Million) Analysis by Types, 2017 to 2032

Figure 69: Europe Market Value Share (%) and BPS Analysis by Types, 2022 to 2032

Figure 70: Europe Market Y-o-Y Growth (%) Projections by Types, 2022 to 2032

Figure 71: Europe Market Value (US$ Million) Analysis by Platform, 2017 to 2032

Figure 72: Europe Market Value Share (%) and BPS Analysis by Platform, 2022 to 2032

Figure 73: Europe Market Y-o-Y Growth (%) Projections by Platform, 2022 to 2032

Figure 74: Europe Market Value (US$ Million) Analysis by End-User, 2017 to 2032

Figure 75: Europe Market Value Share (%) and BPS Analysis by End-User, 2022 to 2032

Figure 76: Europe Market Y-o-Y Growth (%) Projections by End-User, 2022 to 2032

Figure 77: Europe Market Attractiveness by Types, 2022 to 2032

Figure 78: Europe Market Attractiveness by Platform, 2022 to 2032

Figure 79: Europe Market Attractiveness by End-User, 2022 to 2032

Figure 80: Europe Market Attractiveness by Country, 2022 to 2032

Figure 81: South Asia Market Value (US$ Million) by Types, 2022 to 2032

Figure 82: South Asia Market Value (US$ Million) by Platform, 2022 to 2032

Figure 83: South Asia Market Value (US$ Million) by End-User, 2022 to 2032

Figure 84: South Asia Market Value (US$ Million) by Country, 2022 to 2032

Figure 85: South Asia Market Value (US$ Million) Analysis by Country, 2017 to 2032

Figure 86: South Asia Market Value Share (%) and BPS Analysis by Country, 2022 to 2032

Figure 87: South Asia Market Y-o-Y Growth (%) Projections by Country, 2022 to 2032

Figure 88: South Asia Market Value (US$ Million) Analysis by Types, 2017 to 2032

Figure 89: South Asia Market Value Share (%) and BPS Analysis by Types, 2022 to 2032

Figure 90: South Asia Market Y-o-Y Growth (%) Projections by Types, 2022 to 2032

Figure 91: South Asia Market Value (US$ Million) Analysis by Platform, 2017 to 2032

Figure 92: South Asia Market Value Share (%) and BPS Analysis by Platform, 2022 to 2032

Figure 93: South Asia Market Y-o-Y Growth (%) Projections by Platform, 2022 to 2032

Figure 94: South Asia Market Value (US$ Million) Analysis by End-User, 2017 to 2032

Figure 95: South Asia Market Value Share (%) and BPS Analysis by End-User, 2022 to 2032

Figure 96: South Asia Market Y-o-Y Growth (%) Projections by End-User, 2022 to 2032

Figure 97: South Asia Market Attractiveness by Types, 2022 to 2032

Figure 98: South Asia Market Attractiveness by Platform, 2022 to 2032

Figure 99: South Asia Market Attractiveness by End-User, 2022 to 2032

Figure 100: South Asia Market Attractiveness by Country, 2022 to 2032

Figure 101: East Asia Market Value (US$ Million) by Types, 2022 to 2032

Figure 102: East Asia Market Value (US$ Million) by Platform, 2022 to 2032

Figure 103: East Asia Market Value (US$ Million) by End-User, 2022 to 2032

Figure 104: East Asia Market Value (US$ Million) by Country, 2022 to 2032

Figure 105: East Asia Market Value (US$ Million) Analysis by Country, 2017 to 2032

Figure 106: East Asia Market Value Share (%) and BPS Analysis by Country, 2022 to 2032

Figure 107: East Asia Market Y-o-Y Growth (%) Projections by Country, 2022 to 2032

Figure 108: East Asia Market Value (US$ Million) Analysis by Types, 2017 to 2032

Figure 109: East Asia Market Value Share (%) and BPS Analysis by Types, 2022 to 2032

Figure 110: East Asia Market Y-o-Y Growth (%) Projections by Types, 2022 to 2032

Figure 111: East Asia Market Value (US$ Million) Analysis by Platform, 2017 to 2032

Figure 112: East Asia Market Value Share (%) and BPS Analysis by Platform, 2022 to 2032

Figure 113: East Asia Market Y-o-Y Growth (%) Projections by Platform, 2022 to 2032

Figure 114: East Asia Market Value (US$ Million) Analysis by End-User, 2017 to 2032

Figure 115: East Asia Market Value Share (%) and BPS Analysis by End-User, 2022 to 2032

Figure 116: East Asia Market Y-o-Y Growth (%) Projections by End-User, 2022 to 2032

Figure 117: East Asia Market Attractiveness by Types, 2022 to 2032

Figure 118: East Asia Market Attractiveness by Platform, 2022 to 2032

Figure 119: East Asia Market Attractiveness by End-User, 2022 to 2032

Figure 120: East Asia Market Attractiveness by Country, 2022 to 2032

Figure 121: Oceania Market Value (US$ Million) by Types, 2022 to 2032

Figure 122: Oceania Market Value (US$ Million) by Platform, 2022 to 2032

Figure 123: Oceania Market Value (US$ Million) by End-User, 2022 to 2032

Figure 124: Oceania Market Value (US$ Million) by Country, 2022 to 2032

Figure 125: Oceania Market Value (US$ Million) Analysis by Country, 2017 to 2032

Figure 126: Oceania Market Value Share (%) and BPS Analysis by Country, 2022 to 2032

Figure 127: Oceania Market Y-o-Y Growth (%) Projections by Country, 2022 to 2032

Figure 128: Oceania Market Value (US$ Million) Analysis by Types, 2017 to 2032

Figure 129: Oceania Market Value Share (%) and BPS Analysis by Types, 2022 to 2032

Figure 130: Oceania Market Y-o-Y Growth (%) Projections by Types, 2022 to 2032

Figure 131: Oceania Market Value (US$ Million) Analysis by Platform, 2017 to 2032

Figure 132: Oceania Market Value Share (%) and BPS Analysis by Platform, 2022 to 2032

Figure 133: Oceania Market Y-o-Y Growth (%) Projections by Platform, 2022 to 2032

Figure 134: Oceania Market Value (US$ Million) Analysis by End-User, 2017 to 2032

Figure 135: Oceania Market Value Share (%) and BPS Analysis by End-User, 2022 to 2032

Figure 136: Oceania Market Y-o-Y Growth (%) Projections by End-User, 2022 to 2032

Figure 137: Oceania Market Attractiveness by Types, 2022 to 2032

Figure 138: Oceania Market Attractiveness by Platform, 2022 to 2032

Figure 139: Oceania Market Attractiveness by End-User, 2022 to 2032

Figure 140: Oceania Market Attractiveness by Country, 2022 to 2032

Figure 141: MEA Market Value (US$ Million) by Types, 2022 to 2032

Figure 142: MEA Market Value (US$ Million) by Platform, 2022 to 2032

Figure 143: MEA Market Value (US$ Million) by End-User, 2022 to 2032

Figure 144: MEA Market Value (US$ Million) by Country, 2022 to 2032

Figure 145: MEA Market Value (US$ Million) Analysis by Country, 2017 to 2032

Figure 146: MEA Market Value Share (%) and BPS Analysis by Country, 2022 to 2032

Figure 147: MEA Market Y-o-Y Growth (%) Projections by Country, 2022 to 2032

Figure 148: MEA Market Value (US$ Million) Analysis by Types, 2017 to 2032

Figure 149: MEA Market Value Share (%) and BPS Analysis by Types, 2022 to 2032

Figure 150: MEA Market Y-o-Y Growth (%) Projections by Types, 2022 to 2032

Figure 151: MEA Market Value (US$ Million) Analysis by Platform, 2017 to 2032

Figure 152: MEA Market Value Share (%) and BPS Analysis by Platform, 2022 to 2032

Figure 153: MEA Market Y-o-Y Growth (%) Projections by Platform, 2022 to 2032

Figure 154: MEA Market Value (US$ Million) Analysis by End-User, 2017 to 2032

Figure 155: MEA Market Value Share (%) and BPS Analysis by End-User, 2022 to 2032

Figure 156: MEA Market Y-o-Y Growth (%) Projections by End-User, 2022 to 2032

Figure 157: MEA Market Attractiveness by Types, 2022 to 2032

Figure 158: MEA Market Attractiveness by Platform, 2022 to 2032

Figure 159: MEA Market Attractiveness by End-User, 2022 to 2032

Figure 160: MEA Market Attractiveness by Country, 2022 to 2032

Recommendations

Technology

Media Monitoring Tools Market

Published : June 2022

Technology

Digital Media Adapters Market

Published : March 2022

Explore Technology Insights

View Reports