Social Media Engagement Applications Market Size and Share Forecast Outlook 2025 to 2035

The Social Media Engagement Applications Market is estimated to be valued at USD 1.5 billion in 2025 and is projected to reach USD 4.8 billion by 2035, registering a compound annual growth rate (CAGR) of 12.7% over the forecast period.
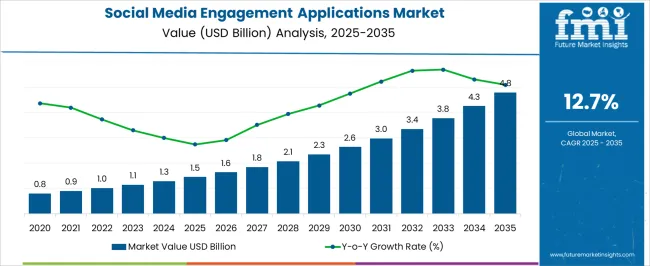
Quick Stats for Social Media Engagement Applications Market

  • Social Media Engagement Applications Market Value (2025): USD 1.5 billion
  • Social Media Engagement Applications Market Forecast Value (2035): USD 4.8 billion
  • Social Media Engagement Applications Market Forecast CAGR: 12.7%
  • Leading Segment in Social Media Engagement Applications Market in 2025: Social Networks (32.2%)
  • Key Growth Regions in Social Media Engagement Applications Market: North America, Asia-Pacific, Europe
  • Top Key Players in Social Media Engagement Applications Market: Meta, Google, Microsoft, Amazon, Adobe, Oracle, IBM, Salesforce, LinkedIn, Twitter, Pinterest, Reddit

Social Media Engagement Applications Market Market Value Analysis

Social Media Engagement Applications Market Key Takeaways

Metric Value
Social Media Engagement Applications Market Estimated Value in (2025 E) USD 1.5 billion
Social Media Engagement Applications Market Forecast Value in (2035 F) USD 4.8 billion
Forecast CAGR (2025 to 2035) 12.7%

Why is the Social Media Engagement Applications Market Growing?

The social media engagement applications market is experiencing rapid expansion, supported by the increasing role of digital platforms in communication, content sharing, and community building. Growth is being fueled by rising smartphone penetration, improved internet connectivity, and evolving consumer behavior that prioritizes real-time interaction and personalized digital experiences.

Businesses across industries are investing heavily in social engagement platforms to strengthen customer relationships, enhance brand visibility, and leverage data-driven insights for targeted marketing strategies. The market is also benefiting from advancements in artificial intelligence, machine learning, and predictive analytics, which are enhancing user experience through personalized content delivery and automated engagement tools.

Increasing adoption of cloud-based solutions and integration of advanced features such as live streaming, in-app commerce, and immersive media are further shaping the market outlook As digital ecosystems expand and consumer expectations for instant interaction rise, the market for social media engagement applications is anticipated to maintain strong growth momentum, driven by innovation, scalability, and cross-platform integration.

Segmental Analysis

The social media engagement applications market is segmented by platforms, device usage, users, demography, and geographic regions. By platforms, social media engagement applications market is divided into Social Networks, Media Sharing, Microblogging, Blog Forums, Social News, and Others. In terms of device usage, social media engagement applications market is classified into Smartphone App, Desktop, Smartphone Web, Tablet Web, and Tablet App. Based on users, social media engagement applications market is segmented into Individual, Corporates, Government Agencies, and Other. By demography, social media engagement applications market is segmented into Age, Gender, Profession, and Others. Regionally, the social media engagement applications industry is classified into North America, Latin America, Western Europe, Eastern Europe, Balkan & Baltic Countries, Russia & Belarus, Central Asia, East Asia, South Asia & Pacific, and the Middle East & Africa.
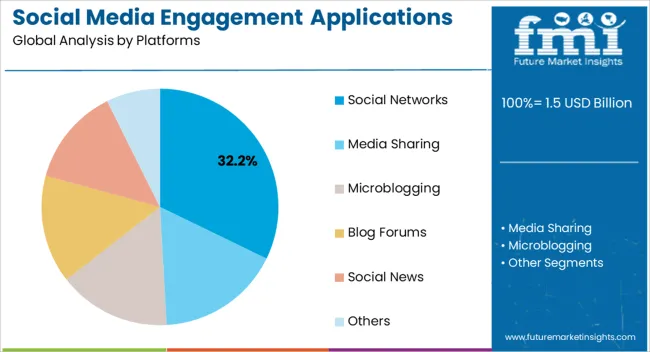
Insights into the Social Networks Platform Segment

Social Media Engagement Applications Market Analysis By Platforms

The social networks platform segment is projected to hold 32.2% of the social media engagement applications market revenue share in 2025, establishing itself as the leading platform type. Its dominance is being reinforced by the central role social networks play in enabling interaction, collaboration, and community building across global user bases. The segment benefits from its ability to support a wide range of engagement tools including content sharing, messaging, and interactive features, which encourage consistent user activity and retention.

Businesses are leveraging social networks to enhance marketing campaigns, build brand loyalty, and gain customer insights, contributing to sustained growth. Technological advancements such as artificial intelligence-driven recommendations, automated moderation, and advanced analytics are improving both user and advertiser experiences.

The scalability of social networks allows for seamless integration with external applications and services, further increasing their utility As user participation continues to rise and enterprises invest more heavily in social engagement strategies, the segment is expected to maintain its leadership position, driven by its adaptability and broad applicability across industries and demographics.
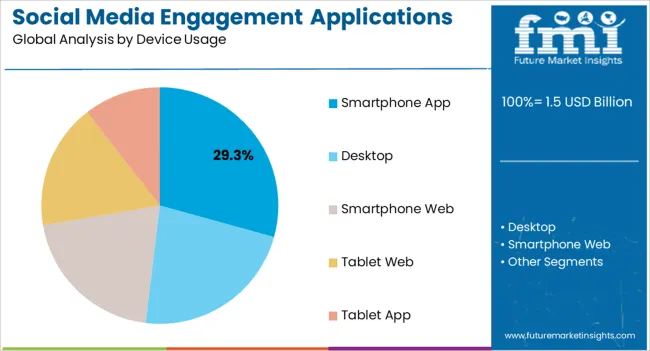
Insights into the Smartphone App Device Usage Segment

Social Media Engagement Applications Market Analysis By Device Usage

The smartphone app device usage segment is anticipated to account for 29.3% of the social media engagement applications market revenue share in 2025, making it the leading device usage category. This leadership is being driven by the widespread adoption of smartphones globally and the increasing preference of users for mobile-first engagement. The accessibility, portability, and convenience provided by mobile applications are reinforcing user dependence on smartphones for real-time interactions across social platforms.

Integration of advanced mobile features such as push notifications, biometric authentication, and geolocation services is further enhancing engagement levels by delivering seamless and personalized user experiences. The segment is also being supported by ongoing innovations in app design and optimization, which improve functionality while ensuring efficient data consumption and battery usage.

Enterprises are prioritizing mobile engagement strategies to align with consumer behavior, further driving adoption of smartphone-based applications As mobile internet penetration deepens and 5G deployment expands, smartphone applications are expected to remain at the forefront of social media engagement, maintaining their strong market position.
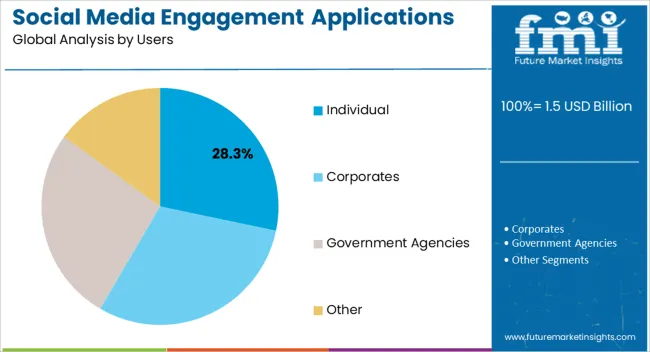
Insights into the Individual Users Segment

Social Media Engagement Applications Market Analysis By Users

The individual users segment is expected to capture 28.3% of the social media engagement applications market revenue share in 2025, positioning it as the leading user category. This dominance is being influenced by the significant number of individuals actively participating in digital communities for communication, entertainment, and content creation. Rising social connectivity, coupled with the demand for instant interaction and personalized experiences, is reinforcing adoption among individuals worldwide.

The segment’s growth is also supported by the increasing role of user-generated content in shaping online engagement, driving higher participation across platforms. Advancements in artificial intelligence and recommendation algorithms are tailoring content delivery to individual preferences, further strengthening usage patterns.

The ability of individuals to seamlessly interact across multiple devices and platforms is enhancing engagement frequency and consistency As digital lifestyles continue to expand and more users integrate social media applications into daily routines, the individual segment is expected to remain the most significant contributor to market growth, supported by evolving user expectations and ongoing platform innovation.

Market Overview

Social Media Engagement Applications Market Overview

Social Media Engagement Applications allows different kinds of users to exchange data which can be in the form of text, image, video, audio etc. via social media platforms such as Facebook, Twitter and LinkedIn etc. Because of variety of features and advantages offered by these media services, their user base have grown exponentially and is still growing.

A lot of established companies have their business model based on social media applications such as Facebook, WhatsApp, LinkedIn etc., while there are other companies who are attracting huge traffic from these social media applications which ultimately reflects as sales conversion.

With the advent of smartphone and its increasing penetration among the users, mobile applications now contributes major chunk of the revenue for social media companies. Even government organizations are actively participating in social media platforms either to advertise about their works, or to provide information about a particular topic to users or for opinion polls.

Increasing penetration among social media users have enabled many advertisement agencies, PR firms, mobile apps and service provider companies whose business model is based on social media engagement applications and this trend is expected to continue.
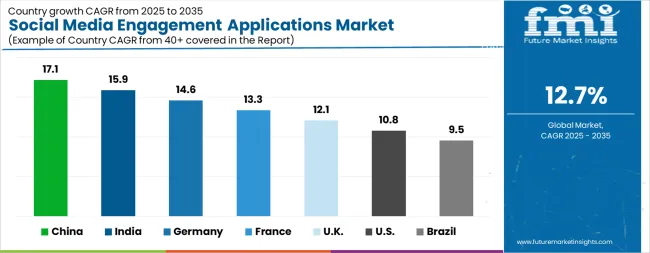
Analysis of Social Media Engagement Applications Market By Key Countries

Social Media Engagement Applications Market Cagr Analysis By Country

Country CAGR
China 17.1%
India 15.9%
Germany 14.6%
France 13.3%
UK 12.1%
USA 10.8%
Brazil 9.5%

Country-wise Analysis

The Social Media Engagement Applications Market is expected to register a CAGR of 12.7% during the forecast period, exhibiting varied country level momentum. China leads with the highest CAGR of 17.1%, followed by India at 15.9%. Developed markets such as Germany, France, and the UK continue to expand steadily, while the USA. is likely to grow at consistent rates. Brazil posts the lowest CAGR at 9.5%, yet still underscores a broadly positive trajectory for the global Social Media Engagement Applications Market. In 2024, Germany held a dominant revenue in the Western Europe market and is expected to grow with a CAGR of 14.6%. The USA. Social Media Engagement Applications Market is estimated to be valued at USD 544.9 million in 2025 and is anticipated to reach a valuation of USD 1.5 billion by 2035. Sales are projected to rise at a CAGR of 10.8% over the forecast period between 2025 and 2035. While Japan and South Korea markets are estimated to be valued at USD 78.6 million and USD 50.4 million respectively in 2025.
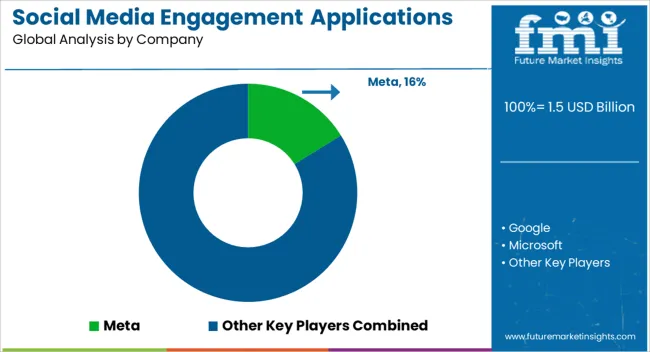
Key Players in the Social Media Engagement Applications Market

Social Media Engagement Applications Market Analysis By Company

  • Meta
  • Google
  • Microsoft
  • Amazon
  • Adobe
  • Oracle
  • IBM
  • Salesforce
  • LinkedIn
  • Twitter
  • Pinterest
  • Reddit

Scope of the Report

Item Value
Quantitative Units USD 1.5 Billion
Platforms Social Networks, Media Sharing, Microblogging, Blog Forums, Social News, and Others
Device Usage Smartphone App, Desktop, Smartphone Web, Tablet Web, and Tablet App
Users Individual, Corporates, Government Agencies, and Other
Demography Age, Gender, Profession, and Others
Regions Covered North America, Europe, Asia-Pacific, Latin America, Middle East & Africa
Country Covered United States, Canada, Germany, France, United Kingdom, China, Japan, India, Brazil, South Africa
Key Companies Profiled Meta, Google, Microsoft, Amazon, Adobe, Oracle, IBM, Salesforce, LinkedIn, Twitter, Pinterest, and Reddit

Social Media Engagement Applications Market by Segments

Platforms:

  • Social Networks
  • Media Sharing
  • Microblogging
  • Blog Forums
  • Social News
  • Others

Device Usage:

  • Smartphone App
  • Desktop
  • Smartphone Web
  • Tablet Web
  • Tablet App

Users:

  • Individual
  • Corporates
  • Government Agencies
  • Other

Demography:

  • Age
  • Gender
  • Profession
  • Others

Region:

  • North America
    • USA
    • Canada
    • Mexico
  • Latin America
    • Brazil
    • Chile
    • Rest of Latin America
  • Western Europe
    • Germany
    • UK
    • Italy
    • Spain
    • France
    • Nordic
    • BENELUX
    • Rest of Western Europe
  • Eastern Europe
    • Russia
    • Poland
    • Hungary
    • Balkan & Baltic
    • Rest of Eastern Europe
  • East Asia
    • China
    • Japan
    • South Korea
  • South Asia and Pacific
    • India
    • ASEAN
    • Australia & New Zealand
    • Rest of South Asia and Pacific
  • Middle East & Africa
    • Kingdom of Saudi Arabia
    • Other GCC Countries
    • Turkiye
    • South Africa
    • Other African Union
    • Rest of Middle East & Africa

Table of Content

  1. Executive Summary
    • Global Market Outlook
    • Demand-side Trends
    • Supply-side Trends
    • Technology Roadmap Analysis
    • Analysis and Recommendations
  2. Market Overview
    • Market Coverage / Taxonomy
    • Market Definition / Scope / Limitations
  3. Market Background
    • Market Dynamics
      • Drivers
      • Restraints
      • Opportunity
      • Trends
    • Scenario Forecast
      • Demand in Optimistic Scenario
      • Demand in Likely Scenario
      • Demand in Conservative Scenario
    • Opportunity Map Analysis
    • Product Life Cycle Analysis
    • Supply Chain Analysis
    • Investment Feasibility Matrix
    • Value Chain Analysis
    • PESTLE and Porter’s Analysis
    • Regulatory Landscape
    • Regional Parent Market Outlook
    • Production and Consumption Statistics
    • Import and Export Statistics
  4. Global Market Analysis 2020 to 2024 and Forecast, 2025 to 2035
    • Historical Market Size Value (USD Million) Analysis, 2020 to 2024
    • Current and Future Market Size Value (USD Million) Projections, 2025 to 2035
      • Y-o-Y Growth Trend Analysis
      • Absolute $ Opportunity Analysis
  5. Global Market Pricing Analysis 2020 to 2024 and Forecast 2025 to 2035
  6. Global Market Analysis 2020 to 2024 and Forecast 2025 to 2035, By Platforms
    • Introduction / Key Findings
    • Historical Market Size Value (USD Million) Analysis By Platforms , 2020 to 2024
    • Current and Future Market Size Value (USD Million) Analysis and Forecast By Platforms , 2025 to 2035
      • Social Networks
      • Media Sharing
      • Microblogging
      • Blog Forums
      • Social News
      • Others
    • Y-o-Y Growth Trend Analysis By Platforms , 2020 to 2024
    • Absolute $ Opportunity Analysis By Platforms , 2025 to 2035
  7. Global Market Analysis 2020 to 2024 and Forecast 2025 to 2035, By Device Usage
    • Introduction / Key Findings
    • Historical Market Size Value (USD Million) Analysis By Device Usage, 2020 to 2024
    • Current and Future Market Size Value (USD Million) Analysis and Forecast By Device Usage, 2025 to 2035
      • Smartphone App
      • Desktop
      • Smartphone Web
      • Tablet Web
      • Tablet App
    • Y-o-Y Growth Trend Analysis By Device Usage, 2020 to 2024
    • Absolute $ Opportunity Analysis By Device Usage, 2025 to 2035
  8. Global Market Analysis 2020 to 2024 and Forecast 2025 to 2035, By Users
    • Introduction / Key Findings
    • Historical Market Size Value (USD Million) Analysis By Users, 2020 to 2024
    • Current and Future Market Size Value (USD Million) Analysis and Forecast By Users, 2025 to 2035
      • Individual
      • Corporates
      • Government Agencies
      • Other
    • Y-o-Y Growth Trend Analysis By Users, 2020 to 2024
    • Absolute $ Opportunity Analysis By Users, 2025 to 2035
  9. Global Market Analysis 2020 to 2024 and Forecast 2025 to 2035, By Demography
    • Introduction / Key Findings
    • Historical Market Size Value (USD Million) Analysis By Demography, 2020 to 2024
    • Current and Future Market Size Value (USD Million) Analysis and Forecast By Demography, 2025 to 2035
      • Age
      • Gender
      • Profession
      • Others
    • Y-o-Y Growth Trend Analysis By Demography, 2020 to 2024
    • Absolute $ Opportunity Analysis By Demography, 2025 to 2035
  10. Global Market Analysis 2020 to 2024 and Forecast 2025 to 2035, By Region
    • Introduction
    • Historical Market Size Value (USD Million) Analysis By Region, 2020 to 2024
    • Current Market Size Value (USD Million) Analysis and Forecast By Region, 2025 to 2035
      • North America
      • Latin America
      • Western Europe
      • Eastern Europe
      • East Asia
      • South Asia and Pacific
      • Middle East & Africa
    • Market Attractiveness Analysis By Region
  11. North America Market Analysis 2020 to 2024 and Forecast 2025 to 2035, By Country
    • Historical Market Size Value (USD Million) Trend Analysis By Market Taxonomy, 2020 to 2024
    • Market Size Value (USD Million) Forecast By Market Taxonomy, 2025 to 2035
      • By Country
        • USA
        • Canada
        • Mexico
      • By Platforms
      • By Device Usage
      • By Users
      • By Demography
    • Market Attractiveness Analysis
      • By Country
      • By Platforms
      • By Device Usage
      • By Users
      • By Demography
    • Key Takeaways
  12. Latin America Market Analysis 2020 to 2024 and Forecast 2025 to 2035, By Country
    • Historical Market Size Value (USD Million) Trend Analysis By Market Taxonomy, 2020 to 2024
    • Market Size Value (USD Million) Forecast By Market Taxonomy, 2025 to 2035
      • By Country
        • Brazil
        • Chile
        • Rest of Latin America
      • By Platforms
      • By Device Usage
      • By Users
      • By Demography
    • Market Attractiveness Analysis
      • By Country
      • By Platforms
      • By Device Usage
      • By Users
      • By Demography
    • Key Takeaways
  13. Western Europe Market Analysis 2020 to 2024 and Forecast 2025 to 2035, By Country
    • Historical Market Size Value (USD Million) Trend Analysis By Market Taxonomy, 2020 to 2024
    • Market Size Value (USD Million) Forecast By Market Taxonomy, 2025 to 2035
      • By Country
        • Germany
        • UK
        • Italy
        • Spain
        • France
        • Nordic
        • BENELUX
        • Rest of Western Europe
      • By Platforms
      • By Device Usage
      • By Users
      • By Demography
    • Market Attractiveness Analysis
      • By Country
      • By Platforms
      • By Device Usage
      • By Users
      • By Demography
    • Key Takeaways
  14. Eastern Europe Market Analysis 2020 to 2024 and Forecast 2025 to 2035, By Country
    • Historical Market Size Value (USD Million) Trend Analysis By Market Taxonomy, 2020 to 2024
    • Market Size Value (USD Million) Forecast By Market Taxonomy, 2025 to 2035
      • By Country
        • Russia
        • Poland
        • Hungary
        • Balkan & Baltic
        • Rest of Eastern Europe
      • By Platforms
      • By Device Usage
      • By Users
      • By Demography
    • Market Attractiveness Analysis
      • By Country
      • By Platforms
      • By Device Usage
      • By Users
      • By Demography
    • Key Takeaways
  15. East Asia Market Analysis 2020 to 2024 and Forecast 2025 to 2035, By Country
    • Historical Market Size Value (USD Million) Trend Analysis By Market Taxonomy, 2020 to 2024
    • Market Size Value (USD Million) Forecast By Market Taxonomy, 2025 to 2035
      • By Country
        • China
        • Japan
        • South Korea
      • By Platforms
      • By Device Usage
      • By Users
      • By Demography
    • Market Attractiveness Analysis
      • By Country
      • By Platforms
      • By Device Usage
      • By Users
      • By Demography
    • Key Takeaways
  16. South Asia and Pacific Market Analysis 2020 to 2024 and Forecast 2025 to 2035, By Country
    • Historical Market Size Value (USD Million) Trend Analysis By Market Taxonomy, 2020 to 2024
    • Market Size Value (USD Million) Forecast By Market Taxonomy, 2025 to 2035
      • By Country
        • India
        • ASEAN
        • Australia & New Zealand
        • Rest of South Asia and Pacific
      • By Platforms
      • By Device Usage
      • By Users
      • By Demography
    • Market Attractiveness Analysis
      • By Country
      • By Platforms
      • By Device Usage
      • By Users
      • By Demography
    • Key Takeaways
  17. Middle East & Africa Market Analysis 2020 to 2024 and Forecast 2025 to 2035, By Country
    • Historical Market Size Value (USD Million) Trend Analysis By Market Taxonomy, 2020 to 2024
    • Market Size Value (USD Million) Forecast By Market Taxonomy, 2025 to 2035
      • By Country
        • Kingdom of Saudi Arabia
        • Other GCC Countries
        • Turkiye
        • South Africa
        • Other African Union
        • Rest of Middle East & Africa
      • By Platforms
      • By Device Usage
      • By Users
      • By Demography
    • Market Attractiveness Analysis
      • By Country
      • By Platforms
      • By Device Usage
      • By Users
      • By Demography
    • Key Takeaways
  18. Key Countries Market Analysis
    • USA
      • Pricing Analysis
      • Market Share Analysis, 2024
        • By Platforms
        • By Device Usage
        • By Users
        • By Demography
    • Canada
      • Pricing Analysis
      • Market Share Analysis, 2024
        • By Platforms
        • By Device Usage
        • By Users
        • By Demography
    • Mexico
      • Pricing Analysis
      • Market Share Analysis, 2024
        • By Platforms
        • By Device Usage
        • By Users
        • By Demography
    • Brazil
      • Pricing Analysis
      • Market Share Analysis, 2024
        • By Platforms
        • By Device Usage
        • By Users
        • By Demography
    • Chile
      • Pricing Analysis
      • Market Share Analysis, 2024
        • By Platforms
        • By Device Usage
        • By Users
        • By Demography
    • Germany
      • Pricing Analysis
      • Market Share Analysis, 2024
        • By Platforms
        • By Device Usage
        • By Users
        • By Demography
    • UK
      • Pricing Analysis
      • Market Share Analysis, 2024
        • By Platforms
        • By Device Usage
        • By Users
        • By Demography
    • Italy
      • Pricing Analysis
      • Market Share Analysis, 2024
        • By Platforms
        • By Device Usage
        • By Users
        • By Demography
    • Spain
      • Pricing Analysis
      • Market Share Analysis, 2024
        • By Platforms
        • By Device Usage
        • By Users
        • By Demography
    • France
      • Pricing Analysis
      • Market Share Analysis, 2024
        • By Platforms
        • By Device Usage
        • By Users
        • By Demography
    • India
      • Pricing Analysis
      • Market Share Analysis, 2024
        • By Platforms
        • By Device Usage
        • By Users
        • By Demography
    • ASEAN
      • Pricing Analysis
      • Market Share Analysis, 2024
        • By Platforms
        • By Device Usage
        • By Users
        • By Demography
    • Australia & New Zealand
      • Pricing Analysis
      • Market Share Analysis, 2024
        • By Platforms
        • By Device Usage
        • By Users
        • By Demography
    • China
      • Pricing Analysis
      • Market Share Analysis, 2024
        • By Platforms
        • By Device Usage
        • By Users
        • By Demography
    • Japan
      • Pricing Analysis
      • Market Share Analysis, 2024
        • By Platforms
        • By Device Usage
        • By Users
        • By Demography
    • South Korea
      • Pricing Analysis
      • Market Share Analysis, 2024
        • By Platforms
        • By Device Usage
        • By Users
        • By Demography
    • Russia
      • Pricing Analysis
      • Market Share Analysis, 2024
        • By Platforms
        • By Device Usage
        • By Users
        • By Demography
    • Poland
      • Pricing Analysis
      • Market Share Analysis, 2024
        • By Platforms
        • By Device Usage
        • By Users
        • By Demography
    • Hungary
      • Pricing Analysis
      • Market Share Analysis, 2024
        • By Platforms
        • By Device Usage
        • By Users
        • By Demography
    • Kingdom of Saudi Arabia
      • Pricing Analysis
      • Market Share Analysis, 2024
        • By Platforms
        • By Device Usage
        • By Users
        • By Demography
    • Turkiye
      • Pricing Analysis
      • Market Share Analysis, 2024
        • By Platforms
        • By Device Usage
        • By Users
        • By Demography
    • South Africa
      • Pricing Analysis
      • Market Share Analysis, 2024
        • By Platforms
        • By Device Usage
        • By Users
        • By Demography
  19. Market Structure Analysis
    • Competition Dashboard
    • Competition Benchmarking
    • Market Share Analysis of Top Players
      • By Regional
      • By Platforms
      • By Device Usage
      • By Users
      • By Demography
  20. Competition Analysis
    • Competition Deep Dive
      • Meta
        • Overview
        • Product Portfolio
        • Profitability by Market Segments (Product/Age /Sales Channel/Region)
        • Sales Footprint
        • Strategy Overview
          • Marketing Strategy
          • Product Strategy
          • Channel Strategy
      • Google
      • Microsoft
      • Amazon
      • Adobe
      • Oracle
      • IBM
      • Salesforce
      • LinkedIn
      • Twitter
      • Pinterest
      • Reddit
  21. Assumptions & Acronyms Used
  22. Research Methodology

List of Tables

  • Table 1: Global Market Value (USD Million) Forecast by Region, 2020 to 2035
  • Table 2: Global Market Value (USD Million) Forecast by Platforms , 2020 to 2035
  • Table 3: Global Market Value (USD Million) Forecast by Device Usage, 2020 to 2035
  • Table 4: Global Market Value (USD Million) Forecast by Users, 2020 to 2035
  • Table 5: Global Market Value (USD Million) Forecast by Demography, 2020 to 2035
  • Table 6: North America Market Value (USD Million) Forecast by Country, 2020 to 2035
  • Table 7: North America Market Value (USD Million) Forecast by Platforms , 2020 to 2035
  • Table 8: North America Market Value (USD Million) Forecast by Device Usage, 2020 to 2035
  • Table 9: North America Market Value (USD Million) Forecast by Users, 2020 to 2035
  • Table 10: North America Market Value (USD Million) Forecast by Demography, 2020 to 2035
  • Table 11: Latin America Market Value (USD Million) Forecast by Country, 2020 to 2035
  • Table 12: Latin America Market Value (USD Million) Forecast by Platforms , 2020 to 2035
  • Table 13: Latin America Market Value (USD Million) Forecast by Device Usage, 2020 to 2035
  • Table 14: Latin America Market Value (USD Million) Forecast by Users, 2020 to 2035
  • Table 15: Latin America Market Value (USD Million) Forecast by Demography, 2020 to 2035
  • Table 16: Western Europe Market Value (USD Million) Forecast by Country, 2020 to 2035
  • Table 17: Western Europe Market Value (USD Million) Forecast by Platforms , 2020 to 2035
  • Table 18: Western Europe Market Value (USD Million) Forecast by Device Usage, 2020 to 2035
  • Table 19: Western Europe Market Value (USD Million) Forecast by Users, 2020 to 2035
  • Table 20: Western Europe Market Value (USD Million) Forecast by Demography, 2020 to 2035
  • Table 21: Eastern Europe Market Value (USD Million) Forecast by Country, 2020 to 2035
  • Table 22: Eastern Europe Market Value (USD Million) Forecast by Platforms , 2020 to 2035
  • Table 23: Eastern Europe Market Value (USD Million) Forecast by Device Usage, 2020 to 2035
  • Table 24: Eastern Europe Market Value (USD Million) Forecast by Users, 2020 to 2035
  • Table 25: Eastern Europe Market Value (USD Million) Forecast by Demography, 2020 to 2035
  • Table 26: East Asia Market Value (USD Million) Forecast by Country, 2020 to 2035
  • Table 27: East Asia Market Value (USD Million) Forecast by Platforms , 2020 to 2035
  • Table 28: East Asia Market Value (USD Million) Forecast by Device Usage, 2020 to 2035
  • Table 29: East Asia Market Value (USD Million) Forecast by Users, 2020 to 2035
  • Table 30: East Asia Market Value (USD Million) Forecast by Demography, 2020 to 2035
  • Table 31: South Asia and Pacific Market Value (USD Million) Forecast by Country, 2020 to 2035
  • Table 32: South Asia and Pacific Market Value (USD Million) Forecast by Platforms , 2020 to 2035
  • Table 33: South Asia and Pacific Market Value (USD Million) Forecast by Device Usage, 2020 to 2035
  • Table 34: South Asia and Pacific Market Value (USD Million) Forecast by Users, 2020 to 2035
  • Table 35: South Asia and Pacific Market Value (USD Million) Forecast by Demography, 2020 to 2035
  • Table 36: Middle East & Africa Market Value (USD Million) Forecast by Country, 2020 to 2035
  • Table 37: Middle East & Africa Market Value (USD Million) Forecast by Platforms , 2020 to 2035
  • Table 38: Middle East & Africa Market Value (USD Million) Forecast by Device Usage, 2020 to 2035
  • Table 39: Middle East & Africa Market Value (USD Million) Forecast by Users, 2020 to 2035
  • Table 40: Middle East & Africa Market Value (USD Million) Forecast by Demography, 2020 to 2035

List of Figures

  • Figure 1: Global Market Pricing Analysis
  • Figure 2: Global Market Value (USD Million) Forecast 2020-2035
  • Figure 3: Global Market Value Share and BPS Analysis by Platforms , 2025 and 2035
  • Figure 4: Global Market Y-o-Y Growth Comparison by Platforms , 2025-2035
  • Figure 5: Global Market Attractiveness Analysis by Platforms
  • Figure 6: Global Market Value Share and BPS Analysis by Device Usage, 2025 and 2035
  • Figure 7: Global Market Y-o-Y Growth Comparison by Device Usage, 2025-2035
  • Figure 8: Global Market Attractiveness Analysis by Device Usage
  • Figure 9: Global Market Value Share and BPS Analysis by Users, 2025 and 2035
  • Figure 10: Global Market Y-o-Y Growth Comparison by Users, 2025-2035
  • Figure 11: Global Market Attractiveness Analysis by Users
  • Figure 12: Global Market Value Share and BPS Analysis by Demography, 2025 and 2035
  • Figure 13: Global Market Y-o-Y Growth Comparison by Demography, 2025-2035
  • Figure 14: Global Market Attractiveness Analysis by Demography
  • Figure 15: Global Market Value (USD Million) Share and BPS Analysis by Region, 2025 and 2035
  • Figure 16: Global Market Y-o-Y Growth Comparison by Region, 2025-2035
  • Figure 17: Global Market Attractiveness Analysis by Region
  • Figure 18: North America Market Incremental Dollar Opportunity, 2025-2035
  • Figure 19: Latin America Market Incremental Dollar Opportunity, 2025-2035
  • Figure 20: Western Europe Market Incremental Dollar Opportunity, 2025-2035
  • Figure 21: Eastern Europe Market Incremental Dollar Opportunity, 2025-2035
  • Figure 22: East Asia Market Incremental Dollar Opportunity, 2025-2035
  • Figure 23: South Asia and Pacific Market Incremental Dollar Opportunity, 2025-2035
  • Figure 24: Middle East & Africa Market Incremental Dollar Opportunity, 2025-2035
  • Figure 25: North America Market Value Share and BPS Analysis by Country, 2025 and 2035
  • Figure 26: North America Market Value Share and BPS Analysis by Platforms , 2025 and 2035
  • Figure 27: North America Market Y-o-Y Growth Comparison by Platforms , 2025-2035
  • Figure 28: North America Market Attractiveness Analysis by Platforms
  • Figure 29: North America Market Value Share and BPS Analysis by Device Usage, 2025 and 2035
  • Figure 30: North America Market Y-o-Y Growth Comparison by Device Usage, 2025-2035
  • Figure 31: North America Market Attractiveness Analysis by Device Usage
  • Figure 32: North America Market Value Share and BPS Analysis by Users, 2025 and 2035
  • Figure 33: North America Market Y-o-Y Growth Comparison by Users, 2025-2035
  • Figure 34: North America Market Attractiveness Analysis by Users
  • Figure 35: North America Market Value Share and BPS Analysis by Demography, 2025 and 2035
  • Figure 36: North America Market Y-o-Y Growth Comparison by Demography, 2025-2035
  • Figure 37: North America Market Attractiveness Analysis by Demography
  • Figure 38: Latin America Market Value Share and BPS Analysis by Country, 2025 and 2035
  • Figure 39: Latin America Market Value Share and BPS Analysis by Platforms , 2025 and 2035
  • Figure 40: Latin America Market Y-o-Y Growth Comparison by Platforms , 2025-2035
  • Figure 41: Latin America Market Attractiveness Analysis by Platforms
  • Figure 42: Latin America Market Value Share and BPS Analysis by Device Usage, 2025 and 2035
  • Figure 43: Latin America Market Y-o-Y Growth Comparison by Device Usage, 2025-2035
  • Figure 44: Latin America Market Attractiveness Analysis by Device Usage
  • Figure 45: Latin America Market Value Share and BPS Analysis by Users, 2025 and 2035
  • Figure 46: Latin America Market Y-o-Y Growth Comparison by Users, 2025-2035
  • Figure 47: Latin America Market Attractiveness Analysis by Users
  • Figure 48: Latin America Market Value Share and BPS Analysis by Demography, 2025 and 2035
  • Figure 49: Latin America Market Y-o-Y Growth Comparison by Demography, 2025-2035
  • Figure 50: Latin America Market Attractiveness Analysis by Demography
  • Figure 51: Western Europe Market Value Share and BPS Analysis by Country, 2025 and 2035
  • Figure 52: Western Europe Market Value Share and BPS Analysis by Platforms , 2025 and 2035
  • Figure 53: Western Europe Market Y-o-Y Growth Comparison by Platforms , 2025-2035
  • Figure 54: Western Europe Market Attractiveness Analysis by Platforms
  • Figure 55: Western Europe Market Value Share and BPS Analysis by Device Usage, 2025 and 2035
  • Figure 56: Western Europe Market Y-o-Y Growth Comparison by Device Usage, 2025-2035
  • Figure 57: Western Europe Market Attractiveness Analysis by Device Usage
  • Figure 58: Western Europe Market Value Share and BPS Analysis by Users, 2025 and 2035
  • Figure 59: Western Europe Market Y-o-Y Growth Comparison by Users, 2025-2035
  • Figure 60: Western Europe Market Attractiveness Analysis by Users
  • Figure 61: Western Europe Market Value Share and BPS Analysis by Demography, 2025 and 2035
  • Figure 62: Western Europe Market Y-o-Y Growth Comparison by Demography, 2025-2035
  • Figure 63: Western Europe Market Attractiveness Analysis by Demography
  • Figure 64: Eastern Europe Market Value Share and BPS Analysis by Country, 2025 and 2035
  • Figure 65: Eastern Europe Market Value Share and BPS Analysis by Platforms , 2025 and 2035
  • Figure 66: Eastern Europe Market Y-o-Y Growth Comparison by Platforms , 2025-2035
  • Figure 67: Eastern Europe Market Attractiveness Analysis by Platforms
  • Figure 68: Eastern Europe Market Value Share and BPS Analysis by Device Usage, 2025 and 2035
  • Figure 69: Eastern Europe Market Y-o-Y Growth Comparison by Device Usage, 2025-2035
  • Figure 70: Eastern Europe Market Attractiveness Analysis by Device Usage
  • Figure 71: Eastern Europe Market Value Share and BPS Analysis by Users, 2025 and 2035
  • Figure 72: Eastern Europe Market Y-o-Y Growth Comparison by Users, 2025-2035
  • Figure 73: Eastern Europe Market Attractiveness Analysis by Users
  • Figure 74: Eastern Europe Market Value Share and BPS Analysis by Demography, 2025 and 2035
  • Figure 75: Eastern Europe Market Y-o-Y Growth Comparison by Demography, 2025-2035
  • Figure 76: Eastern Europe Market Attractiveness Analysis by Demography
  • Figure 77: East Asia Market Value Share and BPS Analysis by Country, 2025 and 2035
  • Figure 78: East Asia Market Value Share and BPS Analysis by Platforms , 2025 and 2035
  • Figure 79: East Asia Market Y-o-Y Growth Comparison by Platforms , 2025-2035
  • Figure 80: East Asia Market Attractiveness Analysis by Platforms
  • Figure 81: East Asia Market Value Share and BPS Analysis by Device Usage, 2025 and 2035
  • Figure 82: East Asia Market Y-o-Y Growth Comparison by Device Usage, 2025-2035
  • Figure 83: East Asia Market Attractiveness Analysis by Device Usage
  • Figure 84: East Asia Market Value Share and BPS Analysis by Users, 2025 and 2035
  • Figure 85: East Asia Market Y-o-Y Growth Comparison by Users, 2025-2035
  • Figure 86: East Asia Market Attractiveness Analysis by Users
  • Figure 87: East Asia Market Value Share and BPS Analysis by Demography, 2025 and 2035
  • Figure 88: East Asia Market Y-o-Y Growth Comparison by Demography, 2025-2035
  • Figure 89: East Asia Market Attractiveness Analysis by Demography
  • Figure 90: South Asia and Pacific Market Value Share and BPS Analysis by Country, 2025 and 2035
  • Figure 91: South Asia and Pacific Market Value Share and BPS Analysis by Platforms , 2025 and 2035
  • Figure 92: South Asia and Pacific Market Y-o-Y Growth Comparison by Platforms , 2025-2035
  • Figure 93: South Asia and Pacific Market Attractiveness Analysis by Platforms
  • Figure 94: South Asia and Pacific Market Value Share and BPS Analysis by Device Usage, 2025 and 2035
  • Figure 95: South Asia and Pacific Market Y-o-Y Growth Comparison by Device Usage, 2025-2035
  • Figure 96: South Asia and Pacific Market Attractiveness Analysis by Device Usage
  • Figure 97: South Asia and Pacific Market Value Share and BPS Analysis by Users, 2025 and 2035
  • Figure 98: South Asia and Pacific Market Y-o-Y Growth Comparison by Users, 2025-2035
  • Figure 99: South Asia and Pacific Market Attractiveness Analysis by Users
  • Figure 100: South Asia and Pacific Market Value Share and BPS Analysis by Demography, 2025 and 2035
  • Figure 101: South Asia and Pacific Market Y-o-Y Growth Comparison by Demography, 2025-2035
  • Figure 102: South Asia and Pacific Market Attractiveness Analysis by Demography
  • Figure 103: Middle East & Africa Market Value Share and BPS Analysis by Country, 2025 and 2035
  • Figure 104: Middle East & Africa Market Value Share and BPS Analysis by Platforms , 2025 and 2035
  • Figure 105: Middle East & Africa Market Y-o-Y Growth Comparison by Platforms , 2025-2035
  • Figure 106: Middle East & Africa Market Attractiveness Analysis by Platforms
  • Figure 107: Middle East & Africa Market Value Share and BPS Analysis by Device Usage, 2025 and 2035
  • Figure 108: Middle East & Africa Market Y-o-Y Growth Comparison by Device Usage, 2025-2035
  • Figure 109: Middle East & Africa Market Attractiveness Analysis by Device Usage
  • Figure 110: Middle East & Africa Market Value Share and BPS Analysis by Users, 2025 and 2035
  • Figure 111: Middle East & Africa Market Y-o-Y Growth Comparison by Users, 2025-2035
  • Figure 112: Middle East & Africa Market Attractiveness Analysis by Users
  • Figure 113: Middle East & Africa Market Value Share and BPS Analysis by Demography, 2025 and 2035
  • Figure 114: Middle East & Africa Market Y-o-Y Growth Comparison by Demography, 2025-2035
  • Figure 115: Middle East & Africa Market Attractiveness Analysis by Demography
  • Figure 116: Global Market - Tier Structure Analysis
  • Figure 117: Global Market - Company Share Analysis

Frequently Asked Questions

How big is the social media engagement applications market in 2025?

The global social media engagement applications market is estimated to be valued at USD 1.5 billion in 2025.

What will be the size of social media engagement applications market in 2035?

The market size for the social media engagement applications market is projected to reach USD 4.8 billion by 2035.

How much will be the social media engagement applications market growth between 2025 and 2035?

The social media engagement applications market is expected to grow at a 12.7% CAGR between 2025 and 2035.

What are the key product types in the social media engagement applications market?

The key product types in social media engagement applications market are social networks, media sharing, microblogging, blog forums, social news and others.

Which device usage segment to contribute significant share in the social media engagement applications market in 2025?

In terms of device usage, smartphone app segment to command 29.3% share in the social media engagement applications market in 2025.

Explore Similar Insights

Future Market Insights

Social Media Engagement Applications Market

Chat With MaRIA

Chat With

MaRIA

Hi There, I am MaRIA, Your Market Research Intelligence Assistant. How may I help you?