Social TV Market Size and Share Forecast Outlook 2025 to 2035

The Social TV Market is estimated to be valued at USD 2.8 billion in 2025 and is projected to reach USD 8.1 billion by 2035, registering a compound annual growth rate (CAGR) of 11.4% over the forecast period.
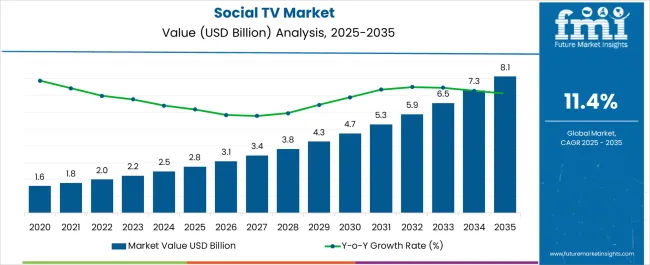
Quick Stats for Social TV Market

  • Social TV Market Industry Value (2025): USD 2.8 billion
  • Social TV Market Forecast Value (2035): USD 8.1 billion
  • Social TV Market Forecast CAGR: 11.4%
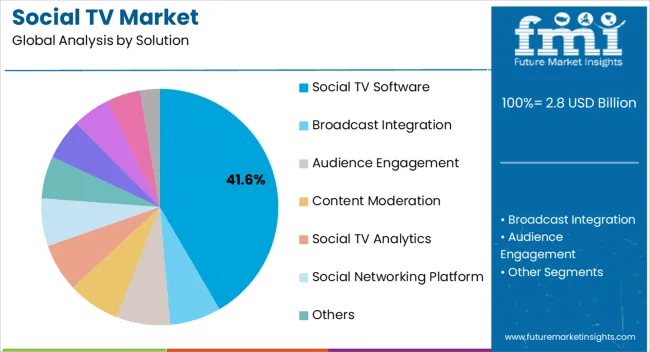
  • Leading Segment in Social TV Market in 2025: Social TV Software (41.6%)
  • Key Growth Region in Social TV Market: North America, Asia-Pacific, Europe
  • Top Key Players in Social TV Market: Talkwalker Inc., Flowics, SentabTV, Telescope, Haier Group, Hitachi, Ltd., iPowow Ltd, Sharp Corporation, Snipperwall, Socialbakers Ltd.

Social Tv Market Market Value Analysis

Metric Value
Social TV Market Estimated Value in (2025 E) USD 2.8 billion
Social TV Market Forecast Value in (2035 F) USD 8.1 billion
Forecast CAGR (2025 to 2035) 11.4%

Rationale for Segmental Growth in the Social TV Market

The social TV market is expanding rapidly, reflecting the convergence of broadcasting, digital streaming, and interactive social engagement. Industry reports and media company disclosures have emphasized the growing integration of real-time audience participation features within television and streaming platforms, reshaping how viewers consume content. Broadcasters and streaming providers are increasingly leveraging social TV solutions to boost viewer engagement, retention, and advertising value.

Technological advancements such as second-screen applications, live polls, and synchronized social media feeds have improved interactive experiences, strengthening audience involvement during live events. Strategic collaborations between media firms and technology providers have accelerated the deployment of scalable solutions across global markets.

The demand for social TV has been further amplified by the surge in live programming, sports broadcasts, and reality shows, which rely heavily on real-time audience interaction. Looking ahead, the market is expected to sustain momentum through AI-driven personalization, predictive analytics, and deeper integration of social networks with traditional broadcasting, positioning social TV as a core enabler of immersive entertainment experiences.
Segmental Analysis

Insights into the Solution Segment: Social TV Software

Social Tv Market Analysis By Solution

The Social TV Software segment is projected to account for 41.60% of the social TV market revenue in 2025, establishing itself as the leading solution category. Growth of this segment has been driven by the ability of software platforms to deliver scalable, customizable, and interactive features that enhance viewer participation.

Broadcasters and streaming providers have increasingly implemented software-driven solutions to integrate social media conversations, real-time analytics, and personalized content feeds. Software innovations have also supported the seamless integration of advertising and sponsorships into interactive formats, creating additional revenue streams for media companies.

The flexibility of cloud-based platforms has enabled rapid deployment and real-time updates, making software solutions highly adaptable to evolving viewer preferences. As demand for interactive programming intensifies, the Social TV Software segment is expected to maintain its leadership, supported by continuous advancements in AI, machine learning, and data-driven engagement technologies.
Insights into the Application Segment: Sports

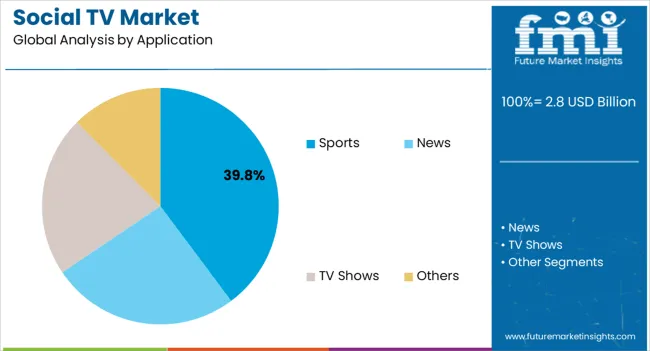
Social Tv Market Analysis By Application

The Sports segment is projected to contribute 39.80% of the social TV market revenue in 2025, positioning itself as the dominant application category. This growth has been driven by the inherently interactive nature of sports broadcasts, where real-time commentary, live statistics, and fan discussions play a central role in enhancing viewer experiences.

Sports leagues, broadcasters, and streaming services have increasingly utilized social TV to integrate live polls, fantasy sports updates, and social media interactions, creating immersive experiences for fans. Reports from sports media organizations have highlighted that social TV significantly boosts audience engagement during major events, driving higher advertising revenues and sponsorship opportunities.

The global appeal of live sports, coupled with fans’ growing reliance on mobile devices for second-screen interactions, has reinforced the segment’s strength. With the continued expansion of digital sports broadcasting and real-time fan engagement strategies, the Sports segment is expected to remain at the forefront of social TV adoption.

Comparison of Historical Performance 2020 to 2025 vs Forecast Outlook 2025 to 2035

An 11.5% CAGR was experienced between 2020 and 2025 in the social TV market. Global demand for Social TV is predicted to increase at a CAGR of 12% from 2025 to 2035.

The popularity of sporting events is evident among a wide range of individuals. According to statistics, Americans spent more than 1.6 billion dollars on sports events from 2020 to 2020.

A significant spike in sales was caused by a rise in TV viewership following the COVID-19 outbreak last year. Due to social conventions that discourage people from leaving their homes, e-commerce firms have been shipping non-essential items for some time now.

Historical CAGR from 2020 to 2025 11.5%
Forecast CAGR from 2025 to 2035 12%

Researchers found that 40% of TV viewers engage in social media while watching television. Viewers are now sharing and talking about specific shows on social media as they watch them, which has led to a new phenomenal growth.

Key Drivers Fueling the Social TV Market

  • A ready-made audience for social TV has been created by the widespread adoption of social media platforms. Considering that users are already familiar with these platforms, integrating them into television viewing should be easy.
  • As smartphones and tablets have become more popular, viewers are interacting with a television on a second screen. In real-time, viewers can participate in polls, interact with content, and communicate with each other through second screen apps.
  • OTT services and growing disposable income are expected to be favorable drivers of industry growth. Social TV sets are replacing conventional TVs in families, and people are changing their viewing habits.
  • With social TV's ability to harness real-time interactions, it has become very popular. As viewers watch TV, they can share opinions, reactions, and thoughts with an audience globally or locally. A sense of community is fostered as a result of this real-time engagement.
  • Depending on a viewer's social network activity and preferences, social TV platforms will often suggest shows and movies. Viewers can discover new content through personalized content discovery.
  • Sporting events, award shows, and other live events have been major drivers of social TV. As a result, these events are ideal for integration of social TV because viewers enjoy discussing, reacting to, and sharing their feelings.
  • Content creators and broadcasters can engage their audiences through social TV. Watchers are engaged even when the main content is not shown with live interactive questions and polling sessions.
  • Sponsored hashtag campaigns, product placements, and interactive advertisements are among the innovative ways social TV advertising has become. Real-time advertising technology allows viewers and brands to interact with each other in real time.
  • Through social TV interactions, companies can gain valuable insights into viewer behavior and preferences. Observations from broadcasters and advertisers are used to refine content and marketing strategies.
  • With the popularity of social TV, user-generated content has become a crucial part of the viewing experience, including comments, reactions, and fan art. This will increase engagement and build a sense of community.
  • Social TV experiences have become more popular as technology advances, which includes higher streaming quality, faster internet connections, and more powerful devices.
  • Social TV has become more streamlined and intuitive with dedicated apps and platforms.

Restraints Affecting the Growth of the Social TV Market

  • Users of social TV platforms can become concerned about privacy when sharing viewing preferences and habits. A data breach or privacy violation may discourage users from sharing information about themselves or their viewing habits.
  • The preferences and behaviors of consumers can change rapidly. This ight further restrain the market.
  • Copyright and licensing issues can sometimes arise when social media is integrated with television content. Copyrighted material can be infringement on social platforms through clips, images, or discussions.
  • A social TV platform that encourages user-generated content can pose content moderation challenges.
  • Social TV experiences can be limited for users without high-speed internet access or devices with smart capabilities. Despite social TV's potential to expand, the digital divide can impede its adoption.
  • Marketers can have difficulty finding effective social TV monetization strategies.
  • Social TV can increase user engagement but can also distract users with excessive information. Commenting, liking, and sharing may become overwhelming, detracting from the viewing experience.
  • Online content, advertising, and broadcasting regulations vary across different regions and countries. Social TV can be complicated and costly to implement while adhering to these regulations.
  • Numerous social TV players compete for user attention and engagement in the highly competitive social TV market. Streaming services, TV networks, and social media platforms all compete for market share, making newcomers' experience challenging.

Analysis of Top Countries Using Social TV Platforms

The below table showcases revenues in terms of the top 5 leading countries, spearheaded by the United States and the India. Through 2035, these two countries will dominate the market, with a size of USD 8.1 billion and USD 2 billion.

Expected Market Values in 2035

South Korea USD 1.3 billion
India USD 2 billion
United States USD 8.1 billion
China USD 1 billion
United Kingdom USD 900 million

Forecast CAGRs from 2025 to 2035

South Korea 7.4%
India 11.8%
United States 9%
China 6.2%
United Kingdom 6.8%

TV Engages More Socially as Streaming Services Proliferate in United States

According to estimates, the United States will lead the market with USD 8.1 billion by the end of 2035 and a CAGR of 9%. The social TV industry is booming because entertainment firms have to cater to customers' preferences. Cable operators to improve the customer experience are using technology.

According to recent research, 46% of 13 to 17-year-olds in the United States watch local TV news channels. Social networks have transformed news access by providing live capabilities to enable news content to spread and expand online. Since then, TikTok has gained a lot of popularity and has become a substitute for many TVs for many users.

Among young people, YouTube is the most popular social network for news, followed by Instagram (33%), TikTok (35%), and Facebook (29%). Increasingly, TV and broadcast companies are incorporating online platforms into their operations to better engage with their audiences. Businesses are making aggressive forays into space in order to meet the growing demand in the industry.

A New Age of Entertainment through Social TV Platforms in India

According to estimates, the social TV market in India will reach USD 2 billion by 2035. Over the next ten years, the market is projected to increase at a CAGR of 11.8%. About 600 TV channels are broadcast through DTH. Sites such as YouTube and Yahoo are constantly adding new videos in large numbers.

Smartphone use and a growing population are expected to drive social TV demand in the market. A growing number of viewers in these countries has fueled the growth of social TV demand. Growing OTT platforms and shows in India has propelled demand for social TV on the market. Both domestic and international markets present opportunities for animation and VFX studios due to the increasing popularity of over-the-top (OTT) channels, the increasing importance of animated IP, and the growing number of studios investing in VFX.

For example, iDubba is a website that can also be accessed on smartphones and tablets (app). By using SMS alerts, sharing and recommending programmes over social networks such as Twitter and Facebook, and interacting with producers, subscribers can influence how programs are viewed.

Tech Giants are Revolutionizing Content Consumption in China

Social TV in China is expected to reach USD 1 billion by 2035. A 6.2% CAGR is expected between 2025 and 2035 in the region. A tremendous amount of data is collected in China.

Smartphone use is one of the most common forms of communication in China. Smartphones are often used by TV viewers to comment on shows, share opinions, and participate in polls. Platforms such as Douyin, Kuaishou, and Bilibili are extremely popular in China. In real time, viewers can interact with their favorite hosts and celebrities on these platforms, watch live TV shows, and send virtual gifts.

Social media elements are incorporated directly into many TV shows in China. To participate in online discussions about the show, viewers are recommended to use hashtags and subscribe to official accounts. Online participation is an interactive element in some Chinese TV shows, especially talent and reality shows.

Social media is a popular place for Chinese TV shows to connect with their fans. In addition to organizing fan clubs, online events, and supporting their favorite celebrities, fans engage in a variety of online activities. As part of social television, viewers may also be able to shop for products featured on TV shows through social media platforms. Some shows and influencers have benefited from this revenue stream.

A New Shape of Social TV is emerging in the United Kingdom Interactive Shows and Streaming Platforms

The United Kingdom's market continues to grow steadily. A 6.8% CAGR is predicted for the country between 2025 and 2035. By the end of the forecast period, Social TV in the United Kingdom will total around USD 900 million.

Many United Kingdom viewers use their phones, tablets, or laptops to watch television. Watching TV programs entices them to tweet live, comment on Facebook, or participate online in discussions.

Social media platforms provide viewers with a great opportunity to interact with popular TV sports shows, especially live entertainment events. Viewers often participate in these shows socially and share their experiences through hashtags on platforms like Twitter.

Social media has become an increasingly important means of engaging the audience for TV networks and producers in the United Kingdom. In addition to traditional TV, they often feature social media content, comments, and reactions on air.

Through online or SMS voting, some UK TV shows provide viewers with the opportunity to vote for their favored contestants. Reality and talent shows are particularly prone to this type of engagement. The popularity of streaming services such as Amazon Prime Video, Netflix, and Disney+ in the United Kingdom has also contributed to social TV's popularity. On these platforms, viewers can sometimes share their viewing experiences on social media. They can also interact with other viewers over social media.

It is common for United Kingdom’s viewers to read, recommend, and comment on TV shows and movies via social media. Viewership of a particular show can be greatly impacted by this social sharing. In addition to providing real-time social media integration and additional content related to the show, some TV networks and third-party developers have created dedicated social TV apps.

Global Entertainment Landscape Dominates South Korea Market

Social TV market in south Korea is projected to expand by 7.4% from 2025 to 2035. A valuation of USD 1.3 billion is expected by the end of the forecast period.

South Korea has become a popular destination for live streaming platforms like AfreecaTV, V LIVE, and Twitch. These platforms permit celebrities and content creators to communicate directly with their fans. South Korea has a thriving fan culture, and K-pop, actors, and celebrities have dedicated fan bases. Fans of these superstars and television shows are active participants in online communities.

Viewers are often encouraged to use hashtags related to TV shows by television networks and producers. Viewers can then share their experiences with each other and create a sense of community.

Social media interactions are incorporated into some South Korean TV programs. As a result, they allow viewers to participate within the show by displaying their comments and reactions on screen.

Streaming platforms like Netflix have made Korean dramas (K-dramas) popular worldwide, stimulating discussion worldwide. Mobile apps developed by some television shows in South Korea offer additional content, interactive features, and polls. Social interaction is encouraged through these apps, which makes watching more enjoyable. TV dramas and shows in South Korea are often discussed on social media, with viewers sharing their reviews and speculation.

Social TV Industry Analysis by Top Investment Segments

According to market forecasts, social TV software will dominate the market through 2035, growing at a CAGR of 12%. The TV shows segment is predicted to thrive at a CAGR of 11.5% during the forecast period.

Category CAGR from 2025 to 2035
Social TV Software 12%
TV Shows 11.5%

Social TV Software Revolutionizes Entertainment Experience to the Next Level

Based on the solution, the social TV software segment is predicted to remain dominant in the social TV market through 2035. The market is predicted to expand at a CAGR of 12% between 2025 and 2035.

Social media platforms are popular places for people to share their TV watching experiences. The social features of social TV software are integrated directly into the TV viewing experience to enhance it process. With TV viewing becoming more social, the demand for such software is likely to grow. Social media activity often spikes during major live events, such as sports games and award shows. Such occasions can increase demand for social TV software that allows viewers to interact with each other through live discussions, polls, or games.

Users' social network activity and preferences can be used by social TV platforms to recommend content. Social TV software that provides rich content discovery features could become more popular as viewers demand more personalized recommendations. Social TV features have become increasingly popular with the rise of streaming services. The demand for watching experiences that are synchronized can be met with social TV technology.

Social TV software is increasingly sought after by advertisers as a way to engage advertising campaigns with viewers. A real-time feedback mechanism, interactive ads, and social sharing options can all be part of the solution.

Media companies and content creators to collect valuable information on viewer preferences and behavior may use a social TV monitoring software. In addition to improving content and advertising strategies, this data can also help viewers engage with content more effectively. In order to provide a seamless experience for users with smart TVs, social TV software must seamlessly integrate with these devices.

Aiming for a Growing Disposable Income and Investing in the Right Filters to Expand the Market

By application, social TV shows are anticipated to be the most popular in all applications. A growth rate of 11.5% is projected from 2025 to 2035. Viewers were encouraged to interact with TV shows in real-time through a second screen, like a smartphone or tablet. Social media discussion, voting, and polls are all engaging methods of participation.

Social TV engagement was largely driven by Twitter. Watchers are often encouraged to participate in the conversation by using official hashtags created by shows. Viewers could influence the outcome of some reality shows and sporting events in real-time. Voting or suggesting challenges for contestants could be included in the voting process.

With social TV shows, viewers could engage with television beyond the TV screen and enjoy the viewing experience in more ways. Social media exclusive interviews, interactive quizzes, and behind-the-scenes content could be included.

Social TV shows often display comments and reactions from viewers live during live events, incorporating social media feeds directly into broadcasts. Many TV shows and networks have companion apps that provide more content, interactive features, and synchronize with live content. Networks and advertisers were also able to gain valuable insight about viewer behavior and preferences from social TV. A targeted advertising campaign and content optimization could be conducted using this data.
Competitive Landscape of the Social TV Market

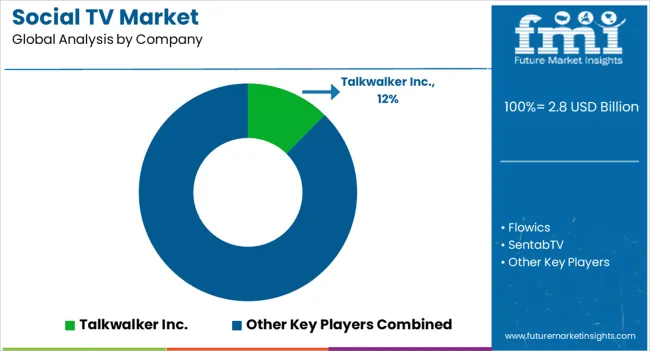
Social Tv Market Analysis By Company

A variety of start-ups have been offering creative solutions catering to different industrial requirements in the social TV market due to fierce competition.

  • In September 2025, Meta’s Horizon Worlds is rolling out on web and mobile. Horizon Worlds has been in development for more than a year and a half. In early access, the VR social app is now available on the web and mobile for some users.
  • In September 2025, an emerging social network, Favs, will emerge from Stealth next January with the goal of bringing social networks back to their roots by helping people stay connected. In order to generate revenue and ad dollars, Favs intends to provide a lightweight app experience.

Scope and Coverage of the Social TV Market Report

Attributes Details
Estimated Market Size in 2025 USD 2.8 billion
Projected Market Valuation in 2035 USD 8.1 billion
Value-based CAGR 2025 to 2035 11.4%
Forecast Period 2025 to 2035
Historical Data Available for 2020 to 2025
Market Analysis Value in USD billion
Key Regions Covered North America; Latin America; Western Europe; Eastern Europe; South Asia and Pacific; East Asia; The Middle East & Africa
Key Market Segments Covered Solution, Application, Region
Key Countries Profiled The United States, Canada, Brazil, Mexico, The United States, Canada, Brazil, Mexico, Germany, The United Kingdom, France, Spain, Italy, Russia, Poland, Czech Republic, Romania, India, Bangladesh, Australia, New Zealand, China, Japan, South Korea, GCC countries, South Africa, Israel
Key Companies Profiled Talkwalker Inc.; Flowics; SentabTV; Telescope; Haier Group; Hitachi, Ltd.; iPowow Ltd; Sharp Corporation; Snipperwall; Socialbakers Ltd.

Top Segments Studied in the Social TV Market Research Report

By Solution:

  • Social TV Software
  • Broadcast Integration
  • Audience Engagement
  • Content Moderation
  • Social TV Analytics
  • Social Networking Platform
  • Others
  • Social TV Service
  • Integration and Consulting
  • Operation and Intallation
  • Maintenance and Repairing

By Application:

  • Sports
  • News
  • TV Shows
  • Others

By Region:

  • North America
  • Latin America
  • Western Europe
  • Eastern Europe
  • South Asia and Pacific
  • East Asia
  • Middle East and Africa

Frequently Asked Questions

How big is the social tv market in 2025?

The global social tv market is estimated to be valued at USD 2.8 billion in 2025.

What will be the size of social tv market in 2035?

The market size for the social tv market is projected to reach USD 8.1 billion by 2035.

How much will be the social tv market growth between 2025 and 2035?

The social tv market is expected to grow at a 11.4% CAGR between 2025 and 2035.

What are the key product types in the social tv market?

The key product types in social tv market are social tv software, broadcast integration, audience engagement, content moderation, social tv analytics, social networking platform, others, social tv service, integration and consulting, operation and intallation and maintenance and repairing.

Which application segment to contribute significant share in the social tv market in 2025?

In terms of application, sports segment to command 39.8% share in the social tv market in 2025.

Table of Content

  1. Executive Summary
    • Global Market Outlook
    • Demand-side Trends
    • Supply-side Trends
    • Technology Roadmap Analysis
    • Analysis and Recommendations
  2. Market Overview
    • Market Coverage / Taxonomy
    • Market Definition / Scope / Limitations
  3. Market Background
    • Market Dynamics
      • Drivers
      • Restraints
      • Opportunity
      • Trends
    • Scenario Forecast
      • Demand in Optimistic Scenario
      • Demand in Likely Scenario
      • Demand in Conservative Scenario
    • Opportunity Map Analysis
    • Product Life Cycle Analysis
    • Supply Chain Analysis
    • Investment Feasibility Matrix
    • Value Chain Analysis
    • PESTLE and Porter’s Analysis
    • Regulatory Landscape
    • Regional Parent Market Outlook
    • Production and Consumption Statistics
    • Import and Export Statistics
  4. Global Market Analysis 2020 to 2024 and Forecast, 2025 to 2035
    • Historical Market Size Value (USD Million) Analysis, 2020 to 2024
    • Current and Future Market Size Value (USD Million) Projections, 2025 to 2035
      • Y-o-Y Growth Trend Analysis
      • Absolute $ Opportunity Analysis
  5. Global Market Pricing Analysis 2020 to 2024 and Forecast 2025 to 2035
  6. Global Market Analysis 2020 to 2024 and Forecast 2025 to 2035, By Solution
    • Introduction / Key Findings
    • Historical Market Size Value (USD Million) Analysis By Solution , 2020 to 2024
    • Current and Future Market Size Value (USD Million) Analysis and Forecast By Solution , 2025 to 2035
      • Software
      • Broadcast Integration
      • Audience Engagement
      • Content Moderation
      • Analytics
      • Social Networking Platform
      • Others
      • Service
      • Integration And Consulting
      • Operation And Intallation
      • Maintenance And Repairing
    • Y-o-Y Growth Trend Analysis By Solution , 2020 to 2024
    • Absolute $ Opportunity Analysis By Solution , 2025 to 2035
  7. Global Market Analysis 2020 to 2024 and Forecast 2025 to 2035, By Application
    • Introduction / Key Findings
    • Historical Market Size Value (USD Million) Analysis By Application, 2020 to 2024
    • Current and Future Market Size Value (USD Million) Analysis and Forecast By Application, 2025 to 2035
      • Sports
      • News
      • TV Shows
      • Others
    • Y-o-Y Growth Trend Analysis By Application, 2020 to 2024
    • Absolute $ Opportunity Analysis By Application, 2025 to 2035
  8. Global Market Analysis 2020 to 2024 and Forecast 2025 to 2035, By Region
    • Introduction
    • Historical Market Size Value (USD Million) Analysis By Region, 2020 to 2024
    • Current Market Size Value (USD Million) Analysis and Forecast By Region, 2025 to 2035
      • North America
      • Latin America
      • Western Europe
      • Eastern Europe
      • East Asia
      • South Asia and Pacific
      • Middle East & Africa
    • Market Attractiveness Analysis By Region
  9. North America Market Analysis 2020 to 2024 and Forecast 2025 to 2035, By Country
    • Historical Market Size Value (USD Million) Trend Analysis By Market Taxonomy, 2020 to 2024
    • Market Size Value (USD Million) Forecast By Market Taxonomy, 2025 to 2035
      • By Country
        • USA
        • Canada
        • Mexico
      • By Solution
      • By Application
    • Market Attractiveness Analysis
      • By Country
      • By Solution
      • By Application
    • Key Takeaways
  10. Latin America Market Analysis 2020 to 2024 and Forecast 2025 to 2035, By Country
    • Historical Market Size Value (USD Million) Trend Analysis By Market Taxonomy, 2020 to 2024
    • Market Size Value (USD Million) Forecast By Market Taxonomy, 2025 to 2035
      • By Country
        • Brazil
        • Chile
        • Rest of Latin America
      • By Solution
      • By Application
    • Market Attractiveness Analysis
      • By Country
      • By Solution
      • By Application
    • Key Takeaways
  11. Western Europe Market Analysis 2020 to 2024 and Forecast 2025 to 2035, By Country
    • Historical Market Size Value (USD Million) Trend Analysis By Market Taxonomy, 2020 to 2024
    • Market Size Value (USD Million) Forecast By Market Taxonomy, 2025 to 2035
      • By Country
        • Germany
        • UK
        • Italy
        • Spain
        • France
        • Nordic
        • BENELUX
        • Rest of Western Europe
      • By Solution
      • By Application
    • Market Attractiveness Analysis
      • By Country
      • By Solution
      • By Application
    • Key Takeaways
  12. Eastern Europe Market Analysis 2020 to 2024 and Forecast 2025 to 2035, By Country
    • Historical Market Size Value (USD Million) Trend Analysis By Market Taxonomy, 2020 to 2024
    • Market Size Value (USD Million) Forecast By Market Taxonomy, 2025 to 2035
      • By Country
        • Russia
        • Poland
        • Hungary
        • Balkan & Baltic
        • Rest of Eastern Europe
      • By Solution
      • By Application
    • Market Attractiveness Analysis
      • By Country
      • By Solution
      • By Application
    • Key Takeaways
  13. East Asia Market Analysis 2020 to 2024 and Forecast 2025 to 2035, By Country
    • Historical Market Size Value (USD Million) Trend Analysis By Market Taxonomy, 2020 to 2024
    • Market Size Value (USD Million) Forecast By Market Taxonomy, 2025 to 2035
      • By Country
        • China
        • Japan
        • South Korea
      • By Solution
      • By Application
    • Market Attractiveness Analysis
      • By Country
      • By Solution
      • By Application
    • Key Takeaways
  14. South Asia and Pacific Market Analysis 2020 to 2024 and Forecast 2025 to 2035, By Country
    • Historical Market Size Value (USD Million) Trend Analysis By Market Taxonomy, 2020 to 2024
    • Market Size Value (USD Million) Forecast By Market Taxonomy, 2025 to 2035
      • By Country
        • India
        • ASEAN
        • Australia & New Zealand
        • Rest of South Asia and Pacific
      • By Solution
      • By Application
    • Market Attractiveness Analysis
      • By Country
      • By Solution
      • By Application
    • Key Takeaways
  15. Middle East & Africa Market Analysis 2020 to 2024 and Forecast 2025 to 2035, By Country
    • Historical Market Size Value (USD Million) Trend Analysis By Market Taxonomy, 2020 to 2024
    • Market Size Value (USD Million) Forecast By Market Taxonomy, 2025 to 2035
      • By Country
        • Kingdom of Saudi Arabia
        • Other GCC Countries
        • Turkiye
        • South Africa
        • Other African Union
        • Rest of Middle East & Africa
      • By Solution
      • By Application
    • Market Attractiveness Analysis
      • By Country
      • By Solution
      • By Application
    • Key Takeaways
  16. Key Countries Market Analysis
    • USA
      • Pricing Analysis
      • Market Share Analysis, 2024
        • By Solution
        • By Application
    • Canada
      • Pricing Analysis
      • Market Share Analysis, 2024
        • By Solution
        • By Application
    • Mexico
      • Pricing Analysis
      • Market Share Analysis, 2024
        • By Solution
        • By Application
    • Brazil
      • Pricing Analysis
      • Market Share Analysis, 2024
        • By Solution
        • By Application
    • Chile
      • Pricing Analysis
      • Market Share Analysis, 2024
        • By Solution
        • By Application
    • Germany
      • Pricing Analysis
      • Market Share Analysis, 2024
        • By Solution
        • By Application
    • UK
      • Pricing Analysis
      • Market Share Analysis, 2024
        • By Solution
        • By Application
    • Italy
      • Pricing Analysis
      • Market Share Analysis, 2024
        • By Solution
        • By Application
    • Spain
      • Pricing Analysis
      • Market Share Analysis, 2024
        • By Solution
        • By Application
    • France
      • Pricing Analysis
      • Market Share Analysis, 2024
        • By Solution
        • By Application
    • India
      • Pricing Analysis
      • Market Share Analysis, 2024
        • By Solution
        • By Application
    • ASEAN
      • Pricing Analysis
      • Market Share Analysis, 2024
        • By Solution
        • By Application
    • Australia & New Zealand
      • Pricing Analysis
      • Market Share Analysis, 2024
        • By Solution
        • By Application
    • China
      • Pricing Analysis
      • Market Share Analysis, 2024
        • By Solution
        • By Application
    • Japan
      • Pricing Analysis
      • Market Share Analysis, 2024
        • By Solution
        • By Application
    • South Korea
      • Pricing Analysis
      • Market Share Analysis, 2024
        • By Solution
        • By Application
    • Russia
      • Pricing Analysis
      • Market Share Analysis, 2024
        • By Solution
        • By Application
    • Poland
      • Pricing Analysis
      • Market Share Analysis, 2024
        • By Solution
        • By Application
    • Hungary
      • Pricing Analysis
      • Market Share Analysis, 2024
        • By Solution
        • By Application
    • Kingdom of Saudi Arabia
      • Pricing Analysis
      • Market Share Analysis, 2024
        • By Solution
        • By Application
    • Turkiye
      • Pricing Analysis
      • Market Share Analysis, 2024
        • By Solution
        • By Application
    • South Africa
      • Pricing Analysis
      • Market Share Analysis, 2024
        • By Solution
        • By Application
  17. Market Structure Analysis
    • Competition Dashboard
    • Competition Benchmarking
    • Market Share Analysis of Top Players
      • By Regional
      • By Solution
      • By Application
  18. Competition Analysis
    • Competition Deep Dive
      • Talkwalker Inc.
        • Overview
        • Product Portfolio
        • Profitability by Market Segments (Product/Age /Sales Channel/Region)
        • Sales Footprint
        • Strategy Overview
          • Marketing Strategy
          • Product Strategy
          • Channel Strategy
      • Flowics
      • SentabTV
      • Telescope
      • Haier Group
      • Hitachi, Ltd.
      • iPowow Ltd
      • Sharp Corporation
      • Snipperwall
      • Socialbakers Ltd.
  19. Assumptions & Acronyms Used
  20. Research Methodology

List of Tables

  • Table 1: Global Market Value (USD Million) Forecast by Region, 2020-2035
  • Table 2: Global Market Value (USD Million) Forecast by Solution , 2020-2035
  • Table 3: Global Market Value (USD Million) Forecast by Application, 2020-2035
  • Table 4: North America Market Value (USD Million) Forecast by Country, 2020-2035
  • Table 5: North America Market Value (USD Million) Forecast by Solution , 2020-2035
  • Table 6: North America Market Value (USD Million) Forecast by Application, 2020-2035
  • Table 7: Latin America Market Value (USD Million) Forecast by Country, 2020-2035
  • Table 8: Latin America Market Value (USD Million) Forecast by Solution , 2020-2035
  • Table 9: Latin America Market Value (USD Million) Forecast by Application, 2020-2035
  • Table 10: Western Europe Market Value (USD Million) Forecast by Country, 2020-2035
  • Table 11: Western Europe Market Value (USD Million) Forecast by Solution , 2020-2035
  • Table 12: Western Europe Market Value (USD Million) Forecast by Application, 2020-2035
  • Table 13: Eastern Europe Market Value (USD Million) Forecast by Country, 2020-2035
  • Table 14: Eastern Europe Market Value (USD Million) Forecast by Solution , 2020-2035
  • Table 15: Eastern Europe Market Value (USD Million) Forecast by Application, 2020-2035
  • Table 16: East Asia Market Value (USD Million) Forecast by Country, 2020-2035
  • Table 17: East Asia Market Value (USD Million) Forecast by Solution , 2020-2035
  • Table 18: East Asia Market Value (USD Million) Forecast by Application, 2020-2035
  • Table 19: South Asia and Pacific Market Value (USD Million) Forecast by Country, 2020-2035
  • Table 20: South Asia and Pacific Market Value (USD Million) Forecast by Solution , 2020-2035
  • Table 21: South Asia and Pacific Market Value (USD Million) Forecast by Application, 2020-2035
  • Table 22: Middle East & Africa Market Value (USD Million) Forecast by Country, 2020-2035
  • Table 23: Middle East & Africa Market Value (USD Million) Forecast by Solution , 2020-2035
  • Table 24: Middle East & Africa Market Value (USD Million) Forecast by Application, 2020-2035

List of Figures

  • Figure 1: Global Market Pricing Analysis
  • Figure 2: Global Market Value (USD Million) Forecast 2020-2035
  • Figure 3: Global Market Value Share and BPS Analysis by Solution , 2025 and 2035
  • Figure 4: Global Market Y-o-Y Growth Comparison by Solution , 2025-2035
  • Figure 5: Global Market Attractiveness Analysis by Solution
  • Figure 6: Global Market Value Share and BPS Analysis by Application, 2025 and 2035
  • Figure 7: Global Market Y-o-Y Growth Comparison by Application, 2025-2035
  • Figure 8: Global Market Attractiveness Analysis by Application
  • Figure 9: Global Market Value (USD Million) Share and BPS Analysis by Region, 2025 and 2035
  • Figure 10: Global Market Y-o-Y Growth Comparison by Region, 2025-2035
  • Figure 11: Global Market Attractiveness Analysis by Region
  • Figure 12: North America Market Incremental Dollar Opportunity, 2025-2035
  • Figure 13: Latin America Market Incremental Dollar Opportunity, 2025-2035
  • Figure 14: Western Europe Market Incremental Dollar Opportunity, 2025-2035
  • Figure 15: Eastern Europe Market Incremental Dollar Opportunity, 2025-2035
  • Figure 16: East Asia Market Incremental Dollar Opportunity, 2025-2035
  • Figure 17: South Asia and Pacific Market Incremental Dollar Opportunity, 2025-2035
  • Figure 18: Middle East & Africa Market Incremental Dollar Opportunity, 2025-2035
  • Figure 19: North America Market Value Share and BPS Analysis by Country, 2025 and 2035
  • Figure 20: North America Market Value Share and BPS Analysis by Solution , 2025 and 2035
  • Figure 21: North America Market Y-o-Y Growth Comparison by Solution , 2025-2035
  • Figure 22: North America Market Attractiveness Analysis by Solution
  • Figure 23: North America Market Value Share and BPS Analysis by Application, 2025 and 2035
  • Figure 24: North America Market Y-o-Y Growth Comparison by Application, 2025-2035
  • Figure 25: North America Market Attractiveness Analysis by Application
  • Figure 26: Latin America Market Value Share and BPS Analysis by Country, 2025 and 2035
  • Figure 27: Latin America Market Value Share and BPS Analysis by Solution , 2025 and 2035
  • Figure 28: Latin America Market Y-o-Y Growth Comparison by Solution , 2025-2035
  • Figure 29: Latin America Market Attractiveness Analysis by Solution
  • Figure 30: Latin America Market Value Share and BPS Analysis by Application, 2025 and 2035
  • Figure 31: Latin America Market Y-o-Y Growth Comparison by Application, 2025-2035
  • Figure 32: Latin America Market Attractiveness Analysis by Application
  • Figure 33: Western Europe Market Value Share and BPS Analysis by Country, 2025 and 2035
  • Figure 34: Western Europe Market Value Share and BPS Analysis by Solution , 2025 and 2035
  • Figure 35: Western Europe Market Y-o-Y Growth Comparison by Solution , 2025-2035
  • Figure 36: Western Europe Market Attractiveness Analysis by Solution
  • Figure 37: Western Europe Market Value Share and BPS Analysis by Application, 2025 and 2035
  • Figure 38: Western Europe Market Y-o-Y Growth Comparison by Application, 2025-2035
  • Figure 39: Western Europe Market Attractiveness Analysis by Application
  • Figure 40: Eastern Europe Market Value Share and BPS Analysis by Country, 2025 and 2035
  • Figure 41: Eastern Europe Market Value Share and BPS Analysis by Solution , 2025 and 2035
  • Figure 42: Eastern Europe Market Y-o-Y Growth Comparison by Solution , 2025-2035
  • Figure 43: Eastern Europe Market Attractiveness Analysis by Solution
  • Figure 44: Eastern Europe Market Value Share and BPS Analysis by Application, 2025 and 2035
  • Figure 45: Eastern Europe Market Y-o-Y Growth Comparison by Application, 2025-2035
  • Figure 46: Eastern Europe Market Attractiveness Analysis by Application
  • Figure 47: East Asia Market Value Share and BPS Analysis by Country, 2025 and 2035
  • Figure 48: East Asia Market Value Share and BPS Analysis by Solution , 2025 and 2035
  • Figure 49: East Asia Market Y-o-Y Growth Comparison by Solution , 2025-2035
  • Figure 50: East Asia Market Attractiveness Analysis by Solution
  • Figure 51: East Asia Market Value Share and BPS Analysis by Application, 2025 and 2035
  • Figure 52: East Asia Market Y-o-Y Growth Comparison by Application, 2025-2035
  • Figure 53: East Asia Market Attractiveness Analysis by Application
  • Figure 54: South Asia and Pacific Market Value Share and BPS Analysis by Country, 2025 and 2035
  • Figure 55: South Asia and Pacific Market Value Share and BPS Analysis by Solution , 2025 and 2035
  • Figure 56: South Asia and Pacific Market Y-o-Y Growth Comparison by Solution , 2025-2035
  • Figure 57: South Asia and Pacific Market Attractiveness Analysis by Solution
  • Figure 58: South Asia and Pacific Market Value Share and BPS Analysis by Application, 2025 and 2035
  • Figure 59: South Asia and Pacific Market Y-o-Y Growth Comparison by Application, 2025-2035
  • Figure 60: South Asia and Pacific Market Attractiveness Analysis by Application
  • Figure 61: Middle East & Africa Market Value Share and BPS Analysis by Country, 2025 and 2035
  • Figure 62: Middle East & Africa Market Value Share and BPS Analysis by Solution , 2025 and 2035
  • Figure 63: Middle East & Africa Market Y-o-Y Growth Comparison by Solution , 2025-2035
  • Figure 64: Middle East & Africa Market Attractiveness Analysis by Solution
  • Figure 65: Middle East & Africa Market Value Share and BPS Analysis by Application, 2025 and 2035
  • Figure 66: Middle East & Africa Market Y-o-Y Growth Comparison by Application, 2025-2035
  • Figure 67: Middle East & Africa Market Attractiveness Analysis by Application
  • Figure 68: Global Market - Tier Structure Analysis
  • Figure 69: Global Market - Company Share Analysis
Dashboard
Dashboard
Dashboard
Dashboard
Dashboard
Dashboard

Full Research Suite comprises of:

Market outlook & trends analysis

Market outlook & trends analysis

Interviews & case studies

Interviews & case studies

Strategic recommendations

Strategic recommendations

Vendor profiles & capabilities analysis

Vendor profiles & capabilities analysis

5-year forecasts

5-year forecasts

8 regions and 60+ country-level data splits

8 regions and 60+ country-level data splits

Market segment data splits

Market segment data splits

12 months of continuous data updates

12 months of continuous data updates

DELIVERED AS:

PDF EXCEL ONLINE

Full Research Suite


$5000

$7500

$10000

Buy Report Now
Similar Industry Reports

Similar Industry Reports

Social Publishing Application Market

Social Publishing Application Market Size and Share Forecast Outlook 2025 to 2035

Social Media Records Management Market

Social Media Records Management Market Size and Share Forecast Outlook 2025 to 2035

Social Media Engagement Applications Market

Social Media Engagement Applications Market Size and Share Forecast Outlook 2025 to 2035

Social Commerce Market

Social Commerce Market Size and Share Forecast Outlook 2025 to 2035

Social Video Advertising Market

Social Video Advertising Market Size and Share Forecast Outlook 2025 to 2035

Social Employee Recognition System Market

Social Employee Recognition System Market Size, Growth, and Forecast for 2025 to 2035

Social Media Content Creation Market

Social Media Content Creation Market Size and Share Forecast Outlook 2025 to 2035

Social Advertising Tools Market

Social Advertising Tools Market Size and Share Forecast Outlook 2025 to 2035

Social Employee Recognition System Market in Korea

Social Employee Recognition System Market in Korea – Industry Outlook & Forecast 2025 to 2035

Social Media and Destination Market Share Analysis

Evaluating Social Media and Destination Market Share & Provider Insights

Social Media and Destination Market

Social Media and Destination Market Analysis by Platform, by Destination Type, by Region - Forecast for 2025 to 2035

Social Tourism Market

Social Tourism Market Analysis – Growth & Forecast through 2034

Social and Emotional Learning Market

Social and Emotional Learning Market Growth – Forecast 2024-2034

Social Business Intelligence Market

Social Business Intelligence Market Growth – Trends & Forecast 2024-2034

Social Media Content Creator Market

Social Media Content Creator Market

Social Media Analytics Market

Social Media Analytics Market

Social Software As A Collaborative ERP Tool Market

Social Software As A Collaborative ERP Tool Market

Japan Social Employee Recognition System Market

Social Employee Recognition System Market in Japan - Growth & Forecast 2025 to 2035

Mobile Social Networks Market

Mobile Social Networks Market Size and Share Forecast Outlook 2025 to 2035

Enterprise Social Graph Market

Enterprise Social Graph Market Size and Share Forecast Outlook 2025 to 2035

Future Market Insights

Social TV Market

Chat With MaRIA

Chat With

MaRIA

Hi There, I am MaRIA, Your Market Research Intelligence Assistant. How may I help you?