Loop-Mediated Isothermal Amplification (LAMP) Market Size, Share, and Forecast Outlook 2025 to 2035

The global loop-mediated isothermal amplification (LAMP) market is projected to grow from USD 115.7 million in 2025 to USD 184.8 million by 2035, reflecting a compound annual growth rate (CAGR) of 4.9% during the forecast period. LAMP is an innovative nucleic acid amplification technique that offers rapid, cost-effective, and reliable diagnostics without the need for complex thermal cycling equipment. This simplicity makes it particularly advantageous for point-of-care testing and resource-limited settings.

Recent developments in the LAMP market underscore its expanding applications across various sectors. The technique has gained prominence in infectious disease diagnostics, enabling the detection of pathogens such as Zika virus, tuberculosis, and SARS-CoV-2. Its robustness against inhibitors commonly found in clinical samples, coupled with the ability to perform under isothermal conditions, has further fueled its adoption. Additionally, LAMP's integration with microfluidic devices and real-time detection systems has enhanced its sensitivity and throughput, making it suitable for large-scale screening and surveillance programs.
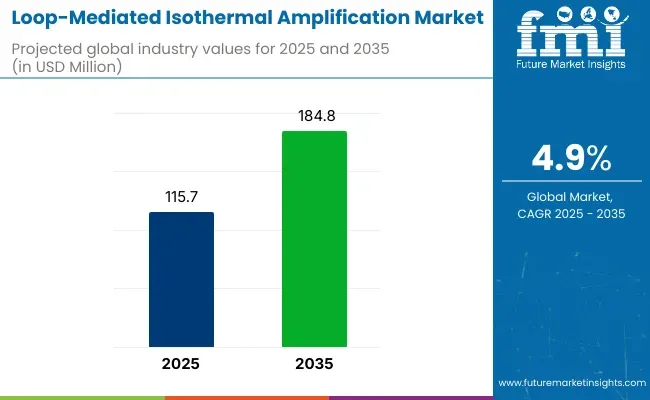
Loop Mediated Isothermal Amplification Market

Attribute Value
Market Size in 2025 USD 115.7 million
Market Size in 2035 USD 184.8 million
CAGR (2025 to 2035) 4.9%

On May 15, 2025, Jena Bioscience GmbH introduced its new RT-LAMP Kit, designed for ultra-fast and efficient RNA detection. This product leverages the Loop-Mediated Isothermal Amplification (LAMP) technology, known for its simplicity and speed, making it ideal for rapid diagnostics in various applications, including infectious disease detection and genetic research. The RT-LAMP Kit aims to provide researchers and healthcare professionals with a reliable tool for RNA analysis, enhancing the capabilities of molecular diagnostics. This was officially announced in the company's press release.

The market's growth is also driven by increasing investments in healthcare infrastructure, particularly in emerging economies where the need for affordable diagnostic tools is critical. Governments and non-governmental organizations are recognizing the potential of LAMP in strengthening healthcare systems and improving disease control measures.

As the LAMP market continues to evolve, ongoing research and development efforts are expected to lead to the introduction of more specialized and efficient products. These advancements will cater to the diverse needs of healthcare providers and researchers, further driving the market's expansion and impact on global health outcomes

Analyzing Loop-Mediated Isothermal Amplification Market by Top Investment Segments

The global loop-mediated isothermal amplification (LAMP) market is expected to experience significant growth from 2025 to 2035. Key segments contributing to this growth include microfluidic technology and clinical diagnostics. These segments are driven by the increasing demand for rapid, cost-effective, and precise diagnostic solutions, particularly in infectious disease testing and point-of-care applications.

Microfluidic Technology to Lead the Market with Enhanced Diagnostic Precision

Microfluidic technology is expected to account for 63.8% of the loop-mediated isothermal amplification market share in 2025. This segment is seeing significant growth due to the increasing use of microfluidic systems in LAMP-based assays, which offer high precision and efficiency in nucleic acid amplification.
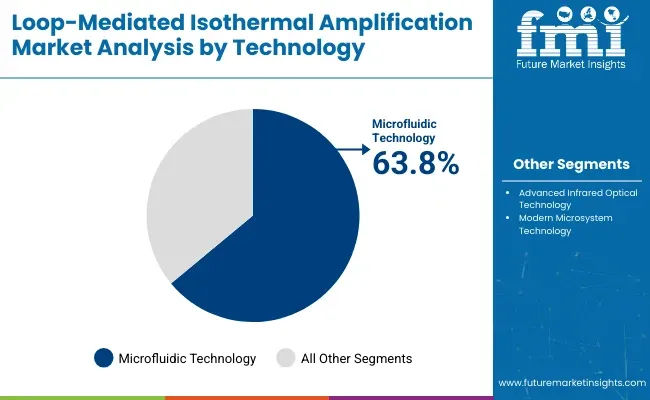
Loop Mediated Isothermal Amplification Market Analysis By Technology

Microfluidic platforms enable the integration of multiple processes, such as sample preparation, amplification, and detection, into a single, compact device. These devices are highly valued for their ability to provide rapid results, reduced reagent consumption, and portability, making them ideal for field diagnostics and point-of-care settings.

Key players such as Thermo Fisher Scientific and Abbott are advancing microfluidic technologies by developing compact, easy-to-use platforms that integrate LAMP with real-time detection. The application of microfluidics in LAMP systems is also expanding into various sectors, including environmental monitoring, food safety, and veterinary diagnostics. As the demand for faster and more efficient diagnostic tools increases, microfluidic technology is expected to continue its dominance in the LAMP market, driving its growth in both developed and emerging markets.

Clinical Diagnostics Segment to Drive Growth with Increasing Demand for Point-of-Care Testing

The clinical diagnostics segment is projected to hold 63.8% of the LAMP market share in 2025. This growth is driven by the rising demand for rapid, accurate, and affordable diagnostic tests for infectious diseases, particularly in resource-limited settings. LAMP is gaining popularity in clinical diagnostics due to its ability to amplify DNA or RNA without the need for thermal cycling, making it well-suited for use in point-of-care (POC) settings and in-field applications.
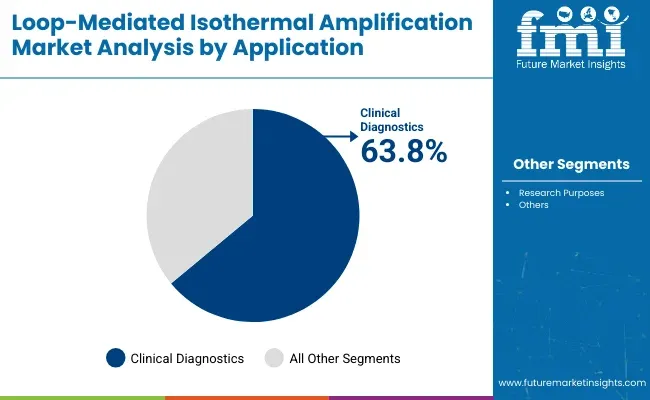
Loop Mediated Isothermal Amplification Market Analysis By Application

The clinical diagnostics market is expanding due to the increasing prevalence of infectious diseases such as COVID-19, malaria, and tuberculosis, which require fast and accurate diagnostic tools. The ease of use, affordability, and rapid results offered by LAMP technology are making it an attractive option for healthcare providers, especially in rural or underserved regions.

Companies like Bio-Rad Laboratories and Eiken Chemical are at the forefront of developing LAMP-based diagnostic kits and systems designed to provide reliable results in a wide range of healthcare settings. As the need for timely diagnostics continues to grow, the clinical diagnostics segment is expected to be a significant driver of growth in the LAMP market.

Loop-mediated Isothermal Amplification Market Analysis

  • Government initiatives related to genetic testing and DNA research encourage more LAMP procedures.
  • With the rising threat of infectious diseases, LAMP is one procedure that is being invested into to aid in the identification of these diseases in individuals.
  • LAMP is preferred to polymerase chain reaction (PCR) by certain researchers and medical professionals because of its rugged quality and lower sensitivity to inhibitors than PCR.

Loop-mediated Isothermal Amplification Market Trends

  • Because of the low cost of the procedure, LAMP is emerging as a viable testing and diagnostic measure in developing and underdeveloped countries.
  • LAMP is used not just for diagnosis and blood-related procedures but also for identifying bodily fluids.
  • LAMP’s coupling with technology has yielded results for researchers, and thus, the infusion of technology is expected to keep the market outlook fresh.
  • LAMP procedures are being combined with leading molecular approaches such as real-time detection and chip-based assays for improved performance.
  • PCR is a major competitor to LAMP and is still the primary blood-testing procedure. The popularity of PCR constrains the growth of the market.
  • LAMP lacks the versatility of PCR, which can be used for cloning and other blood-related procedures. Thus, LAMP’s rigid application serves to impede the progress of the market.
  • LAMP as a procedure is still a developing science, and thus, the market suffers from a lack of awareness on the part of end-users.

Country-wise Analysis

The Asia Pacific is emerging as a hub for healthcare research, thus aiding the loop-mediated isothermal amplification’s cause in the region. The growing incidence of genetic disorders in the region is also positively affecting the market in the Asia Pacific.

Europe being at the forefront of healthcare technology is proving conducive to the market’s progress in the region. The European Union’s initiatives to control the spread of newer diseases is also helping the market’s cause in Europe.
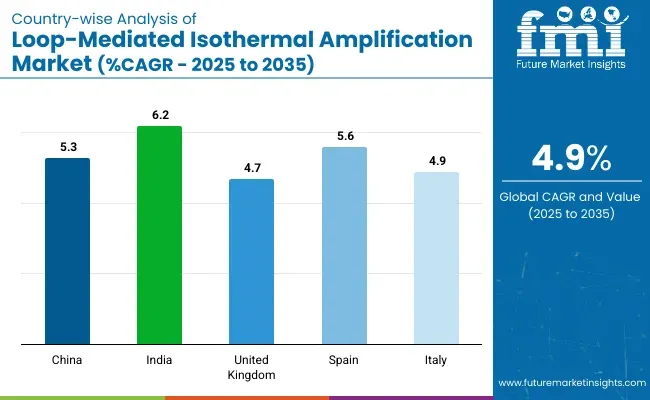
Country Wise Analysis Of Loop Mediated Isothermal Amplification Market Cagr 2025 To 2035

Countries CAGR (2025 to 2035)
China 5.3%
India 6.2%
United Kingdom 4.7%
Spain 5.6%
Italy 4.9%

Initiatives to Inculcate Research Studies Further into the Medical Field Propelling the Market in India

The market is anticipated to register a CAGR of 6.2% in India for the forecast period. Some of the factors driving the growth of the market in the country are:

  • Government initiatives aiding research in India are helping along the market. Clinical diagnostics and other research-related fields are advancing rapidly in India and playing a more pivotal role in the healthcare sector. Thus, LAMP procedures are progressing along in the country.
  • There is encouragement in India for research from all corners, from high-end companies to university level, and thus the market has wide scope in the country.

Widespread Use of LAMP in Virus-relate Disease Testing in the United Kingdom

The United Kingdom is set to see the market expand at a CAGR of 4.7% over the forecast period. Prominent factors driving the growth of the market are:

  • Research institutions in the United Kingdom are taking the help of LAMP to produce diagnosis solutions for virus-related diseases like SARS and COVID-19.
  • University-level research is being encouraged in the medical field in the United Kingdom. Bath University is one such university that has used LAMP to come up with new diagnostic capabilities.

China’s Robust Healthcare Sector Conducive to the Growth of the Market in the Country

The market is expected to register a CAGR of 5.3% in China during the forecast period. Some of the factors driving the growth of the market in China are:

  • China’s humongous population necessitates the presence of an effective healthcare system. The healthcare system in China is fledging, and thus, research procedures like LAMP have an easy pathway in the country.
  • China has been under the threat of developing new diseases in the recent past. Thus, procedures that help in the identification and research of these diseases, such as LAMP, are increasing in popularity in the country.

Increasing Investment in Healthcare Technology Leading to Market Acceleration in Spain

The market is set to progress at a CAGR of 5.6% in Spain during the forecast period. Factors influencing the growth of the market in Spain include:

  • Both public and private investment in healthcare technology is growing in Spain, and thus, LAMP is finding an easy pathway towards progress in the country.
  • A rising number of people with genetic conditions are spurring DNA testing in Spain, and the loop-mediated isothermal amplification market is benefiting.

Public Desire to Keep Infectious Diseases at Bay Molding the Market Positively in Italy

The market is expected to register a CAGR of 4.9% in Italy. Some of the reasons for the growth of loop-mediated isothermal amplification in the country are:

  • Italy’s many coastal regions expose the country’s population to several water-borne diseases. Diagnostic procedures like LAMP are being utilized in the country to keep the threat of infectious diseases controlled.
  • Low cost of LAMP is helping the procedure to make further headway into Italy, where the funding for research institutions has the potential to be sketchy.

Competitive Landscape in the Loop-mediated Isothermal Amplification Market

Since loop-mediated isothermal amplification is still a developing process, the market is currently being controlled by a few reputed names. However, as the knowledge about the procedure grows, new entrants are steadily making their way into the market.

Market players are collaborating with healthcare and research institutions to eradicate the lack of awareness about the procedure. Both public and private investment are being sought by market players in their bid to develop the procedure further.

Recent Developments in the Loop-mediated Isothermal Amplification Market

  • In 2023, researchers at Bath University in England developed the LoCKAmp test, described as the fastest COVID test in the world, with the help of reverse transcription loop-mediated isothermal amplification.
  • Also in 2023, scientists from the University of Surrey, Brunel University London, and Lancaster University, along with the NHS, GB Electronics (UK) Ltd., and Vidiia Ltd., developed the VIDIIA Hunter (VH6) platform for infectious disease testing. It combines RT-LAMP with AI.
  • In August 2022, LGC Clinical Diagnostics’ collaboration with Stanford Medicine's Department of Obstetrics and Gynecology and Metabolic Health Center was extended.

Key Companies in the Loop-mediated Isothermal Amplification Market

  • Jena Bioscience GmbH
  • HiberGene Diagnostics
  • Meridian Bioscience, Inc.
  • Mast Group Ltd.
  • Excellgen, Inc.
  • Merck KGaA
  • QIAGEN N.V
  • NIPPON GENE CO., LTD
  • New England Biolabs
  • Bio-Rad Laboratories, Inc.
  • Thermo Fisher Scientific

Key Coverage in the Loop-mediated Isothermal Amplification Industry Report

  • isothermal nucleic acid amplification technology market covergae
  • Loop-mediated isothermal amplification (LAMP) market revenue analysis
  • INAAT Market Share & Size Assessment
  • LAMP Technique Coverage
  • LAMP Assay Market Report
  • LAMP and PCR Market Comparative Analysis

Report Scope Table - Loop-Mediated Isothermal Amplification Market

Report Attributes Details
Current Total Market Size (2025) USD 115.7 million
Projected Market Size (2035) USD 184.8 million
CAGR (2025 to 2035) 4.9%
Base Year for Estimation 2024
Historical Period 2020 to 2024
Projections Period 2025 to 2035
Quantitative Units USD million for dollar sales
Product Types Analyzed (Segment 1) Instruments (Incubation Systems, Turbidimeters, Agarose Gel Electrophoresis, Fluorescence Measuring Systems), Kits & Reagents (DNA Polymerase, Primer Mix, DNA Polymerase & Primer Mix, Dyes, Other Reagents)
Technologies Analyzed (Segment 2) Microfluidic Technology, Advanced Infrared Optical Technology, Modern Microsystem Technology
Applications Analyzed (Segment 3) Diagnostic Purposes, Research Purposes
End-users Analyzed (Segment 4) Hospital Laboratories, Research and Academic Institutes, Diagnostic Centers
Regions Covered North America, Latin America, Europe, South Asia, East Asia, Oceania, Middle East and Africa (MEA)
Countries Covered United States, Canada, Mexico, Brazil, Argentina, Germany, France, United Kingdom, Italy, Spain, Netherlands, China, India, Japan, South Korea, ANZ, GCC Countries, South Africa
Key Players influencing the Loop-Mediated Isothermal Amplification Market Jena Bioscience GmbH, HiberGene Diagnostics, Meridian Bioscience, Inc., Mast Group Ltd., Excellgen, Inc., Merck KGaA, QIAGEN N.V, NIPPON GENE CO., LTD, New England Biolabs, Bio-Rad Laboratories, Inc., Thermo Fisher Scientific
Additional Attributes dollar sales, CAGR trends, product type segmentation, technology adoption, application-based demand, end-user distribution, competitor dollar sales & market share, regional growth trends

Key Segments

By Product:

  • Instruments
    • Incubation Systems
    • Turbidimeters
    • Agarose Gel Electrophoresis
    • Fluorescence Measuring Systems
  • Kits & Reagents
    • DNA Polymerase
    • Primer Mix
    • DNA Polymerase & Primer Mix
    • Dyes
    • Other Reagents

By Technology:

  • Microfluidic Technology
  • Advanced Infrared Optical Technology
  • Modern Microsystem Technology

By Application:

  • Diagnostic Purposes
  • Research Purposes

By End User:

  • Hospital Laboratories
  • Research and Academic Institutes
  • Diagnostic Centers

By Region:

  • North America
  • Latin America
  • Europe
  • South Asia
  • East Asia
  • Oceania
  • Middle East and Africa (MEA)

Table of Content

  1. Executive Summary
  2. Market Overview
  3. Market Background
  4. Global Market Analysis 2020 to 2024 and Forecast, 2025 to 2035
  5. Global Market Analysis 2020 to 2024 and Forecast 2025 to 2035, By Product
    • Instruments
      • Incubation Systems
      • Turbidimeter
      • Agarose Gel Electrophoresis
      • Fluorescence Measuring Systems
    • Kits & Reagents
      • DNA Polymerase
      • Primer Mix
      • DNA Polymerase & Primer Mix
      • Dyes
      • Others
  6. Global Market Analysis 2020 to 2024 and Forecast 2025 to 2035, By Technology
    • Microfluidic Technology
    • Advanced Infrared Optical Technology
    • Modern Microsystem Technology
  7. Global Market Analysis 2020 to 2024 and Forecast 2025 to 2035, By Application
    • Diagnostic Purposes
    • Research Purposes
  8. Global Market Analysis 2020 to 2024 and Forecast 2025 to 2035, By End User
    • Hospital Laboratories
    • Research and Academic Institutes
    • Diagnostic Centres
  9. Global Market Analysis 2020 to 2024 and Forecast 2025 to 2035, By Region
    • North America
    • Latin America
    • Western Europe
    • Eastern Europe
    • South Asia and Pacific
    • East Asia
    • Middle East and Africa
  10. North America Market Analysis 2020 to 2024 and Forecast 2025 to 2035, By Country
  11. Latin America Market Analysis 2020 to 2024 and Forecast 2025 to 2035, By Country
  12. Western Europe Market Analysis 2020 to 2024 and Forecast 2025 to 2035, By Country
  13. Eastern Europe Market Analysis 2020 to 2024 and Forecast 2025 to 2035, By Country
  14. South Asia and Pacific Market Analysis 2020 to 2024 and Forecast 2025 to 2035, By Country
  15. East Asia Market Analysis 2020 to 2024 and Forecast 2025 to 2035, By Country
  16. Middle East and Africa Market Analysis 2020 to 2024 and Forecast 2025 to 2035, By Country
  17. Key Countries Market Analysis
  18. Market Structure Analysis
  19. Competition Analysis
    • Jena Bioscience GmbH
    • HiberGene Diagnostics
    • Meridian Bioscience, Inc.
    • Mast Group Ltd.
    • Excellgen, Inc.
    • Merck KGaA
    • QIAGEN N.V
    • NIPPON GENE CO., LTD
    • New England Biolabs
    • Bio-Rad Laboratories, Inc.
    • Thermo Fisher Scientific
  20. Assumptions & Acronyms Used
  21. Research Methodology

List of Tables

  • Table 1: Global Market Value (USD Million) Forecast by Region, 2020 to 2035
  • Table 2: Global Market Volume (Units) Forecast by Region, 2020 to 2035
  • Table 3: Global Market Value (USD Million) Forecast by Product, 2020 to 2035
  • Table 4: Global Market Volume (Units) Forecast by Product, 2020 to 2035
  • Table 5: Global Market Value (USD Million) Forecast by Technology, 2020 to 2035
  • Table 6: Global Market Volume (Units) Forecast by Technology, 2020 to 2035
  • Table 7: Global Market Value (USD Million) Forecast by Application, 2020 to 2035
  • Table 8: Global Market Volume (Units) Forecast by Application, 2020 to 2035
  • Table 9: Global Market Value (USD Million) Forecast by End User, 2020 to 2035
  • Table 10: Global Market Volume (Units) Forecast by End User, 2020 to 2035
  • Table 11: North America Market Value (USD Million) Forecast by Country, 2020 to 2035
  • Table 12: North America Market Volume (Units) Forecast by Country, 2020 to 2035
  • Table 13: North America Market Value (USD Million) Forecast by Product, 2020 to 2035
  • Table 14: North America Market Volume (Units) Forecast by Product, 2020 to 2035
  • Table 15: North America Market Value (USD Million) Forecast by Technology, 2020 to 2035
  • Table 16: North America Market Volume (Units) Forecast by Technology, 2020 to 2035
  • Table 17: North America Market Value (USD Million) Forecast by Application, 2020 to 2035
  • Table 18: North America Market Volume (Units) Forecast by Application, 2020 to 2035
  • Table 19: North America Market Value (USD Million) Forecast by End User, 2020 to 2035
  • Table 20: North America Market Volume (Units) Forecast by End User, 2020 to 2035
  • Table 21: Latin America Market Value (USD Million) Forecast by Country, 2020 to 2035
  • Table 22: Latin America Market Volume (Units) Forecast by Country, 2020 to 2035
  • Table 23: Latin America Market Value (USD Million) Forecast by Product, 2020 to 2035
  • Table 24: Latin America Market Volume (Units) Forecast by Product, 2020 to 2035
  • Table 25: Latin America Market Value (USD Million) Forecast by Technology, 2020 to 2035
  • Table 26: Latin America Market Volume (Units) Forecast by Technology, 2020 to 2035
  • Table 27: Latin America Market Value (USD Million) Forecast by Application, 2020 to 2035
  • Table 28: Latin America Market Volume (Units) Forecast by Application, 2020 to 2035
  • Table 29: Latin America Market Value (USD Million) Forecast by End User, 2020 to 2035
  • Table 30: Latin America Market Volume (Units) Forecast by End User, 2020 to 2035
  • Table 31: Western Europe Market Value (USD Million) Forecast by Country, 2020 to 2035
  • Table 32: Western Europe Market Volume (Units) Forecast by Country, 2020 to 2035
  • Table 33: Western Europe Market Value (USD Million) Forecast by Product, 2020 to 2035
  • Table 34: Western Europe Market Volume (Units) Forecast by Product, 2020 to 2035
  • Table 35: Western Europe Market Value (USD Million) Forecast by Technology, 2020 to 2035
  • Table 36: Western Europe Market Volume (Units) Forecast by Technology, 2020 to 2035
  • Table 37: Western Europe Market Value (USD Million) Forecast by Application, 2020 to 2035
  • Table 38: Western Europe Market Volume (Units) Forecast by Application, 2020 to 2035
  • Table 39: Western Europe Market Value (USD Million) Forecast by End User, 2020 to 2035
  • Table 40: Western Europe Market Volume (Units) Forecast by End User, 2020 to 2035
  • Table 41: Eastern Europe Market Value (USD Million) Forecast by Country, 2020 to 2035
  • Table 42: Eastern Europe Market Volume (Units) Forecast by Country, 2020 to 2035
  • Table 43: Eastern Europe Market Value (USD Million) Forecast by Product, 2020 to 2035
  • Table 44: Eastern Europe Market Volume (Units) Forecast by Product, 2020 to 2035
  • Table 45: Eastern Europe Market Value (USD Million) Forecast by Technology, 2020 to 2035
  • Table 46: Eastern Europe Market Volume (Units) Forecast by Technology, 2020 to 2035
  • Table 47: Eastern Europe Market Value (USD Million) Forecast by Application, 2020 to 2035
  • Table 48: Eastern Europe Market Volume (Units) Forecast by Application, 2020 to 2035
  • Table 49: Eastern Europe Market Value (USD Million) Forecast by End User, 2020 to 2035
  • Table 50: Eastern Europe Market Volume (Units) Forecast by End User, 2020 to 2035
  • Table 51: South Asia and Pacific Market Value (USD Million) Forecast by Country, 2020 to 2035
  • Table 52: South Asia and Pacific Market Volume (Units) Forecast by Country, 2020 to 2035
  • Table 53: South Asia and Pacific Market Value (USD Million) Forecast by Product, 2020 to 2035
  • Table 54: South Asia and Pacific Market Volume (Units) Forecast by Product, 2020 to 2035
  • Table 55: South Asia and Pacific Market Value (USD Million) Forecast by Technology, 2020 to 2035
  • Table 56: South Asia and Pacific Market Volume (Units) Forecast by Technology, 2020 to 2035
  • Table 57: South Asia and Pacific Market Value (USD Million) Forecast by Application, 2020 to 2035
  • Table 58: South Asia and Pacific Market Volume (Units) Forecast by Application, 2020 to 2035
  • Table 59: South Asia and Pacific Market Value (USD Million) Forecast by End User, 2020 to 2035
  • Table 60: South Asia and Pacific Market Volume (Units) Forecast by End User, 2020 to 2035
  • Table 61: East Asia Market Value (USD Million) Forecast by Country, 2020 to 2035
  • Table 62: East Asia Market Volume (Units) Forecast by Country, 2020 to 2035
  • Table 63: East Asia Market Value (USD Million) Forecast by Product, 2020 to 2035
  • Table 64: East Asia Market Volume (Units) Forecast by Product, 2020 to 2035
  • Table 65: East Asia Market Value (USD Million) Forecast by Technology, 2020 to 2035
  • Table 66: East Asia Market Volume (Units) Forecast by Technology, 2020 to 2035
  • Table 67: East Asia Market Value (USD Million) Forecast by Application, 2020 to 2035
  • Table 68: East Asia Market Volume (Units) Forecast by Application, 2020 to 2035
  • Table 69: East Asia Market Value (USD Million) Forecast by End User, 2020 to 2035
  • Table 70: East Asia Market Volume (Units) Forecast by End User, 2020 to 2035
  • Table 71: Middle East and Africa Market Value (USD Million) Forecast by Country, 2020 to 2035
  • Table 72: Middle East and Africa Market Volume (Units) Forecast by Country, 2020 to 2035
  • Table 73: Middle East and Africa Market Value (USD Million) Forecast by Product, 2020 to 2035
  • Table 74: Middle East and Africa Market Volume (Units) Forecast by Product, 2020 to 2035
  • Table 75: Middle East and Africa Market Value (USD Million) Forecast by Technology, 2020 to 2035
  • Table 76: Middle East and Africa Market Volume (Units) Forecast by Technology, 2020 to 2035
  • Table 77: Middle East and Africa Market Value (USD Million) Forecast by Application, 2020 to 2035
  • Table 78: Middle East and Africa Market Volume (Units) Forecast by Application, 2020 to 2035
  • Table 79: Middle East and Africa Market Value (USD Million) Forecast by End User, 2020 to 2035
  • Table 80: Middle East and Africa Market Volume (Units) Forecast by End User, 2020 to 2035

List of Figures

  • Figure 1: Global Market Value (USD Million) by Product, 2025 to 2035
  • Figure 2: Global Market Value (USD Million) by Technology, 2025 to 2035
  • Figure 3: Global Market Value (USD Million) by Application, 2025 to 2035
  • Figure 4: Global Market Value (USD Million) by End User, 2025 to 2035
  • Figure 5: Global Market Value (USD Million) by Region, 2025 to 2035
  • Figure 6: Global Market Value (USD Million) Analysis by Region, 2020 to 2035
  • Figure 7: Global Market Volume (Units) Analysis by Region, 2020 to 2035
  • Figure 8: Global Market Value Share (%) and BPS Analysis by Region, 2025 to 2035
  • Figure 9: Global Market Y-o-Y Growth (%) Projections by Region, 2025 to 2035
  • Figure 10: Global Market Value (USD Million) Analysis by Product, 2020 to 2035
  • Figure 11: Global Market Volume (Units) Analysis by Product, 2020 to 2035
  • Figure 12: Global Market Value Share (%) and BPS Analysis by Product, 2025 to 2035
  • Figure 13: Global Market Y-o-Y Growth (%) Projections by Product, 2025 to 2035
  • Figure 14: Global Market Value (USD Million) Analysis by Technology, 2020 to 2035
  • Figure 15: Global Market Volume (Units) Analysis by Technology, 2020 to 2035
  • Figure 16: Global Market Value Share (%) and BPS Analysis by Technology, 2025 to 2035
  • Figure 17: Global Market Y-o-Y Growth (%) Projections by Technology, 2025 to 2035
  • Figure 18: Global Market Value (USD Million) Analysis by Application, 2020 to 2035
  • Figure 19: Global Market Volume (Units) Analysis by Application, 2020 to 2035
  • Figure 20: Global Market Value Share (%) and BPS Analysis by Application, 2025 to 2035
  • Figure 21: Global Market Y-o-Y Growth (%) Projections by Application, 2025 to 2035
  • Figure 22: Global Market Value (USD Million) Analysis by End User, 2020 to 2035
  • Figure 23: Global Market Volume (Units) Analysis by End User, 2020 to 2035
  • Figure 24: Global Market Value Share (%) and BPS Analysis by End User, 2025 to 2035
  • Figure 25: Global Market Y-o-Y Growth (%) Projections by End User, 2025 to 2035
  • Figure 26: Global Market Attractiveness by Product, 2025 to 2035
  • Figure 27: Global Market Attractiveness by Technology, 2025 to 2035
  • Figure 28: Global Market Attractiveness by Application, 2025 to 2035
  • Figure 29: Global Market Attractiveness by End User, 2025 to 2035
  • Figure 30: Global Market Attractiveness by Region, 2025 to 2035
  • Figure 31: North America Market Value (USD Million) by Product, 2025 to 2035
  • Figure 32: North America Market Value (USD Million) by Technology, 2025 to 2035
  • Figure 33: North America Market Value (USD Million) by Application, 2025 to 2035
  • Figure 34: North America Market Value (USD Million) by End User, 2025 to 2035
  • Figure 35: North America Market Value (USD Million) by Country, 2025 to 2035
  • Figure 36: North America Market Value (USD Million) Analysis by Country, 2020 to 2035
  • Figure 37: North America Market Volume (Units) Analysis by Country, 2020 to 2035
  • Figure 38: North America Market Value Share (%) and BPS Analysis by Country, 2025 to 2035
  • Figure 39: North America Market Y-o-Y Growth (%) Projections by Country, 2025 to 2035
  • Figure 40: North America Market Value (USD Million) Analysis by Product, 2020 to 2035
  • Figure 41: North America Market Volume (Units) Analysis by Product, 2020 to 2035
  • Figure 42: North America Market Value Share (%) and BPS Analysis by Product, 2025 to 2035
  • Figure 43: North America Market Y-o-Y Growth (%) Projections by Product, 2025 to 2035
  • Figure 44: North America Market Value (USD Million) Analysis by Technology, 2020 to 2035
  • Figure 45: North America Market Volume (Units) Analysis by Technology, 2020 to 2035
  • Figure 46: North America Market Value Share (%) and BPS Analysis by Technology, 2025 to 2035
  • Figure 47: North America Market Y-o-Y Growth (%) Projections by Technology, 2025 to 2035
  • Figure 48: North America Market Value (USD Million) Analysis by Application, 2020 to 2035
  • Figure 49: North America Market Volume (Units) Analysis by Application, 2020 to 2035
  • Figure 50: North America Market Value Share (%) and BPS Analysis by Application, 2025 to 2035
  • Figure 51: North America Market Y-o-Y Growth (%) Projections by Application, 2025 to 2035
  • Figure 52: North America Market Value (USD Million) Analysis by End User, 2020 to 2035
  • Figure 53: North America Market Volume (Units) Analysis by End User, 2020 to 2035
  • Figure 54: North America Market Value Share (%) and BPS Analysis by End User, 2025 to 2035
  • Figure 55: North America Market Y-o-Y Growth (%) Projections by End User, 2025 to 2035
  • Figure 56: North America Market Attractiveness by Product, 2025 to 2035
  • Figure 57: North America Market Attractiveness by Technology, 2025 to 2035
  • Figure 58: North America Market Attractiveness by Application, 2025 to 2035
  • Figure 59: North America Market Attractiveness by End User, 2025 to 2035
  • Figure 60: North America Market Attractiveness by Country, 2025 to 2035
  • Figure 61: Latin America Market Value (USD Million) by Product, 2025 to 2035
  • Figure 62: Latin America Market Value (USD Million) by Technology, 2025 to 2035
  • Figure 63: Latin America Market Value (USD Million) by Application, 2025 to 2035
  • Figure 64: Latin America Market Value (USD Million) by End User, 2025 to 2035
  • Figure 65: Latin America Market Value (USD Million) by Country, 2025 to 2035
  • Figure 66: Latin America Market Value (USD Million) Analysis by Country, 2020 to 2035
  • Figure 67: Latin America Market Volume (Units) Analysis by Country, 2020 to 2035
  • Figure 68: Latin America Market Value Share (%) and BPS Analysis by Country, 2025 to 2035
  • Figure 69: Latin America Market Y-o-Y Growth (%) Projections by Country, 2025 to 2035
  • Figure 70: Latin America Market Value (USD Million) Analysis by Product, 2020 to 2035
  • Figure 71: Latin America Market Volume (Units) Analysis by Product, 2020 to 2035
  • Figure 72: Latin America Market Value Share (%) and BPS Analysis by Product, 2025 to 2035
  • Figure 73: Latin America Market Y-o-Y Growth (%) Projections by Product, 2025 to 2035
  • Figure 74: Latin America Market Value (USD Million) Analysis by Technology, 2020 to 2035
  • Figure 75: Latin America Market Volume (Units) Analysis by Technology, 2020 to 2035
  • Figure 76: Latin America Market Value Share (%) and BPS Analysis by Technology, 2025 to 2035
  • Figure 77: Latin America Market Y-o-Y Growth (%) Projections by Technology, 2025 to 2035
  • Figure 78: Latin America Market Value (USD Million) Analysis by Application, 2020 to 2035
  • Figure 79: Latin America Market Volume (Units) Analysis by Application, 2020 to 2035
  • Figure 80: Latin America Market Value Share (%) and BPS Analysis by Application, 2025 to 2035
  • Figure 81: Latin America Market Y-o-Y Growth (%) Projections by Application, 2025 to 2035
  • Figure 82: Latin America Market Value (USD Million) Analysis by End User, 2020 to 2035
  • Figure 83: Latin America Market Volume (Units) Analysis by End User, 2020 to 2035
  • Figure 84: Latin America Market Value Share (%) and BPS Analysis by End User, 2025 to 2035
  • Figure 85: Latin America Market Y-o-Y Growth (%) Projections by End User, 2025 to 2035
  • Figure 86: Latin America Market Attractiveness by Product, 2025 to 2035
  • Figure 87: Latin America Market Attractiveness by Technology, 2025 to 2035
  • Figure 88: Latin America Market Attractiveness by Application, 2025 to 2035
  • Figure 89: Latin America Market Attractiveness by End User, 2025 to 2035
  • Figure 90: Latin America Market Attractiveness by Country, 2025 to 2035
  • Figure 91: Western Europe Market Value (USD Million) by Product, 2025 to 2035
  • Figure 92: Western Europe Market Value (USD Million) by Technology, 2025 to 2035
  • Figure 93: Western Europe Market Value (USD Million) by Application, 2025 to 2035
  • Figure 94: Western Europe Market Value (USD Million) by End User, 2025 to 2035
  • Figure 95: Western Europe Market Value (USD Million) by Country, 2025 to 2035
  • Figure 96: Western Europe Market Value (USD Million) Analysis by Country, 2020 to 2035
  • Figure 97: Western Europe Market Volume (Units) Analysis by Country, 2020 to 2035
  • Figure 98: Western Europe Market Value Share (%) and BPS Analysis by Country, 2025 to 2035
  • Figure 99: Western Europe Market Y-o-Y Growth (%) Projections by Country, 2025 to 2035
  • Figure 100: Western Europe Market Value (USD Million) Analysis by Product, 2020 to 2035
  • Figure 101: Western Europe Market Volume (Units) Analysis by Product, 2020 to 2035
  • Figure 102: Western Europe Market Value Share (%) and BPS Analysis by Product, 2025 to 2035
  • Figure 103: Western Europe Market Y-o-Y Growth (%) Projections by Product, 2025 to 2035
  • Figure 104: Western Europe Market Value (USD Million) Analysis by Technology, 2020 to 2035
  • Figure 105: Western Europe Market Volume (Units) Analysis by Technology, 2020 to 2035
  • Figure 106: Western Europe Market Value Share (%) and BPS Analysis by Technology, 2025 to 2035
  • Figure 107: Western Europe Market Y-o-Y Growth (%) Projections by Technology, 2025 to 2035
  • Figure 108: Western Europe Market Value (USD Million) Analysis by Application, 2020 to 2035
  • Figure 109: Western Europe Market Volume (Units) Analysis by Application, 2020 to 2035
  • Figure 110: Western Europe Market Value Share (%) and BPS Analysis by Application, 2025 to 2035
  • Figure 111: Western Europe Market Y-o-Y Growth (%) Projections by Application, 2025 to 2035
  • Figure 112: Western Europe Market Value (USD Million) Analysis by End User, 2020 to 2035
  • Figure 113: Western Europe Market Volume (Units) Analysis by End User, 2020 to 2035
  • Figure 114: Western Europe Market Value Share (%) and BPS Analysis by End User, 2025 to 2035
  • Figure 115: Western Europe Market Y-o-Y Growth (%) Projections by End User, 2025 to 2035
  • Figure 116: Western Europe Market Attractiveness by Product, 2025 to 2035
  • Figure 117: Western Europe Market Attractiveness by Technology, 2025 to 2035
  • Figure 118: Western Europe Market Attractiveness by Application, 2025 to 2035
  • Figure 119: Western Europe Market Attractiveness by End User, 2025 to 2035
  • Figure 120: Western Europe Market Attractiveness by Country, 2025 to 2035
  • Figure 121: Eastern Europe Market Value (USD Million) by Product, 2025 to 2035
  • Figure 122: Eastern Europe Market Value (USD Million) by Technology, 2025 to 2035
  • Figure 123: Eastern Europe Market Value (USD Million) by Application, 2025 to 2035
  • Figure 124: Eastern Europe Market Value (USD Million) by End User, 2025 to 2035
  • Figure 125: Eastern Europe Market Value (USD Million) by Country, 2025 to 2035
  • Figure 126: Eastern Europe Market Value (USD Million) Analysis by Country, 2020 to 2035
  • Figure 127: Eastern Europe Market Volume (Units) Analysis by Country, 2020 to 2035
  • Figure 128: Eastern Europe Market Value Share (%) and BPS Analysis by Country, 2025 to 2035
  • Figure 129: Eastern Europe Market Y-o-Y Growth (%) Projections by Country, 2025 to 2035
  • Figure 130: Eastern Europe Market Value (USD Million) Analysis by Product, 2020 to 2035
  • Figure 131: Eastern Europe Market Volume (Units) Analysis by Product, 2020 to 2035
  • Figure 132: Eastern Europe Market Value Share (%) and BPS Analysis by Product, 2025 to 2035
  • Figure 133: Eastern Europe Market Y-o-Y Growth (%) Projections by Product, 2025 to 2035
  • Figure 134: Eastern Europe Market Value (USD Million) Analysis by Technology, 2020 to 2035
  • Figure 135: Eastern Europe Market Volume (Units) Analysis by Technology, 2020 to 2035
  • Figure 136: Eastern Europe Market Value Share (%) and BPS Analysis by Technology, 2025 to 2035
  • Figure 137: Eastern Europe Market Y-o-Y Growth (%) Projections by Technology, 2025 to 2035
  • Figure 138: Eastern Europe Market Value (USD Million) Analysis by Application, 2020 to 2035
  • Figure 139: Eastern Europe Market Volume (Units) Analysis by Application, 2020 to 2035
  • Figure 140: Eastern Europe Market Value Share (%) and BPS Analysis by Application, 2025 to 2035
  • Figure 141: Eastern Europe Market Y-o-Y Growth (%) Projections by Application, 2025 to 2035
  • Figure 142: Eastern Europe Market Value (USD Million) Analysis by End User, 2020 to 2035
  • Figure 143: Eastern Europe Market Volume (Units) Analysis by End User, 2020 to 2035
  • Figure 144: Eastern Europe Market Value Share (%) and BPS Analysis by End User, 2025 to 2035
  • Figure 145: Eastern Europe Market Y-o-Y Growth (%) Projections by End User, 2025 to 2035
  • Figure 146: Eastern Europe Market Attractiveness by Product, 2025 to 2035
  • Figure 147: Eastern Europe Market Attractiveness by Technology, 2025 to 2035
  • Figure 148: Eastern Europe Market Attractiveness by Application, 2025 to 2035
  • Figure 149: Eastern Europe Market Attractiveness by End User, 2025 to 2035
  • Figure 150: Eastern Europe Market Attractiveness by Country, 2025 to 2035
  • Figure 151: South Asia and Pacific Market Value (USD Million) by Product, 2025 to 2035
  • Figure 152: South Asia and Pacific Market Value (USD Million) by Technology, 2025 to 2035
  • Figure 153: South Asia and Pacific Market Value (USD Million) by Application, 2025 to 2035
  • Figure 154: South Asia and Pacific Market Value (USD Million) by End User, 2025 to 2035
  • Figure 155: South Asia and Pacific Market Value (USD Million) by Country, 2025 to 2035
  • Figure 156: South Asia and Pacific Market Value (USD Million) Analysis by Country, 2020 to 2035
  • Figure 157: South Asia and Pacific Market Volume (Units) Analysis by Country, 2020 to 2035
  • Figure 158: South Asia and Pacific Market Value Share (%) and BPS Analysis by Country, 2025 to 2035
  • Figure 159: South Asia and Pacific Market Y-o-Y Growth (%) Projections by Country, 2025 to 2035
  • Figure 160: South Asia and Pacific Market Value (USD Million) Analysis by Product, 2020 to 2035
  • Figure 161: South Asia and Pacific Market Volume (Units) Analysis by Product, 2020 to 2035
  • Figure 162: South Asia and Pacific Market Value Share (%) and BPS Analysis by Product, 2025 to 2035
  • Figure 163: South Asia and Pacific Market Y-o-Y Growth (%) Projections by Product, 2025 to 2035
  • Figure 164: South Asia and Pacific Market Value (USD Million) Analysis by Technology, 2020 to 2035
  • Figure 165: South Asia and Pacific Market Volume (Units) Analysis by Technology, 2020 to 2035
  • Figure 166: South Asia and Pacific Market Value Share (%) and BPS Analysis by Technology, 2025 to 2035
  • Figure 167: South Asia and Pacific Market Y-o-Y Growth (%) Projections by Technology, 2025 to 2035
  • Figure 168: South Asia and Pacific Market Value (USD Million) Analysis by Application, 2020 to 2035
  • Figure 169: South Asia and Pacific Market Volume (Units) Analysis by Application, 2020 to 2035
  • Figure 170: South Asia and Pacific Market Value Share (%) and BPS Analysis by Application, 2025 to 2035
  • Figure 171: South Asia and Pacific Market Y-o-Y Growth (%) Projections by Application, 2025 to 2035
  • Figure 172: South Asia and Pacific Market Value (USD Million) Analysis by End User, 2020 to 2035
  • Figure 173: South Asia and Pacific Market Volume (Units) Analysis by End User, 2020 to 2035
  • Figure 174: South Asia and Pacific Market Value Share (%) and BPS Analysis by End User, 2025 to 2035
  • Figure 175: South Asia and Pacific Market Y-o-Y Growth (%) Projections by End User, 2025 to 2035
  • Figure 176: South Asia and Pacific Market Attractiveness by Product, 2025 to 2035
  • Figure 177: South Asia and Pacific Market Attractiveness by Technology, 2025 to 2035
  • Figure 178: South Asia and Pacific Market Attractiveness by Application, 2025 to 2035
  • Figure 179: South Asia and Pacific Market Attractiveness by End User, 2025 to 2035
  • Figure 180: South Asia and Pacific Market Attractiveness by Country, 2025 to 2035
  • Figure 181: East Asia Market Value (USD Million) by Product, 2025 to 2035
  • Figure 182: East Asia Market Value (USD Million) by Technology, 2025 to 2035
  • Figure 183: East Asia Market Value (USD Million) by Application, 2025 to 2035
  • Figure 184: East Asia Market Value (USD Million) by End User, 2025 to 2035
  • Figure 185: East Asia Market Value (USD Million) by Country, 2025 to 2035
  • Figure 186: East Asia Market Value (USD Million) Analysis by Country, 2020 to 2035
  • Figure 187: East Asia Market Volume (Units) Analysis by Country, 2020 to 2035
  • Figure 188: East Asia Market Value Share (%) and BPS Analysis by Country, 2025 to 2035
  • Figure 189: East Asia Market Y-o-Y Growth (%) Projections by Country, 2025 to 2035
  • Figure 190: East Asia Market Value (USD Million) Analysis by Product, 2020 to 2035
  • Figure 191: East Asia Market Volume (Units) Analysis by Product, 2020 to 2035
  • Figure 192: East Asia Market Value Share (%) and BPS Analysis by Product, 2025 to 2035
  • Figure 193: East Asia Market Y-o-Y Growth (%) Projections by Product, 2025 to 2035
  • Figure 194: East Asia Market Value (USD Million) Analysis by Technology, 2020 to 2035
  • Figure 195: East Asia Market Volume (Units) Analysis by Technology, 2020 to 2035
  • Figure 196: East Asia Market Value Share (%) and BPS Analysis by Technology, 2025 to 2035
  • Figure 197: East Asia Market Y-o-Y Growth (%) Projections by Technology, 2025 to 2035
  • Figure 198: East Asia Market Value (USD Million) Analysis by Application, 2020 to 2035
  • Figure 199: East Asia Market Volume (Units) Analysis by Application, 2020 to 2035
  • Figure 200: East Asia Market Value Share (%) and BPS Analysis by Application, 2025 to 2035
  • Figure 201: East Asia Market Y-o-Y Growth (%) Projections by Application, 2025 to 2035
  • Figure 202: East Asia Market Value (USD Million) Analysis by End User, 2020 to 2035
  • Figure 203: East Asia Market Volume (Units) Analysis by End User, 2020 to 2035
  • Figure 204: East Asia Market Value Share (%) and BPS Analysis by End User, 2025 to 2035
  • Figure 205: East Asia Market Y-o-Y Growth (%) Projections by End User, 2025 to 2035
  • Figure 206: East Asia Market Attractiveness by Product, 2025 to 2035
  • Figure 207: East Asia Market Attractiveness by Technology, 2025 to 2035
  • Figure 208: East Asia Market Attractiveness by Application, 2025 to 2035
  • Figure 209: East Asia Market Attractiveness by End User, 2025 to 2035
  • Figure 210: East Asia Market Attractiveness by Country, 2025 to 2035
  • Figure 211: Middle East and Africa Market Value (USD Million) by Product, 2025 to 2035
  • Figure 212: Middle East and Africa Market Value (USD Million) by Technology, 2025 to 2035
  • Figure 213: Middle East and Africa Market Value (USD Million) by Application, 2025 to 2035
  • Figure 214: Middle East and Africa Market Value (USD Million) by End User, 2025 to 2035
  • Figure 215: Middle East and Africa Market Value (USD Million) by Country, 2025 to 2035
  • Figure 216: Middle East and Africa Market Value (USD Million) Analysis by Country, 2020 to 2035
  • Figure 217: Middle East and Africa Market Volume (Units) Analysis by Country, 2020 to 2035
  • Figure 218: Middle East and Africa Market Value Share (%) and BPS Analysis by Country, 2025 to 2035
  • Figure 219: Middle East and Africa Market Y-o-Y Growth (%) Projections by Country, 2025 to 2035
  • Figure 220: Middle East and Africa Market Value (USD Million) Analysis by Product, 2020 to 2035
  • Figure 221: Middle East and Africa Market Volume (Units) Analysis by Product, 2020 to 2035
  • Figure 222: Middle East and Africa Market Value Share (%) and BPS Analysis by Product, 2025 to 2035
  • Figure 223: Middle East and Africa Market Y-o-Y Growth (%) Projections by Product, 2025 to 2035
  • Figure 224: Middle East and Africa Market Value (USD Million) Analysis by Technology, 2020 to 2035
  • Figure 225: Middle East and Africa Market Volume (Units) Analysis by Technology, 2020 to 2035
  • Figure 226: Middle East and Africa Market Value Share (%) and BPS Analysis by Technology, 2025 to 2035
  • Figure 227: Middle East and Africa Market Y-o-Y Growth (%) Projections by Technology, 2025 to 2035
  • Figure 228: Middle East and Africa Market Value (USD Million) Analysis by Application, 2020 to 2035
  • Figure 229: Middle East and Africa Market Volume (Units) Analysis by Application, 2020 to 2035
  • Figure 230: Middle East and Africa Market Value Share (%) and BPS Analysis by Application, 2025 to 2035
  • Figure 231: Middle East and Africa Market Y-o-Y Growth (%) Projections by Application, 2025 to 2035
  • Figure 232: Middle East and Africa Market Value (USD Million) Analysis by End User, 2020 to 2035
  • Figure 233: Middle East and Africa Market Volume (Units) Analysis by End User, 2020 to 2035
  • Figure 234: Middle East and Africa Market Value Share (%) and BPS Analysis by End User, 2025 to 2035
  • Figure 235: Middle East and Africa Market Y-o-Y Growth (%) Projections by End User, 2025 to 2035
  • Figure 236: Middle East and Africa Market Attractiveness by Product, 2025 to 2035
  • Figure 237: Middle East and Africa Market Attractiveness by Technology, 2025 to 2035
  • Figure 238: Middle East and Africa Market Attractiveness by Application, 2025 to 2035
  • Figure 239: Middle East and Africa Market Attractiveness by End User, 2025 to 2035
  • Figure 240: Middle East and Africa Market Attractiveness by Country, 2025 to 2035

Frequently Asked Questions

What is the Market Size of the Loop-mediated Isothermal Amplification Industry?

The market size of the loop-mediated isothermal amplification industry is estimated to be USD 115.7 million in 2025.

What are the Key Companies in the Loop-mediated Isothermal Amplification Market?

Jena Bioscience GmbH, HiberGene Diagnostics, Meridian Bioscience, Inc., and Mast Group Ltd. are some of the key companies in the loop-mediated isothermal amplification market.

How Much Will the Loop-mediated Isothermal Amplification Market Be Worth in 2035?

The loop-mediated isothermal amplification market is expected to reach a valuation of USD 184.8 million in 2035.

What is the Outlook for the Loop-mediated Isothermal Amplification Industry?

The loop-mediated isothermal amplification industry is expected to progress at a solid CAGR of 4.9% over the period from 2025 to 2035.

What are the Segments of the Loop-mediated Isothermal Amplification Market?

The loop-mediated isothermal amplification market can be segmented into the following categories: product, technology, application, and end-user.

How Will Demand for Loop-mediated Isothermal Amplification Progress in India?

The loop-mediated isothermal amplification market is predicted to progress at a CAGR of 6.2% in India over the period from 2025 to 2035.

Explore Similar Insights

Future Market Insights

Loop-mediated Isothermal Amplification Market