The 5G Testing Market is estimated to be valued at USD 3.9 billion in 2025 and is projected to reach USD 8.6 billion by 2035, registering a compound annual growth rate (CAGR) of 8.1% over the forecast period.
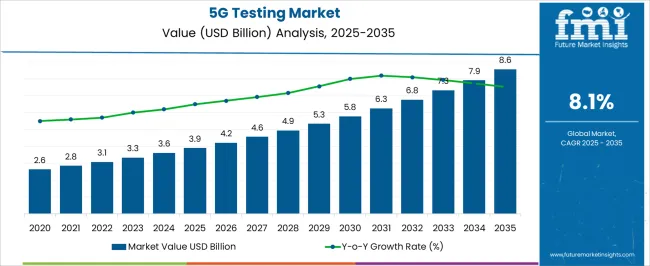
| Metric | Value |
|---|---|
| 5G Testing Market Estimated Value in (2025 E) | USD 3.9 billion |
| 5G Testing Market Forecast Value in (2035 F) | USD 8.6 billion |
| Forecast CAGR (2025 to 2035) | 8.1% |
The 5G testing market is experiencing robust expansion, supported by the accelerating deployment of 5G infrastructure and the increasing complexity of network ecosystems. Testing solutions are being adopted to validate network performance, ensure compliance with international standards, and optimize device interoperability across multi-vendor environments.
The rising demand for low latency, high bandwidth, and massive connectivity has driven telecom operators and equipment providers to prioritize advanced testing frameworks. Hardware and software solutions are being deployed extensively to measure spectrum efficiency, signal integrity, and real-time throughput.
The market outlook remains strong as governments and enterprises continue to invest in digital transformation, edge computing, and IoT ecosystems that depend on reliable 5G performance. The convergence of cloud-native testing platforms and AI-driven analytics is expected to further accelerate innovation, supporting a sustainable growth trajectory for the market.
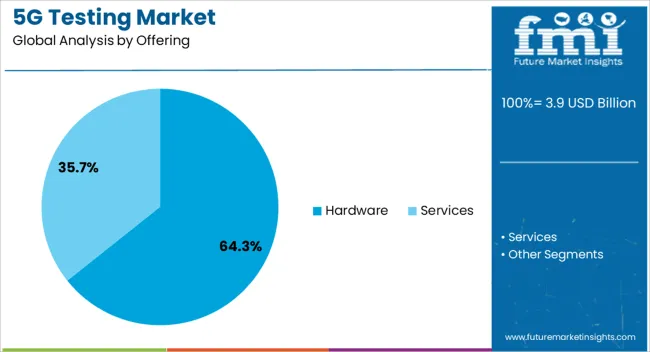
The hardware segment dominates the offering category, accounting for approximately 64.3% share of the 5G testing market. This leadership is attributed to the growing deployment of network analyzers, spectrum testers, and signal generators that ensure system reliability in dynamic 5G environments.
Hardware testing equipment is integral for validating antenna performance, device interoperability, and spectrum compliance across diverse frequency bands. The segment’s prominence is reinforced by telecom operators’ reliance on physical test instruments during initial rollouts and ongoing maintenance phases.
Increased R&D activity among equipment manufacturers has further driven demand for specialized hardware capable of supporting high-frequency mmWave bands. With continued investments in infrastructure expansion and technology validation, the hardware segment is projected to maintain its dominant position in the near future.
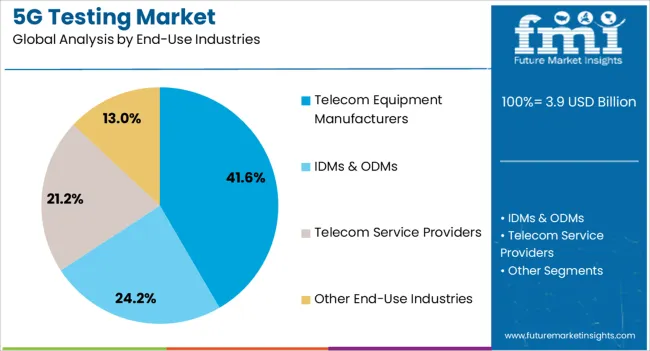
The telecom equipment manufacturers segment holds approximately 41.6% share of the end-use industries category, underscoring its central role in the 5G testing market. This segment’s dominance is supported by the need for comprehensive validation of equipment performance before large-scale network deployments.
Manufacturers rely heavily on testing solutions to ensure compliance with international standards and to address the complexities of multi-band, multi-vendor ecosystems. The segment benefits from consistent investment in R&D, where testing tools play a vital role in accelerating product development cycles.
As global 5G adoption expands, equipment manufacturers face increasing pressure to deliver high-quality, reliable infrastructure solutions. The reliance on advanced testing equipment for prototype validation and pre-commercial trials ensures sustained demand, reinforcing this segment’s leading market position.
5G testing as a service began before 2020 as many mobile network testing and optimization companies were aiding enterprises engaged in 5G research and development.
By the end of 2020, the net revenue generated from global demand for 5G testing equipment and services was figured out to be around USD 2.1 billion. The rollout of 5G network testing and validation of the 5G spectrum accelerated in the following years, driving the demand for such services at 11.4% CAGR.
| Attributes | Details |
|---|---|
| Market Size (2020) | USD 2.1 billion |
| Market Size (2025) | USD 3.2 billion |
| Market (CAGR 2020 to 2025) | 11.4% CAGR |
The 5G testing equipment and solutions are expected to gain more traction due to the proliferation of IoT or IIoT devices and the growth in linked devices. Such technologies have amplified the use of specialized testing services to guarantee that 5G networks can manage various traffic kinds and connection requirements.
Network slicing enables the development of virtualized, specially designed network segments for certain uses and has expanded the scope of the global 5G testing industry. This new technology is expected to propel the market by increasing the demand for protocol and interference testing to guarantee that network slicing is implemented and performed correctly.
The table below illustrates the expected growth rate for the 5G technology testing within different territorial boundaries. The rapid expansion of 5G network services in Asia is anticipated to drive the regional markets of China, Japan, and South Korea at a greater pace. Meanwhile, North American and European countries like the United States and the United Kingdom are expected to witness a relatively slower growth rate due to market saturation.
| Regional Market Comparison | CAGR (2025 to 2035) |
|---|---|
| United States | 8.4% |
| China | 9.2% |
| United Kingdom | 8.6% |
| Japan | 9.3% |
| South Korea | 9.5% |
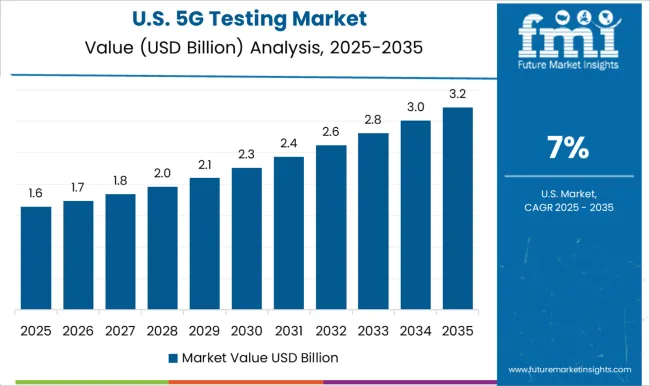
Prominent factors that are anticipated to drive the United States 5G testing market at 8.4% CAGR between 2025 and 2035 include:
Leading factors that are expected to retain the growth rate of China's 5G testing market at 9.2% till 2035 include:
The table below lists the predicted net worth of the regional markets for 5G performance testing by 2035. The United States is observed to retain its dominance through the projected time frame, followed by China. The 5G testing market in Japan is expected to emerge as lucrative with a higher CAGR and a forecast valuation to compete with China.
| Regional Market Size | Market Size by 2035 (by Value) |
|---|---|
| United States | USD 1.4 billion |
| China | USD 1.2 billion |
| United Kingdom | USD 315.1 million |
| Japan | USD 878.5 million |
| South Korea | USD 429.1 million |
Based on different offerings by 5G testing market participants, the 5G testing hardware constitutes the leading segment, which is predicted to grow at 8% through 2035.
| Attributes | Details |
|---|---|
| Top Offering Type or Segment | Hardware |
| Market Segment CAGR from 2025 to 2035 | 8% |
| Market Segment CAGR from 2020 to 2025 | 11.2% |
Some of the key trends propelling the 5G testing device or hardware segment include:
Among the different end-use industries requiring testing solutions for 5G networks, IDMs and ODMs are the leading demand generators and are poised to expand at 7.8% CAGR till 2035.
| Attributes | Details |
|---|---|
| Top End-use Industry Segment | IDMs & ODMs |
| Market Segment CAGR from 2025 to 2035 | 7.8% |
| Market Segment CAGR from 2020 to 2025 | 11.1% |
Some of the notable factors that have increased the demand for 5G test equipment by this segment include:
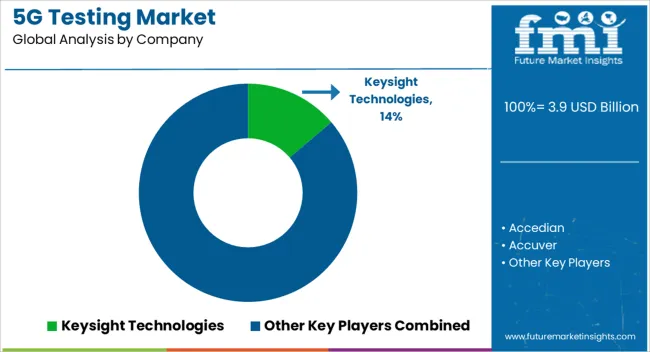
The competition among telecom carriers and equipment makers to capture the rapidly expanding and evolving 5G market has resulted in the emergence of many new players in a very short time. So, the global market can be observed to be fragmenting fast. Emerging market players are also eagerly collaborating and partnering with leading industries for 5G research and development to consolidate their market share.
Recent Developments
| Attribute | Details |
|---|---|
| Estimated Market Size (2025) | USD 3.6 billion |
| Projected Market Size (2035) | USD 7.8 billion |
| Anticipated Growth Rate (2025 to 2035) | 8.2% |
| Forecast Period | 2025 to 2035 |
| Historical Data Available for | 2020 to 2025 |
| Market Analysis | USD million or billion for Value and Units for Volume |
| Key Regions Covered | North America; Latin America; Europe; the Middle East & Africa (MEA); East Asia; South Asia and Oceania |
| Key Countries Covered | United States, Canada, Brazil, Mexico, Germany, Spain, Italy, France, United Kingdom, Russia, China, India, Australia & New Zealand, GCC Countries, and South Africa |
| Key Segments Covered | By Offering, By End Use, and By Region |
| Key Companies Profiled | Accedian; Accuver; Anokiwave, Inc.; Anritsu; Aritza Networks, Inc.; Cohu, Inc.; Consultix Wireless; Emite; Exfo, Inc.; Gao Tek & GAO Group, Inc; GI Communications, Inc.; Innowireless Co Ltd.; Keysight Technologies; Macom; Marvin Test Solutions, Inc.; National Instruments Corp.; Pctel, Inc.; Rohde & Schwarz; Simnovus; Spirent Communications |
| Report Coverage | Market Forecast, Company Share Analysis, Competition Intelligence, DROT Analysis, Market Dynamics and Challenges, and Strategic Growth Initiatives |
| Customization & Pricing | Available upon Request |
The global 5G testing market is estimated to be valued at USD 3.9 billion in 2025.
The market size for the 5G testing market is projected to reach USD 8.6 billion by 2035.
The 5G testing market is expected to grow at a 8.1% CAGR between 2025 and 2035.
The key product types in 5G testing market are hardware and services.
In terms of end-use industries, telecom equipment manufacturers segment to command 41.6% share in the 5G testing market in 2025.


Full Research Suite comprises of:
Market outlook & trends analysis
Interviews & case studies
Strategic recommendations
Vendor profiles & capabilities analysis
5-year forecasts
8 regions and 60+ country-level data splits
Market segment data splits
12 months of continuous data updates
DELIVERED AS:
PDF EXCEL ONLINE
5G Testing Equipment Market Analysis - Size, Growth, and Forecast 2025 to 2035
5G Solid State Switches Market Size and Share Forecast Outlook 2025 to 2035
5G Gain Block Amplifier Market Size and Share Forecast Outlook 2025 to 2035
5G Driver Amplifier Market Size and Share Forecast Outlook 2025 to 2035
5G Millimeter Wave RF Transceiver Market Size and Share Forecast Outlook 2025 to 2035
5G in Healthcare Market Analysis Size and Share Forecast Outlook 2025 to 2035
5G Temperature-Compensated Crystal Oscillator (TCXO) Market Size and Share Forecast Outlook 2025 to 2035
5G Remote Surgery System Market Analysis - Size, Share, and Forecast Outlook 2025 to 2035
5G Telemedicine Platform Market Size and Share Forecast Outlook 2025 to 2035
5G Industrial IOT Market Size and Share Forecast Outlook 2025 to 2035
5G IoT Market Size and Share Forecast Outlook 2025 to 2035
5G in Defense Market Size and Share Forecast Outlook 2025 to 2035
5G Enterprise Private Network Market Size and Share Forecast Outlook 2025 to 2035
5G Edge Cloud Network and Services Market Size and Share Forecast Outlook 2025 to 2035
5G Automotive Grade Product Market Size and Share Forecast Outlook 2025 to 2035
5G Enterprise Market Size and Share Forecast Outlook 2025 to 2035
5G Infrastructure Market Size and Share Forecast Outlook 2025 to 2035
5G RAN Market Size and Share Forecast Outlook 2025 to 2035
5G Security Market Size and Share Forecast Outlook 2025 to 2035
5G technology market Analysis by Technology Type, Application, Vertical, and Region – Growth, trends and forecast from 2025 to 2035

Thank you!
You will receive an email from our Business Development Manager. Please be sure to check your SPAM/JUNK folder too.
Chat With
MaRIA