5G Industrial IoT Market Outlook (2023 to 2033)

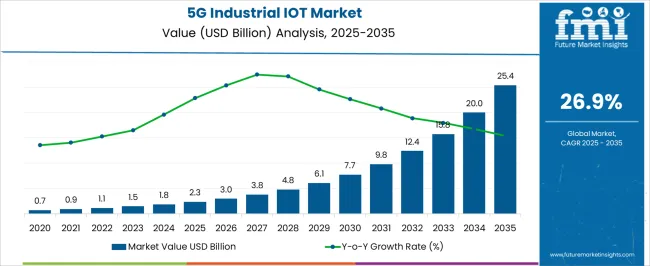
The global 5G industrial IoT market size is set to gain monumental growth from 2023 to 2033. According to the research report published by Future Market Insights, the global market is predicted to surpass a valuation of USD 1,421.8 million in 2023. It is poised to hit a valuation of USD 17,094.9 million by 2033. The market is foreseen to thrive at an astronomical CAGR of 28.2% from 2023 to 2033.

Attributes Details
5G Industrial IoT Market Share (2022) USD 1,123.1 million
5G Industrial IoT Market Share (2023) USD 1,421.8 million
5G Industrial IoT Market Share (2033) USD 17,094.9 million
CAGR (2023 to 2033) 28.2%

5G Industrial IoT Market Historical Analysis (2018 to 2022) Vs. Forecast Outlook (2023 to 2033)

The global 5G industrial IoT industry size developed at a CAGR of 26.1% from 2018 to 2022. In 2018, the global market size stood at USD 443.5 million. In the following years, the market witnessed significant growth, accounting for USD 1,123.1 million in 2022.

5G industrial IoT has contributed assistance to the manufacturing sector as with the help of this they can automate the production process with great precision reducing errors and with safety. Of this, productivity has increased without rendering quality and safety issues. There is a huge demand for 5G industrial IoT due to its fast connectivity and reliable service, many industries are adopting the technology to overcome the data traffic and uninterrupted connections. With the development of various M2M associations across manufacturing industries 5G industrial IoT sector is projected to record a CAGR of 28.2% over the coming 10 years.

  • The 5G industrial IoT sector reached a valuation of USD 890 million in 2021.
  • FMI estimates that 5G Industrial IoT revenue is anticipated to reach nearly USD 17,094.9 million by 2033.
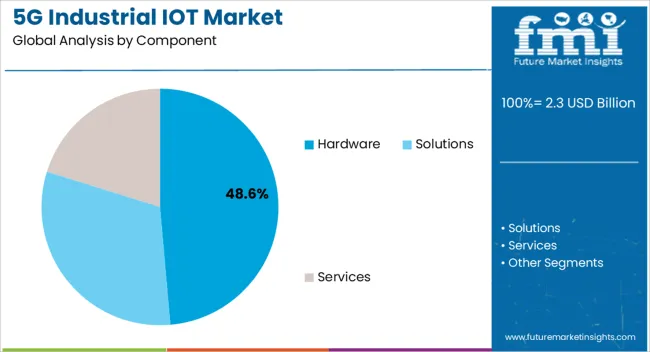
  • The solutions segment currently holds the dominant market share in the 5G industrial IoT sector.
  • North America is expected to be a rapidly growing market for 5G industrial IoT owing to technological adaptations.
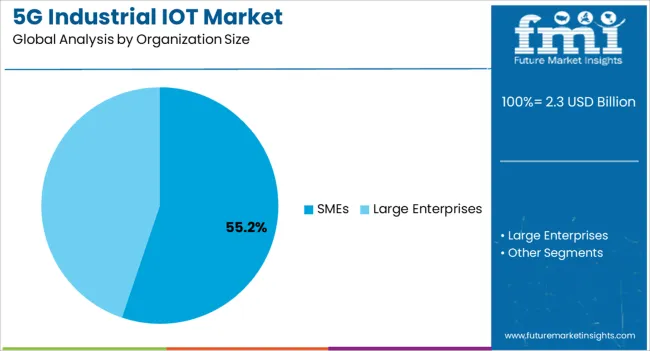
  • Large enterprises show a high growth potential in the 5G industrial IoT industry in the components segment. It is expected to register a rate of about 28% during the next ten years.

What Factors are Leading to the Growth of the 5G Industrial IoT Industry?

The implementation of 5G technologies can markedly revolutionize the workplace's management and influence workforce planning at the office. 5G, together with the Internet of Things, has the opportunity to robotize the office of executive directors' actions, such as booking tasks and organizing resources and licenses for each one of the employees on the assembling floor.

5G, together with IoT-enabled linked comfort-driven trade arrangements, may gain addressing abilities at a superior level, making work environments more productive, smooth, secure, and useful. Likewise in a wide range of industries, the adoption of technology is boosting the market.

Businesses around the world have sought to integrate this business for fast set-up and mass transmission, owing to its ultrahigh reliability that's sparked usage in the world's most critical industries. Connectivity is of vital significance to make the worldwide community intact and that's carried out by utilizing the 5G networks in most industries.

5G industrial Internet of Things has attracted the manufacturing sector and discrete industries in a big way, contributing to the growth of the overall market. In discrete industries, Industry Internet of Things-enabled items serves as an efficient method for increasing the quality of the item's functional elements and providing a unique motivation for the clients to purchase them.

5G innovative IoT setups help to boost the entire productivity of the consumer electronics area of the media little organization (IoT) through the stabilization of a larger network among all IoT gadgets.

How are the Technological Innovations in 5G Industrial IoT Technologies Boosting the Market?

5G technology has decreased the cost of Internet of Things (IoT) devices, sensors, and electronics, which has contributed to many trying to keep up with the devices after a short while.

This momentum has contributed to the market in a positive direction. 5G is anticipated to ensure the most extreme double-dealing skills of IT devices by optimizing the link between them and supplying a considerable increase of 10 Gbps at the start of a link and enhancing the scope and ability to connect devices and items.

5G components speed up the execution of Industry 4.0 and incorporate Enhanced Mobile Broadband (eMBB), which gives higher data transfer capacity and rates in densely populated regions and industrial areas, like manufacturing plants.

Broadband network is relied upon to improve security by allowing users to make use of telematics devices in factories working during the Fourth Industrial Age. Industry 4.0 of assembling process changes incorporate autonomous vehicles, commercial and industrial robots, 3D printing with advanced materials, better sensors, etc.

5G organizations work with mindful and sensible incorporation of these developments leading to increased awareness and resourcefulness, capability, and adaptability in manufacturing processes.

Category-wise Insights

What Makes Solutions a High Revenue Generator in the Global Market?

In 2022, the solutions segment by component is expected to create an enormous revenue stream during the forecast period. In 2022, the solutions segment captured 45.20% shares in the global market. The 5G industrial IoT solution components are designed to meet the unique requirements of various industries.

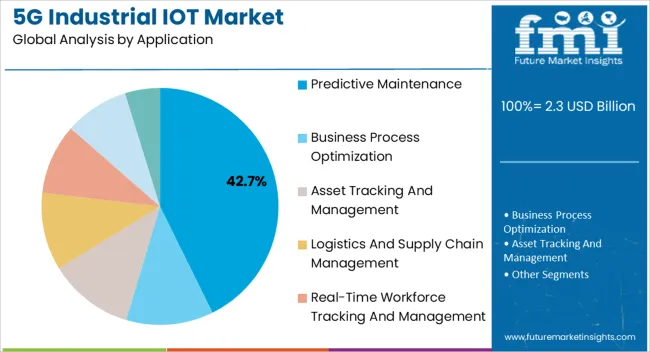
They provide features tailored for specific domains, like supply chain optimization, asset tracking, remote monitoring, predictive maintenance, and more. For businesses working across a variety of industries, this industry-focused strategy raises the value and relevance of solution components.

Large Enterprises Show Significant Potential over the Next Ten Years

Large enterprises show a huge potential for growth in the 5G Industrial IoT industry in the organization size segment. Revenue through large enterprises is expected to record a CAGR of 28% during the next ten years. In 2022, the large enterprise segment by organization size captured 61.2% of shares in the global market.

Large enterprises are very much attracted to the technology due to its vast range of applications in industries. Large enterprises have large funds to invest in their 5G IoT infrastructure, as compared to SMEs.

They use 5G technology to efficiently manage direct or remote their assets across the globe. To connect and look after the processes high speed and reliable service are required for that purpose there is a huge pull for 5G across industries.

For workforce tracking, predictive maintenance, and business process optimization large enterprises are agile in using the 5G industrial IoTs and implementing these applications. Several industries use technology in logistics and supply chain management, owing to which they have increased efficiency and have shown subsequent growth in the business.

Region-wise Analysis

Which Region is Projected to Offer High Opportunity for 5G Industrial IoT?

The market is relied upon to develop at a significant rate in the forthcoming years. The market in the Asia Pacific is relied upon to enroll a high CAGR during the forecast period because of expanded interest in 5G industrial IoT.

The region is set to rule 5G, edge processing, blockchain, and 5G center innovation, because of its size, variety, and the essential lead taken by countries, including South Korea, China, and Japan.

The Association of Southeast Asian Nations (APAC) is seeing a vast increase in the adoption of 5G technology and the development of manufacturing industries within the area. The government is taking action to help develop the technology by granting the necessary concessions for infrastructure and research & development.
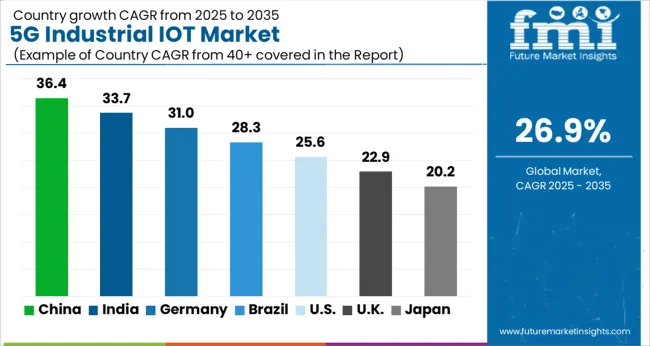
Country-wise Analysis

Which Country Topped the Revenue Generation for the Market?

India dominated the global market in 2022. India captured 28.4% shares in the global market in 2022. The population of India is enormous, and its economy is expanding quickly. For the adoption and deployment of 5G industrial IoT solutions, the market's sheer size presents impressive prospects.

Intending to transform India into a society where everyone has access to the internet, the Indian government has been supporting the Digital India campaign. Along with the implementation of 5G technology, this plan calls for the establishment of smart cities, digital infrastructure, and the Internet of Things (IoT). India is recognized for its highly qualified software developers and engineers and has a thriving IT services sector.
Countries CAGR Share in Global Market (2022)
United States 19.2%
United Kingdom 23.1%
China 24.1%
Japan 6.3%
India 28.4%

Competitive Landscape

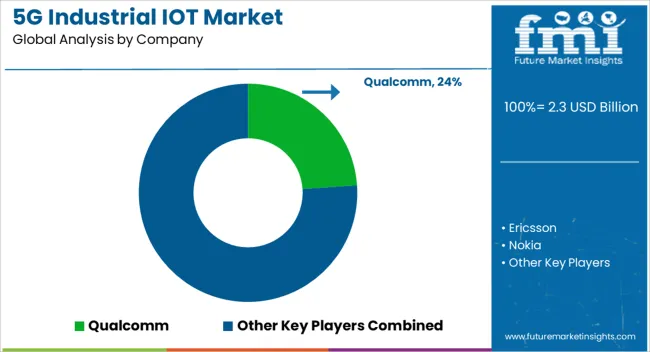
Key players such as Qualcomm; Ericsson; Nokia; Huawei; Cisco adopt several technological strategies to enhance their revenue and market standings. These strategies include research and development investments, mergers, acquisitions, partnerships, collaborations, and others.

Recent Developments Observed by FMI:

  • In March 2022, Ericsson & Vodafone cooperated to frame an organization cut on 5G SA involving single RAN work for high-transmission capacity and low-inertness network. This can be conveyed for the computer-generated reality use case in a retail location.
  • In March 2022, Cisco & Tech Mahindra announced their collaboration to modernize 5G infrastructure with routed optical networking. Cisco has expertise in routed optical fiber whereas Tech Mahindra has expertise in IP-based, software-driven 5G networks.
  • Similarly, recent developments related to companies offering 5G Industrial IoT have been tracked by the team at FMI, which are available in the full report.

Key Players in the Global Market

  • Qualcomm
  • Ericsson
  • Nokia
  • Huawei
  • Cisco
  • AT&T
  • IBM
  • Microsoft
  • Seimens
  • Verizon

Scope of the Report

Attribute Details
Forecast Period 2023 to 2033
Historical Data Available for 2018 to 2022
Market Analysis USD million for Value
Key Regions Covered North America; Latin America; Europe; Asia Pacific; The Middle East & Africa (MEA)
Key Countries Covered United States, Canada, Germany, United Kingdom, Nordic, Russia, BENELUX, Poland, France, Spain, Italy, Czech Republic, Hungary, Rest of EMEAI, Brazil, Peru, Argentina, Mexico, South Africa, Northern Africa, GCC Countries, China, Japan, South Korea, India, ASEAN, Thailand, Malaysia, Indonesia, Australia, New Zealand, Others
Key Segments Covered Component, Organization Size, Application, End-user, Region
Report Coverage Market Forecast, Company Share Analysis, Competition Intelligence, Trend Analysis, Market Dynamics and Challenges, and Strategic Growth Initiatives

Market Segmentation

By Component:

  • Hardware
  • Solutions
  • Services

By Organization Size:

  • SMEs
  • Large Enterprises

By Application:

  • Predictive Maintenance
  • Business Process Optimization
  • Asset Tracking and Management
  • Logistics and Supply Chain Management
  • Real-time Workforce Tracking and Management
  • Automation Control and Management
  • Emergency and Incident Management, and Business Communication

By End User:

  • Process Industries
  • Discrete Industries

By Region:

  • North America
  • Latin America
  • Europe
  • Asia Pacific
  • The Middle East & Africa (MEA)

Table of Content

  • 1. Executive Summary
  • 2. Market Overview
  • 3. Market Background
  • 4. Global Market Analysis 2018 to 2022 and Forecast, 2023 to 2033
  • 5. Global Market Analysis 2018 to 2022 and Forecast 2023 to 2033, By Component
    • 5.1. Hardware
    • 5.2. Solution
    • 5.3. Services
  • 6. Global Market Analysis 2018 to 2022 and Forecast 2023 to 2033, By Organization Size
    • 6.1. SMEs
    • 6.2. Large Enterprises
  • 7. Global Market Analysis 2018 to 2022 and Forecast 2023 to 2033, By Application
    • 7.1. Predictive Maintenance
    • 7.2. Business Process Optimization
    • 7.3. Asset Tracking and Management
    • 7.4. Logistics and Supply Chain Management
    • 7.5. Real-Time Workforce Tracking and Management
    • 7.6. Automation Control and Management
    • 7.7. Emergency and Incident Management, and Business Communication
  • 8. Global Market Analysis 2018 to 2022 and Forecast 2023 to 2033, By End User
    • 8.1. Process Industries
    • 8.2. Discrete Industries
  • 9. Global Market Analysis 2018 to 2022 and Forecast 2023 to 2033, By Region
    • 9.1. North America
    • 9.2. Latin America
    • 9.3. Europe
    • 9.4. South Asia
    • 9.5. East Asia
    • 9.6. Oceania
    • 9.7. MEA
  • 10. North America Market Analysis 2018 to 2022 and Forecast 2023 to 2033, By Country
  • 11. Latin America Market Analysis 2018 to 2022 and Forecast 2023 to 2033, By Country
  • 12. Europe Market Analysis 2018 to 2022 and Forecast 2023 to 2033, By Country
  • 13. South Asia Market Analysis 2018 to 2022 and Forecast 2023 to 2033, By Country
  • 14. East Asia Market Analysis 2018 to 2022 and Forecast 2023 to 2033, By Country
  • 15. Oceania Market Analysis 2018 to 2022 and Forecast 2023 to 2033, By Country
  • 16. MEA Market Analysis 2018 to 2022 and Forecast 2023 to 2033, By Country
  • 17. Key Countries Market Analysis
  • 18. Market Structure Analysis
  • 19. Competition Analysis
    • 19.1. Qualcomm
    • 19.2. Ericsson
    • 19.3. Nokia
    • 19.4. Huawei
    • 19.5. Cisco
    • 19.6. AT&T
    • 19.7. IBM
    • 19.8. Microsoft
    • 19.9. Siemens
    • 19.10. Verizon
  • 20. Assumptions & Acronyms Used
  • 21. Research Methodology

List of Tables

Table 1: Global Market Value (US$ Million) Forecast by Region, 2018 to 2033

Table 2: Global Market Value (US$ Million) Forecast by Component, 2018 to 2033

Table 3: Global Market Value (US$ Million) Forecast by Organization Size, 2018 to 2033

Table 4: Global Market Value (US$ Million) Forecast by Application, 2018 to 2033

Table 5: Global Market Value (US$ Million) Forecast by End User, 2018 to 2033

Table 6: North America Market Value (US$ Million) Forecast by Country, 2018 to 2033

Table 7: North America Market Value (US$ Million) Forecast by Component, 2018 to 2033

Table 8: North America Market Value (US$ Million) Forecast by Organization Size, 2018 to 2033

Table 9: North America Market Value (US$ Million) Forecast by Application, 2018 to 2033

Table 10: North America Market Value (US$ Million) Forecast by End User, 2018 to 2033

Table 11: Latin America Market Value (US$ Million) Forecast by Country, 2018 to 2033

Table 12: Latin America Market Value (US$ Million) Forecast by Component, 2018 to 2033

Table 13: Latin America Market Value (US$ Million) Forecast by Organization Size, 2018 to 2033

Table 14: Latin America Market Value (US$ Million) Forecast by Application, 2018 to 2033

Table 15: Latin America Market Value (US$ Million) Forecast by End User, 2018 to 2033

Table 16: Europe Market Value (US$ Million) Forecast by Country, 2018 to 2033

Table 17: Europe Market Value (US$ Million) Forecast by Component, 2018 to 2033

Table 18: Europe Market Value (US$ Million) Forecast by Organization Size, 2018 to 2033

Table 19: Europe Market Value (US$ Million) Forecast by Application, 2018 to 2033

Table 20: Europe Market Value (US$ Million) Forecast by End User, 2018 to 2033

Table 21: South Asia Market Value (US$ Million) Forecast by Country, 2018 to 2033

Table 22: South Asia Market Value (US$ Million) Forecast by Component, 2018 to 2033

Table 23: South Asia Market Value (US$ Million) Forecast by Organization Size, 2018 to 2033

Table 24: South Asia Market Value (US$ Million) Forecast by Application, 2018 to 2033

Table 25: South Asia Market Value (US$ Million) Forecast by End User, 2018 to 2033

Table 26: East Asia Market Value (US$ Million) Forecast by Country, 2018 to 2033

Table 27: East Asia Market Value (US$ Million) Forecast by Component, 2018 to 2033

Table 28: East Asia Market Value (US$ Million) Forecast by Organization Size, 2018 to 2033

Table 29: East Asia Market Value (US$ Million) Forecast by Application, 2018 to 2033

Table 30: East Asia Market Value (US$ Million) Forecast by End User, 2018 to 2033

Table 31: Oceania Market Value (US$ Million) Forecast by Country, 2018 to 2033

Table 32: Oceania Market Value (US$ Million) Forecast by Component, 2018 to 2033

Table 33: Oceania Market Value (US$ Million) Forecast by Organization Size, 2018 to 2033

Table 34: Oceania Market Value (US$ Million) Forecast by Application, 2018 to 2033

Table 35: Oceania Market Value (US$ Million) Forecast by End User, 2018 to 2033

Table 36: MEA Market Value (US$ Million) Forecast by Country, 2018 to 2033

Table 37: MEA Market Value (US$ Million) Forecast by Component, 2018 to 2033

Table 38: MEA Market Value (US$ Million) Forecast by Organization Size, 2018 to 2033

Table 39: MEA Market Value (US$ Million) Forecast by Application, 2018 to 2033

Table 40: MEA Market Value (US$ Million) Forecast by End User, 2018 to 2033

List of Figures

Figure 1: Global Market Value (US$ Million) by Component, 2023 to 2033

Figure 2: Global Market Value (US$ Million) by Organization Size, 2023 to 2033

Figure 3: Global Market Value (US$ Million) by Application, 2023 to 2033

Figure 4: Global Market Value (US$ Million) by End User, 2023 to 2033

Figure 5: Global Market Value (US$ Million) by Region, 2023 to 2033

Figure 6: Global Market Value (US$ Million) Analysis by Region, 2018 to 2033

Figure 7: Global Market Value Share (%) and BPS Analysis by Region, 2023 to 2033

Figure 8: Global Market Y-o-Y Growth (%) Projections by Region, 2023 to 2033

Figure 9: Global Market Value (US$ Million) Analysis by Component, 2018 to 2033

Figure 10: Global Market Value Share (%) and BPS Analysis by Component, 2023 to 2033

Figure 11: Global Market Y-o-Y Growth (%) Projections by Component, 2023 to 2033

Figure 12: Global Market Value (US$ Million) Analysis by Organization Size, 2018 to 2033

Figure 13: Global Market Value Share (%) and BPS Analysis by Organization Size, 2023 to 2033

Figure 14: Global Market Y-o-Y Growth (%) Projections by Organization Size, 2023 to 2033

Figure 15: Global Market Value (US$ Million) Analysis by Application, 2018 to 2033

Figure 16: Global Market Value Share (%) and BPS Analysis by Application, 2023 to 2033

Figure 17: Global Market Y-o-Y Growth (%) Projections by Application, 2023 to 2033

Figure 18: Global Market Value (US$ Million) Analysis by End User, 2018 to 2033

Figure 19: Global Market Value Share (%) and BPS Analysis by End User, 2023 to 2033

Figure 20: Global Market Y-o-Y Growth (%) Projections by End User, 2023 to 2033

Figure 21: Global Market Attractiveness by Component, 2023 to 2033

Figure 22: Global Market Attractiveness by Organization Size, 2023 to 2033

Figure 23: Global Market Attractiveness by Application, 2023 to 2033

Figure 24: Global Market Attractiveness by End User, 2023 to 2033

Figure 25: Global Market Attractiveness by Region, 2023 to 2033

Figure 26: North America Market Value (US$ Million) by Component, 2023 to 2033

Figure 27: North America Market Value (US$ Million) by Organization Size, 2023 to 2033

Figure 28: North America Market Value (US$ Million) by Application, 2023 to 2033

Figure 29: North America Market Value (US$ Million) by End User, 2023 to 2033

Figure 30: North America Market Value (US$ Million) by Country, 2023 to 2033

Figure 31: North America Market Value (US$ Million) Analysis by Country, 2018 to 2033

Figure 32: North America Market Value Share (%) and BPS Analysis by Country, 2023 to 2033

Figure 33: North America Market Y-o-Y Growth (%) Projections by Country, 2023 to 2033

Figure 34: North America Market Value (US$ Million) Analysis by Component, 2018 to 2033

Figure 35: North America Market Value Share (%) and BPS Analysis by Component, 2023 to 2033

Figure 36: North America Market Y-o-Y Growth (%) Projections by Component, 2023 to 2033

Figure 37: North America Market Value (US$ Million) Analysis by Organization Size, 2018 to 2033

Figure 38: North America Market Value Share (%) and BPS Analysis by Organization Size, 2023 to 2033

Figure 39: North America Market Y-o-Y Growth (%) Projections by Organization Size, 2023 to 2033

Figure 40: North America Market Value (US$ Million) Analysis by Application, 2018 to 2033

Figure 41: North America Market Value Share (%) and BPS Analysis by Application, 2023 to 2033

Figure 42: North America Market Y-o-Y Growth (%) Projections by Application, 2023 to 2033

Figure 43: North America Market Value (US$ Million) Analysis by End User, 2018 to 2033

Figure 44: North America Market Value Share (%) and BPS Analysis by End User, 2023 to 2033

Figure 45: North America Market Y-o-Y Growth (%) Projections by End User, 2023 to 2033

Figure 46: North America Market Attractiveness by Component, 2023 to 2033

Figure 47: North America Market Attractiveness by Organization Size, 2023 to 2033

Figure 48: North America Market Attractiveness by Application, 2023 to 2033

Figure 49: North America Market Attractiveness by End User, 2023 to 2033

Figure 50: North America Market Attractiveness by Country, 2023 to 2033

Figure 51: Latin America Market Value (US$ Million) by Component, 2023 to 2033

Figure 52: Latin America Market Value (US$ Million) by Organization Size, 2023 to 2033

Figure 53: Latin America Market Value (US$ Million) by Application, 2023 to 2033

Figure 54: Latin America Market Value (US$ Million) by End User, 2023 to 2033

Figure 55: Latin America Market Value (US$ Million) by Country, 2023 to 2033

Figure 56: Latin America Market Value (US$ Million) Analysis by Country, 2018 to 2033

Figure 57: Latin America Market Value Share (%) and BPS Analysis by Country, 2023 to 2033

Figure 58: Latin America Market Y-o-Y Growth (%) Projections by Country, 2023 to 2033

Figure 59: Latin America Market Value (US$ Million) Analysis by Component, 2018 to 2033

Figure 60: Latin America Market Value Share (%) and BPS Analysis by Component, 2023 to 2033

Figure 61: Latin America Market Y-o-Y Growth (%) Projections by Component, 2023 to 2033

Figure 62: Latin America Market Value (US$ Million) Analysis by Organization Size, 2018 to 2033

Figure 63: Latin America Market Value Share (%) and BPS Analysis by Organization Size, 2023 to 2033

Figure 64: Latin America Market Y-o-Y Growth (%) Projections by Organization Size, 2023 to 2033

Figure 65: Latin America Market Value (US$ Million) Analysis by Application, 2018 to 2033

Figure 66: Latin America Market Value Share (%) and BPS Analysis by Application, 2023 to 2033

Figure 67: Latin America Market Y-o-Y Growth (%) Projections by Application, 2023 to 2033

Figure 68: Latin America Market Value (US$ Million) Analysis by End User, 2018 to 2033

Figure 69: Latin America Market Value Share (%) and BPS Analysis by End User, 2023 to 2033

Figure 70: Latin America Market Y-o-Y Growth (%) Projections by End User, 2023 to 2033

Figure 71: Latin America Market Attractiveness by Component, 2023 to 2033

Figure 72: Latin America Market Attractiveness by Organization Size, 2023 to 2033

Figure 73: Latin America Market Attractiveness by Application, 2023 to 2033

Figure 74: Latin America Market Attractiveness by End User, 2023 to 2033

Figure 75: Latin America Market Attractiveness by Country, 2023 to 2033

Figure 76: Europe Market Value (US$ Million) by Component, 2023 to 2033

Figure 77: Europe Market Value (US$ Million) by Organization Size, 2023 to 2033

Figure 78: Europe Market Value (US$ Million) by Application, 2023 to 2033

Figure 79: Europe Market Value (US$ Million) by End User, 2023 to 2033

Figure 80: Europe Market Value (US$ Million) by Country, 2023 to 2033

Figure 81: Europe Market Value (US$ Million) Analysis by Country, 2018 to 2033

Figure 82: Europe Market Value Share (%) and BPS Analysis by Country, 2023 to 2033

Figure 83: Europe Market Y-o-Y Growth (%) Projections by Country, 2023 to 2033

Figure 84: Europe Market Value (US$ Million) Analysis by Component, 2018 to 2033

Figure 85: Europe Market Value Share (%) and BPS Analysis by Component, 2023 to 2033

Figure 86: Europe Market Y-o-Y Growth (%) Projections by Component, 2023 to 2033

Figure 87: Europe Market Value (US$ Million) Analysis by Organization Size, 2018 to 2033

Figure 88: Europe Market Value Share (%) and BPS Analysis by Organization Size, 2023 to 2033

Figure 89: Europe Market Y-o-Y Growth (%) Projections by Organization Size, 2023 to 2033

Figure 90: Europe Market Value (US$ Million) Analysis by Application, 2018 to 2033

Figure 91: Europe Market Value Share (%) and BPS Analysis by Application, 2023 to 2033

Figure 92: Europe Market Y-o-Y Growth (%) Projections by Application, 2023 to 2033

Figure 93: Europe Market Value (US$ Million) Analysis by End User, 2018 to 2033

Figure 94: Europe Market Value Share (%) and BPS Analysis by End User, 2023 to 2033

Figure 95: Europe Market Y-o-Y Growth (%) Projections by End User, 2023 to 2033

Figure 96: Europe Market Attractiveness by Component, 2023 to 2033

Figure 97: Europe Market Attractiveness by Organization Size, 2023 to 2033

Figure 98: Europe Market Attractiveness by Application, 2023 to 2033

Figure 99: Europe Market Attractiveness by End User, 2023 to 2033

Figure 100: Europe Market Attractiveness by Country, 2023 to 2033

Figure 101: South Asia Market Value (US$ Million) by Component, 2023 to 2033

Figure 102: South Asia Market Value (US$ Million) by Organization Size, 2023 to 2033

Figure 103: South Asia Market Value (US$ Million) by Application, 2023 to 2033

Figure 104: South Asia Market Value (US$ Million) by End User, 2023 to 2033

Figure 105: South Asia Market Value (US$ Million) by Country, 2023 to 2033

Figure 106: South Asia Market Value (US$ Million) Analysis by Country, 2018 to 2033

Figure 107: South Asia Market Value Share (%) and BPS Analysis by Country, 2023 to 2033

Figure 108: South Asia Market Y-o-Y Growth (%) Projections by Country, 2023 to 2033

Figure 109: South Asia Market Value (US$ Million) Analysis by Component, 2018 to 2033

Figure 110: South Asia Market Value Share (%) and BPS Analysis by Component, 2023 to 2033

Figure 111: South Asia Market Y-o-Y Growth (%) Projections by Component, 2023 to 2033

Figure 112: South Asia Market Value (US$ Million) Analysis by Organization Size, 2018 to 2033

Figure 113: South Asia Market Value Share (%) and BPS Analysis by Organization Size, 2023 to 2033

Figure 114: South Asia Market Y-o-Y Growth (%) Projections by Organization Size, 2023 to 2033

Figure 115: South Asia Market Value (US$ Million) Analysis by Application, 2018 to 2033

Figure 116: South Asia Market Value Share (%) and BPS Analysis by Application, 2023 to 2033

Figure 117: South Asia Market Y-o-Y Growth (%) Projections by Application, 2023 to 2033

Figure 118: South Asia Market Value (US$ Million) Analysis by End User, 2018 to 2033

Figure 119: South Asia Market Value Share (%) and BPS Analysis by End User, 2023 to 2033

Figure 120: South Asia Market Y-o-Y Growth (%) Projections by End User, 2023 to 2033

Figure 121: South Asia Market Attractiveness by Component, 2023 to 2033

Figure 122: South Asia Market Attractiveness by Organization Size, 2023 to 2033

Figure 123: South Asia Market Attractiveness by Application, 2023 to 2033

Figure 124: South Asia Market Attractiveness by End User, 2023 to 2033

Figure 125: South Asia Market Attractiveness by Country, 2023 to 2033

Figure 126: East Asia Market Value (US$ Million) by Component, 2023 to 2033

Figure 127: East Asia Market Value (US$ Million) by Organization Size, 2023 to 2033

Figure 128: East Asia Market Value (US$ Million) by Application, 2023 to 2033

Figure 129: East Asia Market Value (US$ Million) by End User, 2023 to 2033

Figure 130: East Asia Market Value (US$ Million) by Country, 2023 to 2033

Figure 131: East Asia Market Value (US$ Million) Analysis by Country, 2018 to 2033

Figure 132: East Asia Market Value Share (%) and BPS Analysis by Country, 2023 to 2033

Figure 133: East Asia Market Y-o-Y Growth (%) Projections by Country, 2023 to 2033

Figure 134: East Asia Market Value (US$ Million) Analysis by Component, 2018 to 2033

Figure 135: East Asia Market Value Share (%) and BPS Analysis by Component, 2023 to 2033

Figure 136: East Asia Market Y-o-Y Growth (%) Projections by Component, 2023 to 2033

Figure 137: East Asia Market Value (US$ Million) Analysis by Organization Size, 2018 to 2033

Figure 138: East Asia Market Value Share (%) and BPS Analysis by Organization Size, 2023 to 2033

Figure 139: East Asia Market Y-o-Y Growth (%) Projections by Organization Size, 2023 to 2033

Figure 140: East Asia Market Value (US$ Million) Analysis by Application, 2018 to 2033

Figure 141: East Asia Market Value Share (%) and BPS Analysis by Application, 2023 to 2033

Figure 142: East Asia Market Y-o-Y Growth (%) Projections by Application, 2023 to 2033

Figure 143: East Asia Market Value (US$ Million) Analysis by End User, 2018 to 2033

Figure 144: East Asia Market Value Share (%) and BPS Analysis by End User, 2023 to 2033

Figure 145: East Asia Market Y-o-Y Growth (%) Projections by End User, 2023 to 2033

Figure 146: East Asia Market Attractiveness by Component, 2023 to 2033

Figure 147: East Asia Market Attractiveness by Organization Size, 2023 to 2033

Figure 148: East Asia Market Attractiveness by Application, 2023 to 2033

Figure 149: East Asia Market Attractiveness by End User, 2023 to 2033

Figure 150: East Asia Market Attractiveness by Country, 2023 to 2033

Figure 151: Oceania Market Value (US$ Million) by Component, 2023 to 2033

Figure 152: Oceania Market Value (US$ Million) by Organization Size, 2023 to 2033

Figure 153: Oceania Market Value (US$ Million) by Application, 2023 to 2033

Figure 154: Oceania Market Value (US$ Million) by End User, 2023 to 2033

Figure 155: Oceania Market Value (US$ Million) by Country, 2023 to 2033

Figure 156: Oceania Market Value (US$ Million) Analysis by Country, 2018 to 2033

Figure 157: Oceania Market Value Share (%) and BPS Analysis by Country, 2023 to 2033

Figure 158: Oceania Market Y-o-Y Growth (%) Projections by Country, 2023 to 2033

Figure 159: Oceania Market Value (US$ Million) Analysis by Component, 2018 to 2033

Figure 160: Oceania Market Value Share (%) and BPS Analysis by Component, 2023 to 2033

Figure 161: Oceania Market Y-o-Y Growth (%) Projections by Component, 2023 to 2033

Figure 162: Oceania Market Value (US$ Million) Analysis by Organization Size, 2018 to 2033

Figure 163: Oceania Market Value Share (%) and BPS Analysis by Organization Size, 2023 to 2033

Figure 164: Oceania Market Y-o-Y Growth (%) Projections by Organization Size, 2023 to 2033

Figure 165: Oceania Market Value (US$ Million) Analysis by Application, 2018 to 2033

Figure 166: Oceania Market Value Share (%) and BPS Analysis by Application, 2023 to 2033

Figure 167: Oceania Market Y-o-Y Growth (%) Projections by Application, 2023 to 2033

Figure 168: Oceania Market Value (US$ Million) Analysis by End User, 2018 to 2033

Figure 169: Oceania Market Value Share (%) and BPS Analysis by End User, 2023 to 2033

Figure 170: Oceania Market Y-o-Y Growth (%) Projections by End User, 2023 to 2033

Figure 171: Oceania Market Attractiveness by Component, 2023 to 2033

Figure 172: Oceania Market Attractiveness by Organization Size, 2023 to 2033

Figure 173: Oceania Market Attractiveness by Application, 2023 to 2033

Figure 174: Oceania Market Attractiveness by End User, 2023 to 2033

Figure 175: Oceania Market Attractiveness by Country, 2023 to 2033

Figure 176: MEA Market Value (US$ Million) by Component, 2023 to 2033

Figure 177: MEA Market Value (US$ Million) by Organization Size, 2023 to 2033

Figure 178: MEA Market Value (US$ Million) by Application, 2023 to 2033

Figure 179: MEA Market Value (US$ Million) by End User, 2023 to 2033

Figure 180: MEA Market Value (US$ Million) by Country, 2023 to 2033

Figure 181: MEA Market Value (US$ Million) Analysis by Country, 2018 to 2033

Figure 182: MEA Market Value Share (%) and BPS Analysis by Country, 2023 to 2033

Figure 183: MEA Market Y-o-Y Growth (%) Projections by Country, 2023 to 2033

Figure 184: MEA Market Value (US$ Million) Analysis by Component, 2018 to 2033

Figure 185: MEA Market Value Share (%) and BPS Analysis by Component, 2023 to 2033

Figure 186: MEA Market Y-o-Y Growth (%) Projections by Component, 2023 to 2033

Figure 187: MEA Market Value (US$ Million) Analysis by Organization Size, 2018 to 2033

Figure 188: MEA Market Value Share (%) and BPS Analysis by Organization Size, 2023 to 2033

Figure 189: MEA Market Y-o-Y Growth (%) Projections by Organization Size, 2023 to 2033

Figure 190: MEA Market Value (US$ Million) Analysis by Application, 2018 to 2033

Figure 191: MEA Market Value Share (%) and BPS Analysis by Application, 2023 to 2033

Figure 192: MEA Market Y-o-Y Growth (%) Projections by Application, 2023 to 2033

Figure 193: MEA Market Value (US$ Million) Analysis by End User, 2018 to 2033

Figure 194: MEA Market Value Share (%) and BPS Analysis by End User, 2023 to 2033

Figure 195: MEA Market Y-o-Y Growth (%) Projections by End User, 2023 to 2033

Figure 196: MEA Market Attractiveness by Component, 2023 to 2033

Figure 197: MEA Market Attractiveness by Organization Size, 2023 to 2033

Figure 198: MEA Market Attractiveness by Application, 2023 to 2033

Figure 199: MEA Market Attractiveness by End User, 2023 to 2033

Figure 200: MEA Market Attractiveness by Country, 2023 to 2033

Frequently Asked Questions

What is the Key Trend of the Market?

Technological innovations in 5G industrial IoT technologies boost the market.

What is the Current Market Valuation?

The market is estimated to secure a valuation of USD 1,421.8 million in 2023.

What is the Growth Forecast for the market?

The market is forecast to register a CAGR of 28.2% through 2033.

What is the Prominent Driver of the Industry?

Expansion of the gaming industry is the prominent driver.

What is the Historical Performance of the Market?

The market valuation held a CAGR of 26.1% from 2018 to 2022.

Explore Similar Insights

Future Market Insights

5G Industrial IOT Market