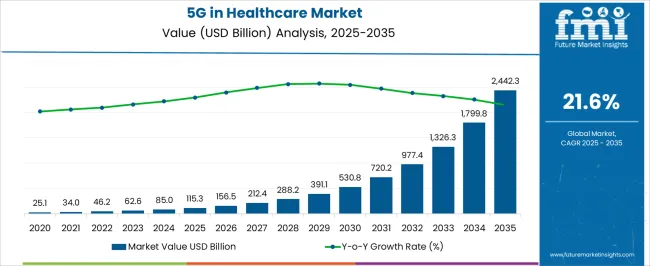
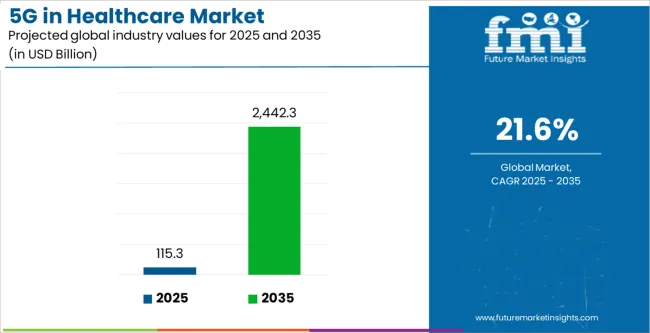
The 5G in healthcare market is anticipated to be worth USD 85 billion in 2024. In 2023, the value of the market was USD 62.2 billion. The market is expected to grow at an astonishing CAGR of 35.7% from 2024 to 2034. By the end of the forecast period, the market value is predicted to be USD 1,800 billion.
5G in Healthcare Market Analysis
Attributes | Details |
---|---|
5G in Healthcare Market Value for 2024 | USD 85 billion |
Projected Market Value for 2034 | USD 1,800 billion |
Value-based CAGR of Market for 2024 to 2034 | 35.7% |
The 5G in healthcare market was valued at USD 17.0 billion in value in 2019. The market progressed at a remarkable CAGR of 38.3% over the historical period from 2019 to 2023.
The pandemic necessitated the use of superior communication technologies like 5G as medical professionals scrambled to administer the proper treatment to patients. 5G was also utilized to aid in medicines and vaccines reaching remote areas of the world. In 2023, the market was pegged to be USD 62.2 billion.
Attribute | Details |
---|---|
Market Value (2019) | USD 17.0 billion |
Historical CAGR (2019 to 2023) | 38.3% |
Historical Market Valuation (2023) | USD 62.2 billion |
Long-Term Analysis of the 5G in Healthcare Market
The 5G in healthcare market is estimated to have a size of USD 85 billion in 2024. The progress of the market is pegged to be extraordinary over the period from 2024 to 2034, with a CAGR of 35.7%.
Though the rate of progress for the market is anticipated to be slightly lower in the forecast period than in the historical period, the market is still ripe with opportunities. The rise in remote healthcare monitoring and the need for better communication between patients and doctors, as well as among the medical professionals themselves, is driving the market. By 2034, the market size is anticipated to have jumped to USD 1,800 billion.
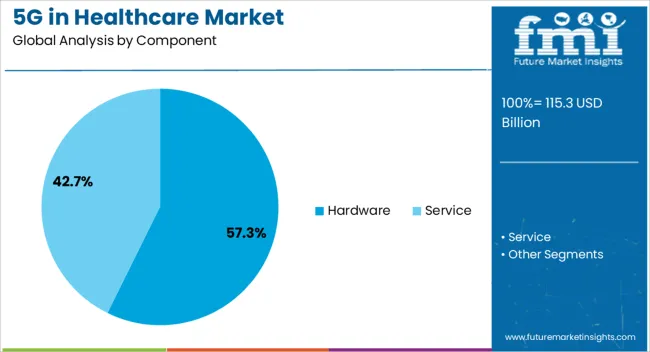
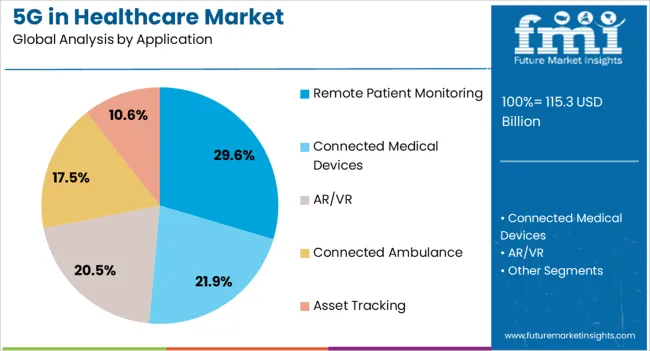
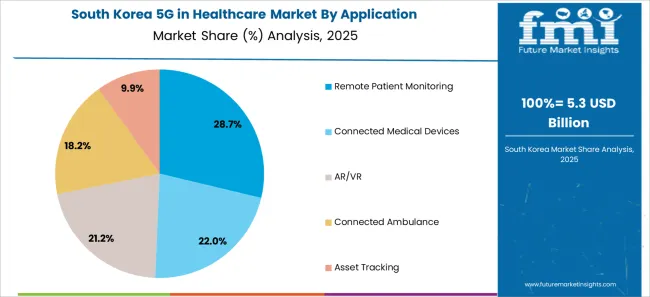
5G in healthcare comes in the form of both hardware and services, with hardware being the dominant component. Of the various uses for 5G in healthcare, remote patient monitoring is the most common application.
Hardware is expected to progress at a CAGR of 35.6% through 2034. Some of the key drivers include:
Attributes | Details |
---|---|
Top Component | Hardware |
CAGR (2024 to 2034) | 35.6% |
Remote patient monitoring is anticipated to progress at a CAGR of 35.5% over the forecast period. Some of the key drivers for its progress include:
Attributes | Details |
---|---|
Top Application | Remote Monitoring Devices |
CAGR (2024 to 2034) | 35.5% |
The adoption of 5G in healthcare is increasing all over the world, with the Asia Pacific marked for special growth. Increasing healthcare needs, coupled with the technological advancement of the region, make Asia Pacific a lucrative regional market.
North America and Europe’s affluence means an increasing number of people have access to 5G technology. The use of 5G is seeping into the healthcare sector of the region.
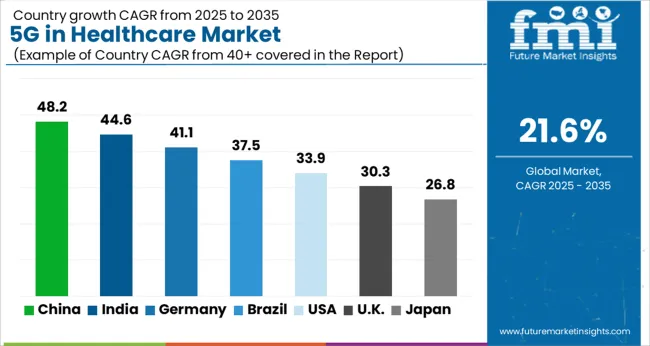
Countries | CAGR through 2034 |
---|---|
United Kingdom | 36.3% |
Japan | 37.1% |
China | 36.1% |
South Korea | 38.3% |
United States | 36.0% |
The market is set to register a CAGR of 38.3% in South Korea over the forecast period. The key drivers for the magnificent growth are:
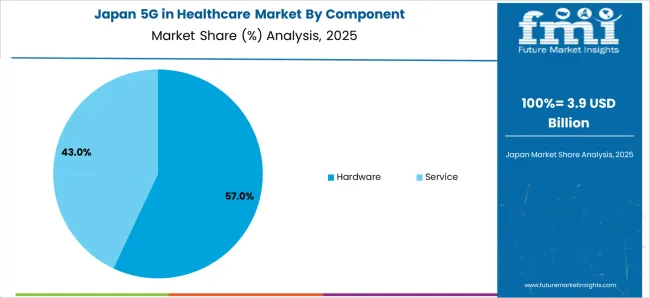
The CAGR for the 5G in healthcare market in Japan is tipped to be 37.1% through 2034. Some of the key factors driving market growth are:
The market is expected to register a CAGR of 36.1% in China. Some of the key trends include:
The market in the United Kingdom is expected to progress at a CAGR of 36.3% until 2034. Key factors driving the growth are:
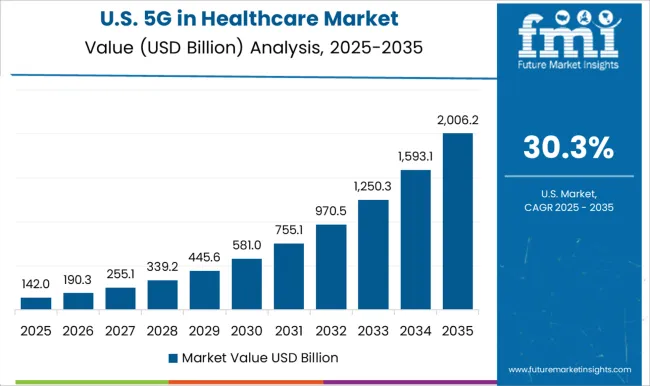
The market in the United States is anticipated to register a CAGR of 36.0% over the forecast period. Some prominent factors driving growth are:
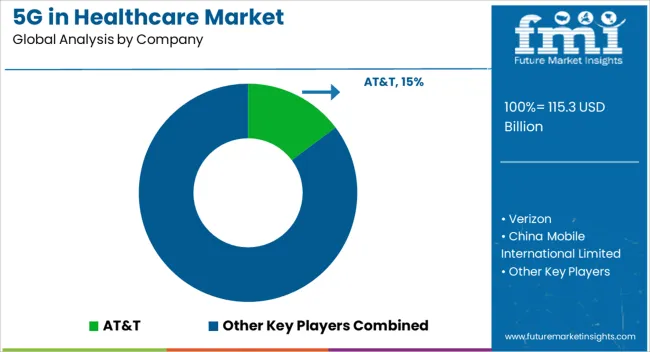
Providers of 5G for healthcare services are using the medium of partnership to strengthen ties with medical technology providers. Collaborations are also being done with healthcare institutions and research facilities. Acquisitions and mergers are common in the market. By means of acquisitions and mergers, general 5G providers are entering the healthcare sector.
Recent Developments in the 5G in Healthcare Market
Table 1: Global Market Value (US$ Million) Forecast by Region, 2019 to 2034
Table 2: Global Market Value (US$ Million) Forecast by Component, 2019 to 2034
Table 3: Global Market Value (US$ Million) Forecast by Application, 2019 to 2034
Table 4: Global Market Value (US$ Million) Forecast by End-use, 2019 to 2034
Table 5: North America Market Value (US$ Million) Forecast by Country, 2019 to 2034
Table 6: North America Market Value (US$ Million) Forecast by Component, 2019 to 2034
Table 7: North America Market Value (US$ Million) Forecast by Application, 2019 to 2034
Table 8: North America Market Value (US$ Million) Forecast by End-use, 2019 to 2034
Table 9: Latin America Market Value (US$ Million) Forecast by Country, 2019 to 2034
Table 10: Latin America Market Value (US$ Million) Forecast by Component, 2019 to 2034
Table 11: Latin America Market Value (US$ Million) Forecast by Application, 2019 to 2034
Table 12: Latin America Market Value (US$ Million) Forecast by End-use, 2019 to 2034
Table 13: Western Europe Market Value (US$ Million) Forecast by Country, 2019 to 2034
Table 14: Western Europe Market Value (US$ Million) Forecast by Component, 2019 to 2034
Table 15: Western Europe Market Value (US$ Million) Forecast by Application, 2019 to 2034
Table 16: Western Europe Market Value (US$ Million) Forecast by End-use, 2019 to 2034
Table 17: Eastern Europe Market Value (US$ Million) Forecast by Country, 2019 to 2034
Table 18: Eastern Europe Market Value (US$ Million) Forecast by Component, 2019 to 2034
Table 19: Eastern Europe Market Value (US$ Million) Forecast by Application, 2019 to 2034
Table 20: Eastern Europe Market Value (US$ Million) Forecast by End-use, 2019 to 2034
Table 21: South Asia and Pacific Market Value (US$ Million) Forecast by Country, 2019 to 2034
Table 22: South Asia and Pacific Market Value (US$ Million) Forecast by Component, 2019 to 2034
Table 23: South Asia and Pacific Market Value (US$ Million) Forecast by Application, 2019 to 2034
Table 24: South Asia and Pacific Market Value (US$ Million) Forecast by End-use, 2019 to 2034
Table 25: East Asia Market Value (US$ Million) Forecast by Country, 2019 to 2034
Table 26: East Asia Market Value (US$ Million) Forecast by Component, 2019 to 2034
Table 27: East Asia Market Value (US$ Million) Forecast by Application, 2019 to 2034
Table 28: East Asia Market Value (US$ Million) Forecast by End-use, 2019 to 2034
Table 29: Middle East and Africa Market Value (US$ Million) Forecast by Country, 2019 to 2034
Table 30: Middle East and Africa Market Value (US$ Million) Forecast by Component, 2019 to 2034
Table 31: Middle East and Africa Market Value (US$ Million) Forecast by Application, 2019 to 2034
Table 32: Middle East and Africa Market Value (US$ Million) Forecast by End-use, 2019 to 2034
Figure 1: Global Market Value (US$ Million) by Component, 2024 to 2034
Figure 2: Global Market Value (US$ Million) by Application, 2024 to 2034
Figure 3: Global Market Value (US$ Million) by End-use , 2024 to 2034
Figure 4: Global Market Value (US$ Million) by Region, 2024 to 2034
Figure 5: Global Market Value (US$ Million) Analysis by Region, 2019 to 2034
Figure 6: Global Market Value Share (%) and BPS Analysis by Region, 2024 to 2034
Figure 7: Global Market Y-o-Y Growth (%) Projections by Region, 2024 to 2034
Figure 8: Global Market Value (US$ Million) Analysis by Component, 2019 to 2034
Figure 9: Global Market Value Share (%) and BPS Analysis by Component, 2024 to 2034
Figure 10: Global Market Y-o-Y Growth (%) Projections by Component, 2024 to 2034
Figure 11: Global Market Value (US$ Million) Analysis by Application, 2019 to 2034
Figure 12: Global Market Value Share (%) and BPS Analysis by Application, 2024 to 2034
Figure 13: Global Market Y-o-Y Growth (%) Projections by Application, 2024 to 2034
Figure 14: Global Market Value (US$ Million) Analysis by End-use , 2019 to 2034
Figure 15: Global Market Value Share (%) and BPS Analysis by End-use , 2024 to 2034
Figure 16: Global Market Y-o-Y Growth (%) Projections by End-use , 2024 to 2034
Figure 17: Global Market Attractiveness by Component, 2024 to 2034
Figure 18: Global Market Attractiveness by Application, 2024 to 2034
Figure 19: Global Market Attractiveness by End-use , 2024 to 2034
Figure 20: Global Market Attractiveness by Region, 2024 to 2034
Figure 21: North America Market Value (US$ Million) by Component, 2024 to 2034
Figure 22: North America Market Value (US$ Million) by Application, 2024 to 2034
Figure 23: North America Market Value (US$ Million) by End-use , 2024 to 2034
Figure 24: North America Market Value (US$ Million) by Country, 2024 to 2034
Figure 25: North America Market Value (US$ Million) Analysis by Country, 2019 to 2034
Figure 26: North America Market Value Share (%) and BPS Analysis by Country, 2024 to 2034
Figure 27: North America Market Y-o-Y Growth (%) Projections by Country, 2024 to 2034
Figure 28: North America Market Value (US$ Million) Analysis by Component, 2019 to 2034
Figure 29: North America Market Value Share (%) and BPS Analysis by Component, 2024 to 2034
Figure 30: North America Market Y-o-Y Growth (%) Projections by Component, 2024 to 2034
Figure 31: North America Market Value (US$ Million) Analysis by Application, 2019 to 2034
Figure 32: North America Market Value Share (%) and BPS Analysis by Application, 2024 to 2034
Figure 33: North America Market Y-o-Y Growth (%) Projections by Application, 2024 to 2034
Figure 34: North America Market Value (US$ Million) Analysis by End-use , 2019 to 2034
Figure 35: North America Market Value Share (%) and BPS Analysis by End-use , 2024 to 2034
Figure 36: North America Market Y-o-Y Growth (%) Projections by End-use , 2024 to 2034
Figure 37: North America Market Attractiveness by Component, 2024 to 2034
Figure 38: North America Market Attractiveness by Application, 2024 to 2034
Figure 39: North America Market Attractiveness by End-use , 2024 to 2034
Figure 40: North America Market Attractiveness by Country, 2024 to 2034
Figure 41: Latin America Market Value (US$ Million) by Component, 2024 to 2034
Figure 42: Latin America Market Value (US$ Million) by Application, 2024 to 2034
Figure 43: Latin America Market Value (US$ Million) by End-use , 2024 to 2034
Figure 44: Latin America Market Value (US$ Million) by Country, 2024 to 2034
Figure 45: Latin America Market Value (US$ Million) Analysis by Country, 2019 to 2034
Figure 46: Latin America Market Value Share (%) and BPS Analysis by Country, 2024 to 2034
Figure 47: Latin America Market Y-o-Y Growth (%) Projections by Country, 2024 to 2034
Figure 48: Latin America Market Value (US$ Million) Analysis by Component, 2019 to 2034
Figure 49: Latin America Market Value Share (%) and BPS Analysis by Component, 2024 to 2034
Figure 50: Latin America Market Y-o-Y Growth (%) Projections by Component, 2024 to 2034
Figure 51: Latin America Market Value (US$ Million) Analysis by Application, 2019 to 2034
Figure 52: Latin America Market Value Share (%) and BPS Analysis by Application, 2024 to 2034
Figure 53: Latin America Market Y-o-Y Growth (%) Projections by Application, 2024 to 2034
Figure 54: Latin America Market Value (US$ Million) Analysis by End-use , 2019 to 2034
Figure 55: Latin America Market Value Share (%) and BPS Analysis by End-use , 2024 to 2034
Figure 56: Latin America Market Y-o-Y Growth (%) Projections by End-use , 2024 to 2034
Figure 57: Latin America Market Attractiveness by Component, 2024 to 2034
Figure 58: Latin America Market Attractiveness by Application, 2024 to 2034
Figure 59: Latin America Market Attractiveness by End-use , 2024 to 2034
Figure 60: Latin America Market Attractiveness by Country, 2024 to 2034
Figure 61: Western Europe Market Value (US$ Million) by Component, 2024 to 2034
Figure 62: Western Europe Market Value (US$ Million) by Application, 2024 to 2034
Figure 63: Western Europe Market Value (US$ Million) by End-use , 2024 to 2034
Figure 64: Western Europe Market Value (US$ Million) by Country, 2024 to 2034
Figure 65: Western Europe Market Value (US$ Million) Analysis by Country, 2019 to 2034
Figure 66: Western Europe Market Value Share (%) and BPS Analysis by Country, 2024 to 2034
Figure 67: Western Europe Market Y-o-Y Growth (%) Projections by Country, 2024 to 2034
Figure 68: Western Europe Market Value (US$ Million) Analysis by Component, 2019 to 2034
Figure 69: Western Europe Market Value Share (%) and BPS Analysis by Component, 2024 to 2034
Figure 70: Western Europe Market Y-o-Y Growth (%) Projections by Component, 2024 to 2034
Figure 71: Western Europe Market Value (US$ Million) Analysis by Application, 2019 to 2034
Figure 72: Western Europe Market Value Share (%) and BPS Analysis by Application, 2024 to 2034
Figure 73: Western Europe Market Y-o-Y Growth (%) Projections by Application, 2024 to 2034
Figure 74: Western Europe Market Value (US$ Million) Analysis by End-use , 2019 to 2034
Figure 75: Western Europe Market Value Share (%) and BPS Analysis by End-use , 2024 to 2034
Figure 76: Western Europe Market Y-o-Y Growth (%) Projections by End-use , 2024 to 2034
Figure 77: Western Europe Market Attractiveness by Component, 2024 to 2034
Figure 78: Western Europe Market Attractiveness by Application, 2024 to 2034
Figure 79: Western Europe Market Attractiveness by End-use , 2024 to 2034
Figure 80: Western Europe Market Attractiveness by Country, 2024 to 2034
Figure 81: Eastern Europe Market Value (US$ Million) by Component, 2024 to 2034
Figure 82: Eastern Europe Market Value (US$ Million) by Application, 2024 to 2034
Figure 83: Eastern Europe Market Value (US$ Million) by End-use , 2024 to 2034
Figure 84: Eastern Europe Market Value (US$ Million) by Country, 2024 to 2034
Figure 85: Eastern Europe Market Value (US$ Million) Analysis by Country, 2019 to 2034
Figure 86: Eastern Europe Market Value Share (%) and BPS Analysis by Country, 2024 to 2034
Figure 87: Eastern Europe Market Y-o-Y Growth (%) Projections by Country, 2024 to 2034
Figure 88: Eastern Europe Market Value (US$ Million) Analysis by Component, 2019 to 2034
Figure 89: Eastern Europe Market Value Share (%) and BPS Analysis by Component, 2024 to 2034
Figure 90: Eastern Europe Market Y-o-Y Growth (%) Projections by Component, 2024 to 2034
Figure 91: Eastern Europe Market Value (US$ Million) Analysis by Application, 2019 to 2034
Figure 92: Eastern Europe Market Value Share (%) and BPS Analysis by Application, 2024 to 2034
Figure 93: Eastern Europe Market Y-o-Y Growth (%) Projections by Application, 2024 to 2034
Figure 94: Eastern Europe Market Value (US$ Million) Analysis by End-use , 2019 to 2034
Figure 95: Eastern Europe Market Value Share (%) and BPS Analysis by End-use , 2024 to 2034
Figure 96: Eastern Europe Market Y-o-Y Growth (%) Projections by End-use , 2024 to 2034
Figure 97: Eastern Europe Market Attractiveness by Component, 2024 to 2034
Figure 98: Eastern Europe Market Attractiveness by Application, 2024 to 2034
Figure 99: Eastern Europe Market Attractiveness by End-use , 2024 to 2034
Figure 100: Eastern Europe Market Attractiveness by Country, 2024 to 2034
Figure 101: South Asia and Pacific Market Value (US$ Million) by Component, 2024 to 2034
Figure 102: South Asia and Pacific Market Value (US$ Million) by Application, 2024 to 2034
Figure 103: South Asia and Pacific Market Value (US$ Million) by End-use , 2024 to 2034
Figure 104: South Asia and Pacific Market Value (US$ Million) by Country, 2024 to 2034
Figure 105: South Asia and Pacific Market Value (US$ Million) Analysis by Country, 2019 to 2034
Figure 106: South Asia and Pacific Market Value Share (%) and BPS Analysis by Country, 2024 to 2034
Figure 107: South Asia and Pacific Market Y-o-Y Growth (%) Projections by Country, 2024 to 2034
Figure 108: South Asia and Pacific Market Value (US$ Million) Analysis by Component, 2019 to 2034
Figure 109: South Asia and Pacific Market Value Share (%) and BPS Analysis by Component, 2024 to 2034
Figure 110: South Asia and Pacific Market Y-o-Y Growth (%) Projections by Component, 2024 to 2034
Figure 111: South Asia and Pacific Market Value (US$ Million) Analysis by Application, 2019 to 2034
Figure 112: South Asia and Pacific Market Value Share (%) and BPS Analysis by Application, 2024 to 2034
Figure 113: South Asia and Pacific Market Y-o-Y Growth (%) Projections by Application, 2024 to 2034
Figure 114: South Asia and Pacific Market Value (US$ Million) Analysis by End-use , 2019 to 2034
Figure 115: South Asia and Pacific Market Value Share (%) and BPS Analysis by End-use , 2024 to 2034
Figure 116: South Asia and Pacific Market Y-o-Y Growth (%) Projections by End-use , 2024 to 2034
Figure 117: South Asia and Pacific Market Attractiveness by Component, 2024 to 2034
Figure 118: South Asia and Pacific Market Attractiveness by Application, 2024 to 2034
Figure 119: South Asia and Pacific Market Attractiveness by End-use , 2024 to 2034
Figure 120: South Asia and Pacific Market Attractiveness by Country, 2024 to 2034
Figure 121: East Asia Market Value (US$ Million) by Component, 2024 to 2034
Figure 122: East Asia Market Value (US$ Million) by Application, 2024 to 2034
Figure 123: East Asia Market Value (US$ Million) by End-use , 2024 to 2034
Figure 124: East Asia Market Value (US$ Million) by Country, 2024 to 2034
Figure 125: East Asia Market Value (US$ Million) Analysis by Country, 2019 to 2034
Figure 126: East Asia Market Value Share (%) and BPS Analysis by Country, 2024 to 2034
Figure 127: East Asia Market Y-o-Y Growth (%) Projections by Country, 2024 to 2034
Figure 128: East Asia Market Value (US$ Million) Analysis by Component, 2019 to 2034
Figure 129: East Asia Market Value Share (%) and BPS Analysis by Component, 2024 to 2034
Figure 130: East Asia Market Y-o-Y Growth (%) Projections by Component, 2024 to 2034
Figure 131: East Asia Market Value (US$ Million) Analysis by Application, 2019 to 2034
Figure 132: East Asia Market Value Share (%) and BPS Analysis by Application, 2024 to 2034
Figure 133: East Asia Market Y-o-Y Growth (%) Projections by Application, 2024 to 2034
Figure 134: East Asia Market Value (US$ Million) Analysis by End-use , 2019 to 2034
Figure 135: East Asia Market Value Share (%) and BPS Analysis by End-use , 2024 to 2034
Figure 136: East Asia Market Y-o-Y Growth (%) Projections by End-use , 2024 to 2034
Figure 137: East Asia Market Attractiveness by Component, 2024 to 2034
Figure 138: East Asia Market Attractiveness by Application, 2024 to 2034
Figure 139: East Asia Market Attractiveness by End-use , 2024 to 2034
Figure 140: East Asia Market Attractiveness by Country, 2024 to 2034
Figure 141: Middle East and Africa Market Value (US$ Million) by Component, 2024 to 2034
Figure 142: Middle East and Africa Market Value (US$ Million) by Application, 2024 to 2034
Figure 143: Middle East and Africa Market Value (US$ Million) by End-use , 2024 to 2034
Figure 144: Middle East and Africa Market Value (US$ Million) by Country, 2024 to 2034
Figure 145: Middle East and Africa Market Value (US$ Million) Analysis by Country, 2019 to 2034
Figure 146: Middle East and Africa Market Value Share (%) and BPS Analysis by Country, 2024 to 2034
Figure 147: Middle East and Africa Market Y-o-Y Growth (%) Projections by Country, 2024 to 2034
Figure 148: Middle East and Africa Market Value (US$ Million) Analysis by Component, 2019 to 2034
Figure 149: Middle East and Africa Market Value Share (%) and BPS Analysis by Component, 2024 to 2034
Figure 150: Middle East and Africa Market Y-o-Y Growth (%) Projections by Component, 2024 to 2034
Figure 151: Middle East and Africa Market Value (US$ Million) Analysis by Application, 2019 to 2034
Figure 152: Middle East and Africa Market Value Share (%) and BPS Analysis by Application, 2024 to 2034
Figure 153: Middle East and Africa Market Y-o-Y Growth (%) Projections by Application, 2024 to 2034
Figure 154: Middle East and Africa Market Value (US$ Million) Analysis by End-use , 2019 to 2034
Figure 155: Middle East and Africa Market Value Share (%) and BPS Analysis by End-use , 2024 to 2034
Figure 156: Middle East and Africa Market Y-o-Y Growth (%) Projections by End-use , 2024 to 2034
Figure 157: Middle East and Africa Market Attractiveness by Component, 2024 to 2034
Figure 158: Middle East and Africa Market Attractiveness by Application, 2024 to 2034
Figure 159: Middle East and Africa Market Attractiveness by End-use , 2024 to 2034
Figure 160: Middle East and Africa Market Attractiveness by Country, 2024 to 2034
The 5G in healthcare market size is expected to be worth USD 85 billion in 2024.
The 5G in healthcare market is estimated to get as big as USD 1,800 billion by 2034.
The CAGR for the United States market is projected to be 36.0% through 2034.
The popularity of robotic surgery and private consultations using 5G are two of the significant trends in the market.
The 5G in healthcare market is expected to grow at a CAGR of 35.7% over the projected period.
Explore Similar Insights
Thank you!
You will receive an email from our Business Development Manager. Please be sure to check your SPAM/JUNK folder too.