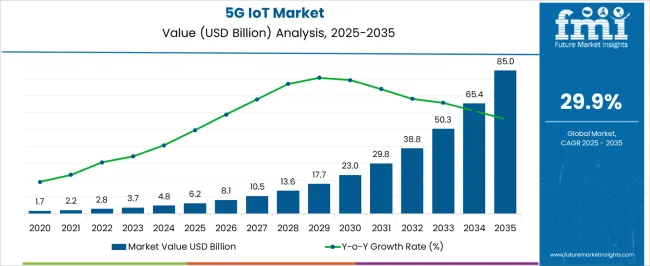
The 5G IoT Market is estimated to be valued at USD 6.2 billion in 2025 and is projected to reach USD 85.0 billion by 2035, registering a compound annual growth rate (CAGR) of 29.9% over the forecast period.
| Metric | Value |
|---|---|
| 5G IoT Market Estimated Value in (2025 E) | USD 6.2 billion |
| 5G IoT Market Forecast Value in (2035 F) | USD 85.0 billion |
| Forecast CAGR (2025 to 2035) | 29.9% |
The 5G IoT market is experiencing robust momentum driven by rapid advancements in ultra low latency connectivity, massive machine type communication, and rising adoption of smart industrial applications. The convergence of 5G with IoT ecosystems is enabling seamless real time data transmission, advanced automation, and predictive maintenance across sectors.
Governments and enterprises are investing heavily in infrastructure to support high density device connectivity, particularly in manufacturing, healthcare, and automotive industries. Ongoing standardization efforts and spectrum allocation policies are further accelerating adoption globally.
As enterprises move toward Industry 4.0 frameworks, the demand for integrated 5G IoT solutions continues to rise, ensuring improved operational efficiency, cost optimization, and enhanced customer experience. The market outlook remains highly favorable with strong growth potential across both developed and emerging economies.
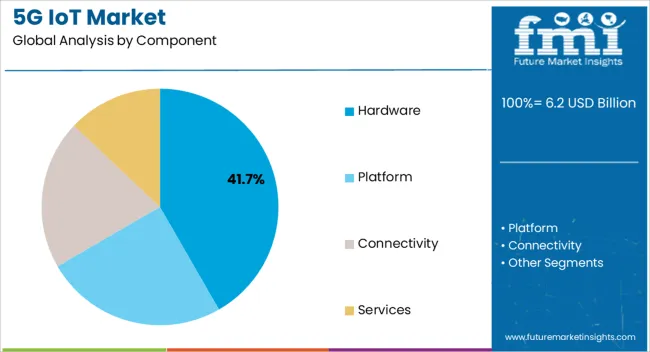
The hardware segment is projected to account for 41.70% of the overall market revenue by 2025 within the component category, making it the leading segment. This growth is attributed to the rising deployment of 5G enabled modules, sensors, and gateways that support seamless IoT connectivity.
Increasing investment in edge devices and base stations to ensure faster processing and reliable communication has strengthened the role of hardware. Additionally, the requirement for high performance chipsets and antennas tailored for IoT applications is contributing to segment expansion.
The ability of hardware to directly influence network reliability and system integration has reinforced its dominant position.
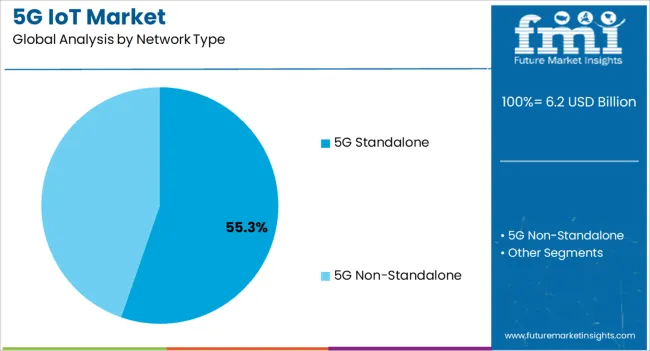
The 5G standalone network type is expected to contribute 55.30% of total revenue by 2025, establishing itself as the most prominent category within network types. Its dominance is supported by the capacity to deliver ultra low latency, improved bandwidth efficiency, and network slicing capabilities that are critical for diverse IoT applications.
Enterprises adopting standalone architecture benefit from a fully independent 5G core, which enhances security, scalability, and interoperability across multiple devices.
The flexibility offered in managing large scale industrial IoT deployments has further supported its widespread adoption.
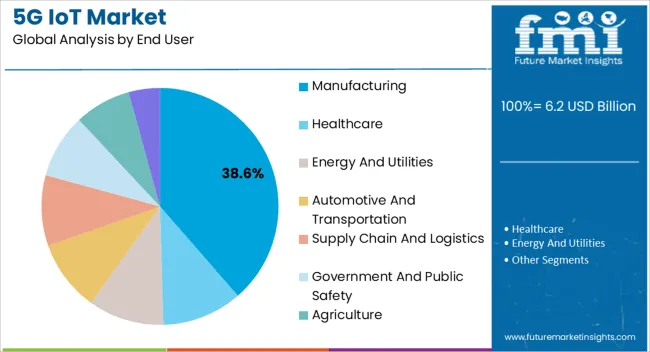
The manufacturing segment is anticipated to represent 38.60% of market revenue by 2025 under the end user category, positioning it as the leading sector. This prominence is driven by the shift toward smart factories, automation, and real time monitoring enabled by 5G IoT.
Manufacturers are leveraging 5G connectivity to improve predictive maintenance, optimize supply chain efficiency, and enable collaborative robotics. The ability to process data at the edge and integrate with AI and cloud solutions has made 5G IoT indispensable for modern manufacturing ecosystems.
The alignment of 5G IoT with Industry 4.0 initiatives is ensuring consistent growth in this segment, reinforcing its dominance in the overall market.
As per the 5G IoT industry research by Future Market Insights, the market value of the 5G IoT industry increased at around 71.9% CAGR historically, from 2020 to 2024.
Countries such as the United States, China, South Korea, and Japan held a significant global market share. The market captured a valuation of USD 1.7 million in 2020 and USD 2,786.5 million in 2025, with a CAGR of 29.2% between 2020 and 2025.
5G technology is not only confined to smartphones, but its application is present in various industries to increase workflow, business efficiency, and profitability. These industries include manufacturing, healthcare, energy, utilities, the automobile sector, government, public safety, and the agriculture sector
5G network technology collaboration with the Internet of Things has improved the reliability and performance of IoT devices. Due to their efficient performance, the market has witnessed a huge demand for 5G IoT devices.
5G network has tremendous capability to handle the vast number of static and mobile IoT devices with different speeds, data transmission, and appreciable service quality. The 5G IoT market is projected to expand at a CAGR of 33.5% over the coming 10 years.
The non-Standalone segment is securing a share of 55.4% in the global market during the forecast period. Non-Standalone plays a vital role as they are responsible for developing the telecommunication & manufacturing sector.
5G networks have focused on non-standalone, especially in the telecommunication sector, for better connectivity. The non-standalone category has a wide range of applications that provide high-speed broadband with good data bandwidth and reliable connectivity.
NSA is the first to launch 5G, and customers and enterprises are interested in the segment. It enables good video streaming without buffering, improving the user experience.
The key reason for good market performance by the 5G non-standalone segment is low capital and operating expenditure for operators as it delivers better performance. Overall, non-standalone is estimated to dominate the global market by 2035.
The manufacturing segment shows the maximum potential for growth in the 5G IoT industry in the end-user segment. Revenue through manufacturing is expected to grow at a positive rate during the next ten years.
Manufacturing industries are evolving toward technological advancement and are moving toward 5G IoT solutions. While the world is embracing Industry 4.0, 5G IOT has huge scope to accelerate and develop digitalized factories and implement technological development.
Manufacturers are taking steps toward improvement in technology as it is cutting down production costs and improving quality. 5 G IoT devices can drive machinery used in manufacturing industries for better efficiency and profitability with proper safety measures. It is estimated to increase productivity. 5G IoT solutions are deployed in the value chain and are used to monitor business developments.
| Countries | Current Market Share 2025 |
|---|---|
| The United States | 15.4% |
| Germany | 10.2% |
| Japan | 5.4% |
| Australia | 2.2% |
The market in North America is projected to register a share of 29.4% during the forecast period owing to the growing need for fast connectivity in the region. The evolution of technology and the fast implementation, mainly in the telecommunication and energy sectors in the United States and Canada, has amplified regional market growth.
Other countries such as Japan and Australia are also securing a relevant share of 5.4% and 2.2% respectively during the forecast period.
The United States dominated the market by securing a share of 15.4% during the forecast period. It is due to increased research and development investment and the local presence of global players. The United States has played a vital role in implementing technology advancements in the telecommunication sector.
Huge development is going on with 5G IoT solutions. For the first time in the United States and Canada, 5G IoT solutions were implemented in the satellite network. The satellite has good coverage and enables network connectivity for millions of mobile devices. Due to these technological advancements, there is a good attraction to 5G IoT solutions in the region, so the market is growing positively.
| Countries | Current CAGR Market Values 2025 |
|---|---|
| China | 32.1% |
| India | 29.6% |
| The United Kingdom | 28.3% |
China is one of the significant countries in the global market that secures a share of 32.1% during the forecast period. Telecommunication companies in China such as ZTE, China Mobile, and Huawei are notably growing the market by increasing the adoption of 5G IoT.
The end-user industries such as transportation, manufacturing, agriculture, smart cities, and healthcare fuel the global market. These infrastructures in China are significantly increasing the demand for 5G IoT for remote monitoring, connected vehicles, and precision agriculture.
The government of China created favorable policies to support advanced technologies by investing heavily. The key companies in China innovate and promote advanced manufacturing services with the adoption of 5G IoT by investing in research and development activities. These advanced technologies, huge infrastructure, and present key vendors are estimated to propel China market by 2035.
India is estimated to secure a share of 29.6% in the global market during the forecast period. The increasing demand for high-speed data in end-use industries such as healthcare, telecommunications, and automobiles drives the global market.
Government of India and other departments’ initiatives and several programs to support advanced technology to enhance consumers' experiences. Department of Telecommunications promotes 5G technology by implementing the Internet of Things.
Telecommunication companies in India are surging the market by significantly increasing the adoption of 5G IoT. These companies include Bharti Airtel, Vodafone Idea, and Reliance Jio.
These companies collaborate and invest huge amounts in developing advanced technology network connections for their customers. These factors are estimated to drive India’s market during the forecast period.
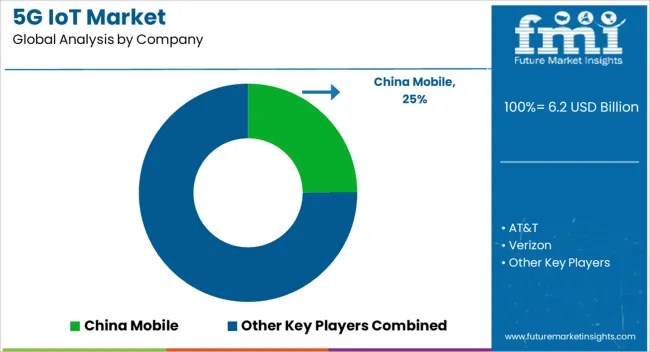
The key players, such as China Mobile; AT&T; Verizon; T-Mobile; Vodafone, have adopted several technological strategies to enhance their revenue and market standings. The market is highly competitive by the present key players. These players are vital in surging the global market by innovating advanced products.
Key players focus on consumers' requirements and develop products to satisfy their desire. They are adopting various marketing tactics to drive the global market such as mergers, collaborations, acquisitions, product launches, and agreements.
Some of the Recent Developments by Key 5G IoT Providers:
Similarly, recent developments related to companies offering 5G IoT have been tracked by the team at Future Market Insights, which are available in the full report.
| Attribute | Details |
|---|---|
| Forecast Period | 2025 to 2035 |
| Historical Data Available for | 2020 to 2025 |
| Market Analysis | USD billion for Value |
| Key Countries Covered | The United States, The United Kingdom, Japan, India, China, Australia, Germany |
| Key Segments Covered | Component, Network Type, End User, Region |
| Key Companies Profiled | China Mobile; AT&T; Verizon; T-Mobile; Vodafone; Orange; Telefonica; Deutsche Telekom; Ericsson; Huawei |
| Report Coverage | Market Forecast, Company Share Analysis, Competition Intelligence, DROT Analysis, Market Dynamics and Challenges, and Strategic Growth Initiatives |
| Customization & Pricing | Available upon Request |
The global 5G IoT market is estimated to be valued at USD 6.2 billion in 2025.
The market size for the 5G IoT market is projected to reach USD 85.0 billion by 2035.
The 5G IoT market is expected to grow at a 29.9% CAGR between 2025 and 2035.
The key product types in 5G IoT market are hardware, platform, connectivity, services, _professional services and _managed services.
In terms of network type, 5G standalone segment to command 55.3% share in the 5G IoT market in 2025.


Full Research Suite comprises of:
Market outlook & trends analysis
Interviews & case studies
Strategic recommendations
Vendor profiles & capabilities analysis
5-year forecasts
8 regions and 60+ country-level data splits
Market segment data splits
12 months of continuous data updates
DELIVERED AS:
PDF EXCEL ONLINE
5G Industrial IOT Market Size and Share Forecast Outlook 2025 to 2035
5G Millimeter Wave RF Transceiver Market Size and Share Forecast Outlook 2025 to 2035
5G Testing Market Size and Share Forecast Outlook 2025 to 2035
5G in Healthcare Market Analysis Size and Share Forecast Outlook 2025 to 2035
5G Temperature-Compensated Crystal Oscillator (TCXO) Market Size and Share Forecast Outlook 2025 to 2035
5G Remote Surgery System Market Analysis - Size, Share, and Forecast Outlook 2025 to 2035
5G Telemedicine Platform Market Size and Share Forecast Outlook 2025 to 2035
5G in Defense Market Size and Share Forecast Outlook 2025 to 2035
5G Enterprise Private Network Market Size and Share Forecast Outlook 2025 to 2035
5G Edge Cloud Network and Services Market Size and Share Forecast Outlook 2025 to 2035
5G Automotive Grade Product Market Size and Share Forecast Outlook 2025 to 2035
5G Enterprise Market Size and Share Forecast Outlook 2025 to 2035
5G Infrastructure Market Size and Share Forecast Outlook 2025 to 2035
5G RAN Market Size and Share Forecast Outlook 2025 to 2035
5G Security Market Size and Share Forecast Outlook 2025 to 2035
5G Testing Equipment Market Analysis - Size, Growth, and Forecast 2025 to 2035
5G technology market Analysis by Technology Type, Application, Vertical, and Region – Growth, trends and forecast from 2025 to 2035
5G in Automotive and Smart Transportation Market by Solution ,Application,Industry , Warehousing & Logistics, Warehousing & Logistics, Public Safety and Others & Region Forecast till 2025 to 2035
5G System Integration Market Insights - Demand & Growth Forecast 2025 to 2035
5G Chipset Market Analysis - Growth & Forecast through 2034

Thank you!
You will receive an email from our Business Development Manager. Please be sure to check your SPAM/JUNK folder too.
Chat With
MaRIA