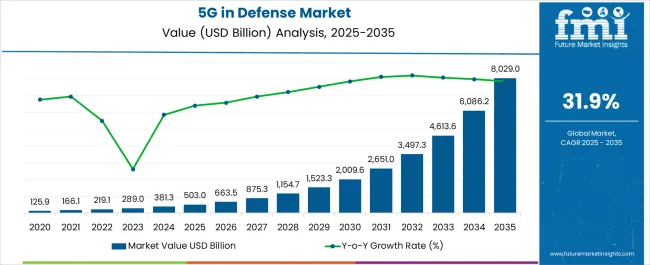
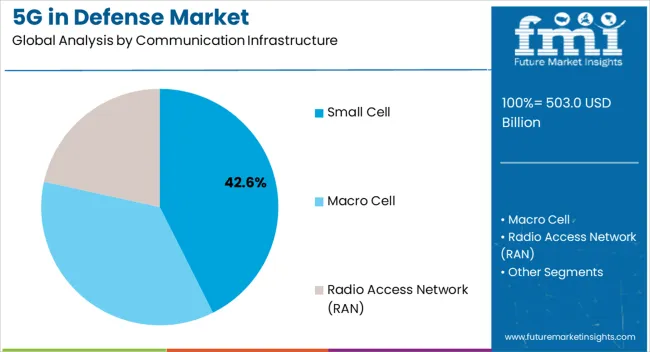
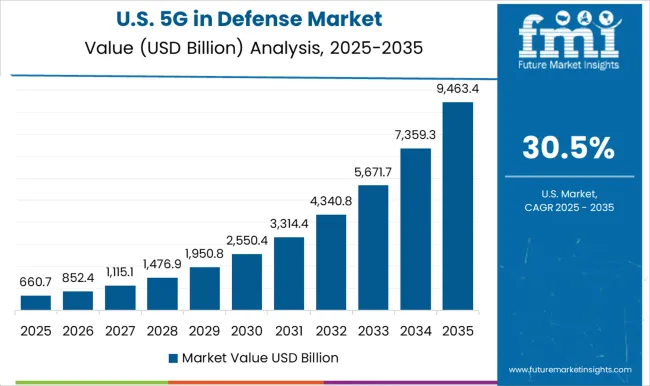
The global 5G in defense market is estimated at USD 281.8 billion in 2023. With a CAGR of 33.6% from 2023 to 2033, the market is expected to surpass a valuation of USD 5,118.3 billion by 2033. Smart cell communication infrastructure is expected to be the highest revenue-generating category, projected to register a CAGR of 31.5% during 2023 to 2033.
Attributes | Details |
---|---|
Global 5G in Defense Market Size (2023) | USD 281.8 billion |
Global 5G in Defense Market Size (2033) | USD 5,118.3 billion |
Global 5G in Defense Market CAGR (2023 to 2033) | 33.6% |
United States 5G in Defense Market Size (2033) | USD 1.3 billion |
United States 5G in Defense Market CAGR (2023 to 2033) | 33% |
As per the 5G in defense market research by Future Market Insights, historically, from 2018 to 2022, the market value of the 5G in defense market increased at around 82.8% CAGR. With an absolute dollar opportunity of USD 3.6 billion, the market is projected to reach a valuation of USD 3.8 billion by 2033.
The 5G mobile network can connect almost everyone and everything, including objects, gadgets, and machines. The utilization of remarkably fast 5G networks for defense and security objectives could expand ISR systems and processing, upgrade logistics operations for increased efficiency, and develop new command and control ways, among other things. MILITARY EQUIPMENT AND TECHNOLOGY COMPANIES WILL USE 5G software and hardware for current and future systems, benefiting from valuable properties such as quick response times and wide bandwidths, allowing for significantly fast transmission and reception of images demonstrating real-time battlefield scenarios.
The growing reliance on big data for decision-making is projected to drive the increased need for 5G networks of defense equipment. The increased use of real-time data for decisive decision-making has raised substantial data collections. With faster and more thorough communication, the 5G network will establish the capacity to take huge amounts of data more swiftly. Through its 5G network, this new wireless network would allow for real-time data transfer from unmanned aerial vehicles and surveillance drones to command centers, boosting situational awareness and tactical reconnaissance.
Defense program demand will propel interoperability forward in the defense market. End-to-end slicing for unique end users can be carried out via 5G networks. Slices can be tailor-made to offer system performance needed by programs such as autonomous cars and trucks and automated process technology.
Some materials can be optimized because of this broader, higher spectrum and bandwidth. Additionally, 5 G's greater bandwidth can contribute to logistics and supply chain management by providing real-time insight into logistics using various sensors. Higher government investment in 5G will likely lead to its success in the defense market.
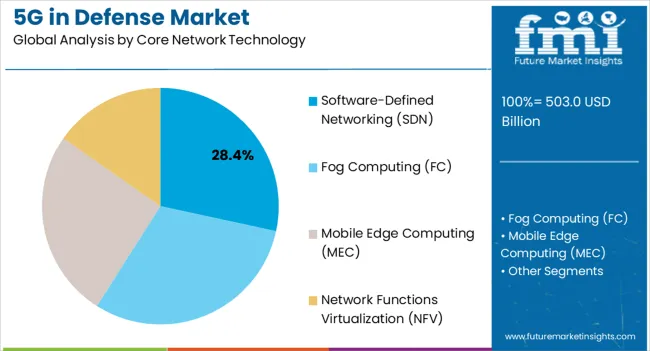
The high cost of building 5G infrastructure has slowed the growth of 5G in defense industry. The 5G network is built on fiber infrastructure, which requires considerable investment to grow. Similarly, macrocells, which employ low frequency waves to cover larger distances and provide intermittent network services, have a higher installation rate than small cells and femtocells. Furthermore, the 5G network core is based on Software-defined Networking (SDN) and Network Function Virtualization (NFV), both of which use HTTP and REST API protocols, both of which have vulnerabilities that can be exploited with tools, raising the risk of cyberattacks.
The 5G network has been shown to boost the performance of autonomous systems. China, the United States, and Israel are testing and using 5G technology in their military forces. Countries in Europe, such as France and Italy, are also planning to integrate 5G in their military forces. The US Army planned to deploy an array of battle robots at various combinability factors, including autonomous navigation, surveillance, and IED evacuation, according to the Federation of American Scientists (FAS) report Artificial Intelligence and National Security, written in November 2020. These devices would be utilized along with the fighting vehicle that could be manned.
The Navy created the Rapid Autonomy Integration Lab (RAIL) to build, assess, certify, and deploy new and improved autonomous systems. The 5G network is said to have improved the efficiency of autonomous systems by providing faster speeds and more capacity. As a result, the market is expected to be driven by an increase in the adoption of autonomous systems and connected devices due to their better and higher performance on the 5G network.
5G enables governments worldwide to deliver secure, dependable, and agile safety for their citizens and assets. These characteristics encourage governments to boost their funding for 5G technology development. For example, Taiwan's National Communications Commission (NCC) offered a subsidy of USD 948.5 Million to five telecom operators for the implementation of a 5G network from 2021 to 2025. This demonstrates governments' intentions to encourage the development of 5G technologies.
Government subsidies, R&D grants for 5G suppliers, and other forms of government assistance assist telecom companies and other enterprises involved in the 5G industry in creating high-cost infrastructures and services to promote the growth of 5G. This move benefits several companies, including L3Harris Technologies, Inc., Raytheon Technologies Corporation, Telefonaktiebolaget LM Ericsson, and Nokia Corporation. Brazil, China, and India intend to introduce 5G in both private and government applications.
The rise of the 5G sector is aided by government funding. During the forecast period, the increase in government efforts is likely to boost the growth of the 5G in the military market.
Due to the increased investment in 5G technology by the US Department of Defense, the market in North America is projected to account for the fastest growth in the 5G defense market throughout the projection period. Furthermore, the expanding use of connected systems through IoT, increased demand for low-latency communication technology, and the allotment of a wide frequency band to the US military have given new chances for developers to create 5G components and improve the system's efficiency.
Since governments in the region are attempting to increase the processing and operation of ISR (intelligence, surveillance, and reconnaissance) systems, the 5G in military market in the Asia Pacific is expected to hold the second highest share throughout the projection period.
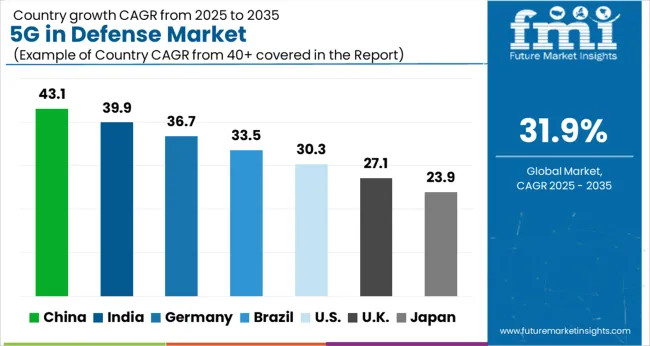
The United States is expected to account for the highest market share of USD 1.3 billion by the end of 2033. The United States is projected to be the world leader in developing and deploying 5G technology, accounting for a large portion of the global market. 5G technology improves the speed and functionality of ISR systems, enables the creation of more advanced command and control systems, improves augmented and virtual reality applications, facilitates maintenance processes, and enhances logistical efficiency using technologies like blockchain.
5G network operators' large-scale deployment of small cells is the main reason responsible for the proliferation of tiny segments of 5G networks. The speed at which 5G data is transferred is expected to increase as 5G network operators continue to expand their use of small cells.
Small cell networks are expected to play an important role in the implementation of 5G communications infrastructure because of their contribution to deployment. Communication speed will increase substantially with the introduction of 5G networks, and small cells aid 5G initiation. They are expected to bring an important impact to the 5G communications infrastructure market.
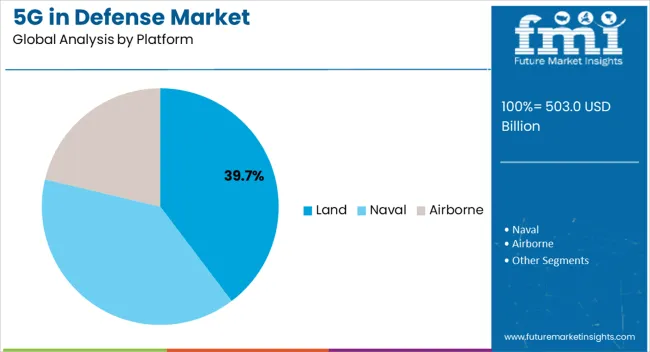
The airborne segment is forecasted to grow at a CAGR of over 31% during 2023 to 2033. Airborne applications such as drones and mission-critical communications will be able to perform more efficiently as 5G technology advances. Rapid advancements in 5G networks and infrastructure and increased usage of IoT devices and 5G networks are driving this segment's growth. The goal is to modernize communication systems, improve interconnectivity, and minimize response time during critical moments. Another significant element driving revenue growth in the market is the increased use of automated vehicles for surveillance, intelligence gathering, and target recognition.
Over the forecast period, the Ultra-reliable Low-Latency Communications (URLLC) segment is projected to lead in terms of revenue contribution to the global market. The 5G network is projected to be 100 times faster than the 4G network, which means that communication networks in military operations will be able to act quickly and successfully in critical importance situations. This will create extra demand for the URLLC services that are presently used in military applications.
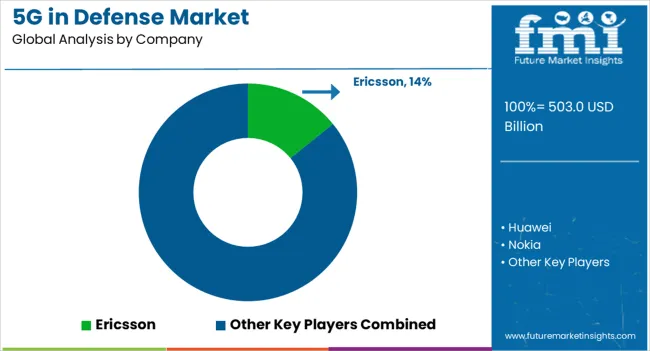
Some of the key market participants in 5G in defense market include Ericsson, Huawei, Nokia, Samsung, NEC, Thales Group, L3Harris Technologies, Inc., Raytheon Technologies, Ligado Networks, and Wind River Systems Inc.
Table 1: Global Market Value (US$ Million) Forecast by Region, 2018 to 2033
Table 2: Global Market Value (US$ Million) Forecast by Communication Infrastructure, 2018 to 2033
Table 3: Global Market Value (US$ Million) Forecast by Core Network Technology, 2018 to 2033
Table 4: Global Market Value (US$ Million) Forecast by Platform , 2018 to 2033
Table 5: Global Market Value (US$ Million) Forecast by End User, 2018 to 2033
Table 6: Global Market Value (US$ Million) Forecast by Network Type, 2018 to 2033
Table 7: Global Market Value (US$ Million) Forecast by Chipset, 2018 to 2033
Table 8: Global Market Value (US$ Million) Forecast by Operational Frequency, 2018 to 2033
Table 9: North America Market Value (US$ Million) Forecast by Country, 2018 to 2033
Table 10: North America Market Value (US$ Million) Forecast by Communication Infrastructure, 2018 to 2033
Table 11: North America Market Value (US$ Million) Forecast by Core Network Technology, 2018 to 2033
Table 12: North America Market Value (US$ Million) Forecast by Platform , 2018 to 2033
Table 13: North America Market Value (US$ Million) Forecast by End User, 2018 to 2033
Table 14: North America Market Value (US$ Million) Forecast by Network Type, 2018 to 2033
Table 15: North America Market Value (US$ Million) Forecast by Chipset, 2018 to 2033
Table 16: North America Market Value (US$ Million) Forecast by Operational Frequency, 2018 to 2033
Table 17: Latin America Market Value (US$ Million) Forecast by Country, 2018 to 2033
Table 18: Latin America Market Value (US$ Million) Forecast by Communication Infrastructure, 2018 to 2033
Table 19: Latin America Market Value (US$ Million) Forecast by Core Network Technology, 2018 to 2033
Table 20: Latin America Market Value (US$ Million) Forecast by Platform , 2018 to 2033
Table 21: Latin America Market Value (US$ Million) Forecast by End User, 2018 to 2033
Table 22: Latin America Market Value (US$ Million) Forecast by Network Type, 2018 to 2033
Table 23: Latin America Market Value (US$ Million) Forecast by Chipset, 2018 to 2033
Table 24: Latin America Market Value (US$ Million) Forecast by Operational Frequency, 2018 to 2033
Table 25: Western Europe Market Value (US$ Million) Forecast by Country, 2018 to 2033
Table 26: Western Europe Market Value (US$ Million) Forecast by Communication Infrastructure, 2018 to 2033
Table 27: Western Europe Market Value (US$ Million) Forecast by Core Network Technology, 2018 to 2033
Table 28: Western Europe Market Value (US$ Million) Forecast by Platform , 2018 to 2033
Table 29: Western Europe Market Value (US$ Million) Forecast by End User, 2018 to 2033
Table 30: Western Europe Market Value (US$ Million) Forecast by Network Type, 2018 to 2033
Table 31: Western Europe Market Value (US$ Million) Forecast by Chipset, 2018 to 2033
Table 32: Western Europe Market Value (US$ Million) Forecast by Operational Frequency, 2018 to 2033
Table 33: Eastern Europe Market Value (US$ Million) Forecast by Country, 2018 to 2033
Table 34: Eastern Europe Market Value (US$ Million) Forecast by Communication Infrastructure, 2018 to 2033
Table 35: Eastern Europe Market Value (US$ Million) Forecast by Core Network Technology, 2018 to 2033
Table 36: Eastern Europe Market Value (US$ Million) Forecast by Platform , 2018 to 2033
Table 37: Eastern Europe Market Value (US$ Million) Forecast by End User, 2018 to 2033
Table 38: Eastern Europe Market Value (US$ Million) Forecast by Network Type, 2018 to 2033
Table 39: Eastern Europe Market Value (US$ Million) Forecast by Chipset, 2018 to 2033
Table 40: Eastern Europe Market Value (US$ Million) Forecast by Operational Frequency, 2018 to 2033
Table 41: South Asia and Pacific Market Value (US$ Million) Forecast by Country, 2018 to 2033
Table 42: South Asia and Pacific Market Value (US$ Million) Forecast by Communication Infrastructure, 2018 to 2033
Table 43: South Asia and Pacific Market Value (US$ Million) Forecast by Core Network Technology, 2018 to 2033
Table 44: South Asia and Pacific Market Value (US$ Million) Forecast by Platform , 2018 to 2033
Table 45: South Asia and Pacific Market Value (US$ Million) Forecast by End User, 2018 to 2033
Table 46: South Asia and Pacific Market Value (US$ Million) Forecast by Network Type, 2018 to 2033
Table 47: South Asia and Pacific Market Value (US$ Million) Forecast by Chipset, 2018 to 2033
Table 48: South Asia and Pacific Market Value (US$ Million) Forecast by Operational Frequency, 2018 to 2033
Table 49: East Asia Market Value (US$ Million) Forecast by Country, 2018 to 2033
Table 50: East Asia Market Value (US$ Million) Forecast by Communication Infrastructure, 2018 to 2033
Table 51: East Asia Market Value (US$ Million) Forecast by Core Network Technology, 2018 to 2033
Table 52: East Asia Market Value (US$ Million) Forecast by Platform , 2018 to 2033
Table 53: East Asia Market Value (US$ Million) Forecast by End User, 2018 to 2033
Table 54: East Asia Market Value (US$ Million) Forecast by Network Type, 2018 to 2033
Table 55: East Asia Market Value (US$ Million) Forecast by Chipset, 2018 to 2033
Table 56: East Asia Market Value (US$ Million) Forecast by Operational Frequency, 2018 to 2033
Table 57: Middle East and Africa Market Value (US$ Million) Forecast by Country, 2018 to 2033
Table 58: Middle East and Africa Market Value (US$ Million) Forecast by Communication Infrastructure, 2018 to 2033
Table 59: Middle East and Africa Market Value (US$ Million) Forecast by Core Network Technology, 2018 to 2033
Table 60: Middle East and Africa Market Value (US$ Million) Forecast by Platform , 2018 to 2033
Table 61: Middle East and Africa Market Value (US$ Million) Forecast by End User, 2018 to 2033
Table 62: Middle East and Africa Market Value (US$ Million) Forecast by Network Type, 2018 to 2033
Table 63: Middle East and Africa Market Value (US$ Million) Forecast by Chipset, 2018 to 2033
Table 64: Middle East and Africa Market Value (US$ Million) Forecast by Operational Frequency, 2018 to 2033
Figure 1: Global Market Value (US$ Million) by Communication Infrastructure, 2023 to 2033
Figure 2: Global Market Value (US$ Million) by Core Network Technology, 2023 to 2033
Figure 3: Global Market Value (US$ Million) by Platform , 2023 to 2033
Figure 4: Global Market Value (US$ Million) by End User, 2023 to 2033
Figure 5: Global Market Value (US$ Million) by Network Type, 2023 to 2033
Figure 6: Global Market Value (US$ Million) by Chipset, 2023 to 2033
Figure 7: Global Market Value (US$ Million) by Operational Frequency, 2023 to 2033
Figure 8: Global Market Value (US$ Million) by Region, 2023 to 2033
Figure 9: Global Market Value (US$ Million) Analysis by Region, 2018 to 2033
Figure 10: Global Market Value Share (%) and BPS Analysis by Region, 2023 to 2033
Figure 11: Global Market Y-o-Y Growth (%) Projections by Region, 2023 to 2033
Figure 12: Global Market Value (US$ Million) Analysis by Communication Infrastructure, 2018 to 2033
Figure 13: Global Market Value Share (%) and BPS Analysis by Communication Infrastructure, 2023 to 2033
Figure 14: Global Market Y-o-Y Growth (%) Projections by Communication Infrastructure, 2023 to 2033
Figure 15: Global Market Value (US$ Million) Analysis by Core Network Technology, 2018 to 2033
Figure 16: Global Market Value Share (%) and BPS Analysis by Core Network Technology, 2023 to 2033
Figure 17: Global Market Y-o-Y Growth (%) Projections by Core Network Technology, 2023 to 2033
Figure 18: Global Market Value (US$ Million) Analysis by Platform , 2018 to 2033
Figure 19: Global Market Value Share (%) and BPS Analysis by Platform , 2023 to 2033
Figure 20: Global Market Y-o-Y Growth (%) Projections by Platform , 2023 to 2033
Figure 21: Global Market Value (US$ Million) Analysis by End User, 2018 to 2033
Figure 22: Global Market Value Share (%) and BPS Analysis by End User, 2023 to 2033
Figure 23: Global Market Y-o-Y Growth (%) Projections by End User, 2023 to 2033
Figure 24: Global Market Value (US$ Million) Analysis by Network Type, 2018 to 2033
Figure 25: Global Market Value Share (%) and BPS Analysis by Network Type, 2023 to 2033
Figure 26: Global Market Y-o-Y Growth (%) Projections by Network Type, 2023 to 2033
Figure 27: Global Market Value (US$ Million) Analysis by Chipset, 2018 to 2033
Figure 28: Global Market Value Share (%) and BPS Analysis by Chipset, 2023 to 2033
Figure 29: Global Market Y-o-Y Growth (%) Projections by Chipset, 2023 to 2033
Figure 30: Global Market Value (US$ Million) Analysis by Operational Frequency, 2018 to 2033
Figure 31: Global Market Value Share (%) and BPS Analysis by Operational Frequency, 2023 to 2033
Figure 32: Global Market Y-o-Y Growth (%) Projections by Operational Frequency, 2023 to 2033
Figure 33: Global Market Attractiveness by Communication Infrastructure, 2023 to 2033
Figure 34: Global Market Attractiveness by Core Network Technology, 2023 to 2033
Figure 35: Global Market Attractiveness by Platform , 2023 to 2033
Figure 36: Global Market Attractiveness by End User, 2023 to 2033
Figure 37: Global Market Attractiveness by Network Type, 2023 to 2033
Figure 38: Global Market Attractiveness by Chipset, 2023 to 2033
Figure 39: Global Market Attractiveness by Operational Frequency, 2023 to 2033
Figure 40: Global Market Attractiveness by Region, 2023 to 2033
Figure 41: North America Market Value (US$ Million) by Communication Infrastructure, 2023 to 2033
Figure 42: North America Market Value (US$ Million) by Core Network Technology, 2023 to 2033
Figure 43: North America Market Value (US$ Million) by Platform , 2023 to 2033
Figure 44: North America Market Value (US$ Million) by End User, 2023 to 2033
Figure 45: North America Market Value (US$ Million) by Network Type, 2023 to 2033
Figure 46: North America Market Value (US$ Million) by Chipset, 2023 to 2033
Figure 47: North America Market Value (US$ Million) by Operational Frequency, 2023 to 2033
Figure 48: North America Market Value (US$ Million) by Country, 2023 to 2033
Figure 49: North America Market Value (US$ Million) Analysis by Country, 2018 to 2033
Figure 50: North America Market Value Share (%) and BPS Analysis by Country, 2023 to 2033
Figure 51: North America Market Y-o-Y Growth (%) Projections by Country, 2023 to 2033
Figure 52: North America Market Value (US$ Million) Analysis by Communication Infrastructure, 2018 to 2033
Figure 53: North America Market Value Share (%) and BPS Analysis by Communication Infrastructure, 2023 to 2033
Figure 54: North America Market Y-o-Y Growth (%) Projections by Communication Infrastructure, 2023 to 2033
Figure 55: North America Market Value (US$ Million) Analysis by Core Network Technology, 2018 to 2033
Figure 56: North America Market Value Share (%) and BPS Analysis by Core Network Technology, 2023 to 2033
Figure 57: North America Market Y-o-Y Growth (%) Projections by Core Network Technology, 2023 to 2033
Figure 58: North America Market Value (US$ Million) Analysis by Platform , 2018 to 2033
Figure 59: North America Market Value Share (%) and BPS Analysis by Platform , 2023 to 2033
Figure 60: North America Market Y-o-Y Growth (%) Projections by Platform , 2023 to 2033
Figure 61: North America Market Value (US$ Million) Analysis by End User, 2018 to 2033
Figure 62: North America Market Value Share (%) and BPS Analysis by End User, 2023 to 2033
Figure 63: North America Market Y-o-Y Growth (%) Projections by End User, 2023 to 2033
Figure 64: North America Market Value (US$ Million) Analysis by Network Type, 2018 to 2033
Figure 65: North America Market Value Share (%) and BPS Analysis by Network Type, 2023 to 2033
Figure 66: North America Market Y-o-Y Growth (%) Projections by Network Type, 2023 to 2033
Figure 67: North America Market Value (US$ Million) Analysis by Chipset, 2018 to 2033
Figure 68: North America Market Value Share (%) and BPS Analysis by Chipset, 2023 to 2033
Figure 69: North America Market Y-o-Y Growth (%) Projections by Chipset, 2023 to 2033
Figure 70: North America Market Value (US$ Million) Analysis by Operational Frequency, 2018 to 2033
Figure 71: North America Market Value Share (%) and BPS Analysis by Operational Frequency, 2023 to 2033
Figure 72: North America Market Y-o-Y Growth (%) Projections by Operational Frequency, 2023 to 2033
Figure 73: North America Market Attractiveness by Communication Infrastructure, 2023 to 2033
Figure 74: North America Market Attractiveness by Core Network Technology, 2023 to 2033
Figure 75: North America Market Attractiveness by Platform , 2023 to 2033
Figure 76: North America Market Attractiveness by End User, 2023 to 2033
Figure 77: North America Market Attractiveness by Network Type, 2023 to 2033
Figure 78: North America Market Attractiveness by Chipset, 2023 to 2033
Figure 79: North America Market Attractiveness by Operational Frequency, 2023 to 2033
Figure 80: North America Market Attractiveness by Country, 2023 to 2033
Figure 81: Latin America Market Value (US$ Million) by Communication Infrastructure, 2023 to 2033
Figure 82: Latin America Market Value (US$ Million) by Core Network Technology, 2023 to 2033
Figure 83: Latin America Market Value (US$ Million) by Platform , 2023 to 2033
Figure 84: Latin America Market Value (US$ Million) by End User, 2023 to 2033
Figure 85: Latin America Market Value (US$ Million) by Network Type, 2023 to 2033
Figure 86: Latin America Market Value (US$ Million) by Chipset, 2023 to 2033
Figure 87: Latin America Market Value (US$ Million) by Operational Frequency, 2023 to 2033
Figure 88: Latin America Market Value (US$ Million) by Country, 2023 to 2033
Figure 89: Latin America Market Value (US$ Million) Analysis by Country, 2018 to 2033
Figure 90: Latin America Market Value Share (%) and BPS Analysis by Country, 2023 to 2033
Figure 91: Latin America Market Y-o-Y Growth (%) Projections by Country, 2023 to 2033
Figure 92: Latin America Market Value (US$ Million) Analysis by Communication Infrastructure, 2018 to 2033
Figure 93: Latin America Market Value Share (%) and BPS Analysis by Communication Infrastructure, 2023 to 2033
Figure 94: Latin America Market Y-o-Y Growth (%) Projections by Communication Infrastructure, 2023 to 2033
Figure 95: Latin America Market Value (US$ Million) Analysis by Core Network Technology, 2018 to 2033
Figure 96: Latin America Market Value Share (%) and BPS Analysis by Core Network Technology, 2023 to 2033
Figure 97: Latin America Market Y-o-Y Growth (%) Projections by Core Network Technology, 2023 to 2033
Figure 98: Latin America Market Value (US$ Million) Analysis by Platform , 2018 to 2033
Figure 99: Latin America Market Value Share (%) and BPS Analysis by Platform , 2023 to 2033
Figure 100: Latin America Market Y-o-Y Growth (%) Projections by Platform , 2023 to 2033
Figure 101: Latin America Market Value (US$ Million) Analysis by End User, 2018 to 2033
Figure 102: Latin America Market Value Share (%) and BPS Analysis by End User, 2023 to 2033
Figure 103: Latin America Market Y-o-Y Growth (%) Projections by End User, 2023 to 2033
Figure 104: Latin America Market Value (US$ Million) Analysis by Network Type, 2018 to 2033
Figure 105: Latin America Market Value Share (%) and BPS Analysis by Network Type, 2023 to 2033
Figure 106: Latin America Market Y-o-Y Growth (%) Projections by Network Type, 2023 to 2033
Figure 107: Latin America Market Value (US$ Million) Analysis by Chipset, 2018 to 2033
Figure 108: Latin America Market Value Share (%) and BPS Analysis by Chipset, 2023 to 2033
Figure 109: Latin America Market Y-o-Y Growth (%) Projections by Chipset, 2023 to 2033
Figure 110: Latin America Market Value (US$ Million) Analysis by Operational Frequency, 2018 to 2033
Figure 111: Latin America Market Value Share (%) and BPS Analysis by Operational Frequency, 2023 to 2033
Figure 112: Latin America Market Y-o-Y Growth (%) Projections by Operational Frequency, 2023 to 2033
Figure 113: Latin America Market Attractiveness by Communication Infrastructure, 2023 to 2033
Figure 114: Latin America Market Attractiveness by Core Network Technology, 2023 to 2033
Figure 115: Latin America Market Attractiveness by Platform , 2023 to 2033
Figure 116: Latin America Market Attractiveness by End User, 2023 to 2033
Figure 117: Latin America Market Attractiveness by Network Type, 2023 to 2033
Figure 118: Latin America Market Attractiveness by Chipset, 2023 to 2033
Figure 119: Latin America Market Attractiveness by Operational Frequency, 2023 to 2033
Figure 120: Latin America Market Attractiveness by Country, 2023 to 2033
Figure 121: Western Europe Market Value (US$ Million) by Communication Infrastructure, 2023 to 2033
Figure 122: Western Europe Market Value (US$ Million) by Core Network Technology, 2023 to 2033
Figure 123: Western Europe Market Value (US$ Million) by Platform , 2023 to 2033
Figure 124: Western Europe Market Value (US$ Million) by End User, 2023 to 2033
Figure 125: Western Europe Market Value (US$ Million) by Network Type, 2023 to 2033
Figure 126: Western Europe Market Value (US$ Million) by Chipset, 2023 to 2033
Figure 127: Western Europe Market Value (US$ Million) by Operational Frequency, 2023 to 2033
Figure 128: Western Europe Market Value (US$ Million) by Country, 2023 to 2033
Figure 129: Western Europe Market Value (US$ Million) Analysis by Country, 2018 to 2033
Figure 130: Western Europe Market Value Share (%) and BPS Analysis by Country, 2023 to 2033
Figure 131: Western Europe Market Y-o-Y Growth (%) Projections by Country, 2023 to 2033
Figure 132: Western Europe Market Value (US$ Million) Analysis by Communication Infrastructure, 2018 to 2033
Figure 133: Western Europe Market Value Share (%) and BPS Analysis by Communication Infrastructure, 2023 to 2033
Figure 134: Western Europe Market Y-o-Y Growth (%) Projections by Communication Infrastructure, 2023 to 2033
Figure 135: Western Europe Market Value (US$ Million) Analysis by Core Network Technology, 2018 to 2033
Figure 136: Western Europe Market Value Share (%) and BPS Analysis by Core Network Technology, 2023 to 2033
Figure 137: Western Europe Market Y-o-Y Growth (%) Projections by Core Network Technology, 2023 to 2033
Figure 138: Western Europe Market Value (US$ Million) Analysis by Platform , 2018 to 2033
Figure 139: Western Europe Market Value Share (%) and BPS Analysis by Platform , 2023 to 2033
Figure 140: Western Europe Market Y-o-Y Growth (%) Projections by Platform , 2023 to 2033
Figure 141: Western Europe Market Value (US$ Million) Analysis by End User, 2018 to 2033
Figure 142: Western Europe Market Value Share (%) and BPS Analysis by End User, 2023 to 2033
Figure 143: Western Europe Market Y-o-Y Growth (%) Projections by End User, 2023 to 2033
Figure 144: Western Europe Market Value (US$ Million) Analysis by Network Type, 2018 to 2033
Figure 145: Western Europe Market Value Share (%) and BPS Analysis by Network Type, 2023 to 2033
Figure 146: Western Europe Market Y-o-Y Growth (%) Projections by Network Type, 2023 to 2033
Figure 147: Western Europe Market Value (US$ Million) Analysis by Chipset, 2018 to 2033
Figure 148: Western Europe Market Value Share (%) and BPS Analysis by Chipset, 2023 to 2033
Figure 149: Western Europe Market Y-o-Y Growth (%) Projections by Chipset, 2023 to 2033
Figure 150: Western Europe Market Value (US$ Million) Analysis by Operational Frequency, 2018 to 2033
Figure 151: Western Europe Market Value Share (%) and BPS Analysis by Operational Frequency, 2023 to 2033
Figure 152: Western Europe Market Y-o-Y Growth (%) Projections by Operational Frequency, 2023 to 2033
Figure 153: Western Europe Market Attractiveness by Communication Infrastructure, 2023 to 2033
Figure 154: Western Europe Market Attractiveness by Core Network Technology, 2023 to 2033
Figure 155: Western Europe Market Attractiveness by Platform , 2023 to 2033
Figure 156: Western Europe Market Attractiveness by End User, 2023 to 2033
Figure 157: Western Europe Market Attractiveness by Network Type, 2023 to 2033
Figure 158: Western Europe Market Attractiveness by Chipset, 2023 to 2033
Figure 159: Western Europe Market Attractiveness by Operational Frequency, 2023 to 2033
Figure 160: Western Europe Market Attractiveness by Country, 2023 to 2033
Figure 161: Eastern Europe Market Value (US$ Million) by Communication Infrastructure, 2023 to 2033
Figure 162: Eastern Europe Market Value (US$ Million) by Core Network Technology, 2023 to 2033
Figure 163: Eastern Europe Market Value (US$ Million) by Platform , 2023 to 2033
Figure 164: Eastern Europe Market Value (US$ Million) by End User, 2023 to 2033
Figure 165: Eastern Europe Market Value (US$ Million) by Network Type, 2023 to 2033
Figure 166: Eastern Europe Market Value (US$ Million) by Chipset, 2023 to 2033
Figure 167: Eastern Europe Market Value (US$ Million) by Operational Frequency, 2023 to 2033
Figure 168: Eastern Europe Market Value (US$ Million) by Country, 2023 to 2033
Figure 169: Eastern Europe Market Value (US$ Million) Analysis by Country, 2018 to 2033
Figure 170: Eastern Europe Market Value Share (%) and BPS Analysis by Country, 2023 to 2033
Figure 171: Eastern Europe Market Y-o-Y Growth (%) Projections by Country, 2023 to 2033
Figure 172: Eastern Europe Market Value (US$ Million) Analysis by Communication Infrastructure, 2018 to 2033
Figure 173: Eastern Europe Market Value Share (%) and BPS Analysis by Communication Infrastructure, 2023 to 2033
Figure 174: Eastern Europe Market Y-o-Y Growth (%) Projections by Communication Infrastructure, 2023 to 2033
Figure 175: Eastern Europe Market Value (US$ Million) Analysis by Core Network Technology, 2018 to 2033
Figure 176: Eastern Europe Market Value Share (%) and BPS Analysis by Core Network Technology, 2023 to 2033
Figure 177: Eastern Europe Market Y-o-Y Growth (%) Projections by Core Network Technology, 2023 to 2033
Figure 178: Eastern Europe Market Value (US$ Million) Analysis by Platform , 2018 to 2033
Figure 179: Eastern Europe Market Value Share (%) and BPS Analysis by Platform , 2023 to 2033
Figure 180: Eastern Europe Market Y-o-Y Growth (%) Projections by Platform , 2023 to 2033
Figure 181: Eastern Europe Market Value (US$ Million) Analysis by End User, 2018 to 2033
Figure 182: Eastern Europe Market Value Share (%) and BPS Analysis by End User, 2023 to 2033
Figure 183: Eastern Europe Market Y-o-Y Growth (%) Projections by End User, 2023 to 2033
Figure 184: Eastern Europe Market Value (US$ Million) Analysis by Network Type, 2018 to 2033
Figure 185: Eastern Europe Market Value Share (%) and BPS Analysis by Network Type, 2023 to 2033
Figure 186: Eastern Europe Market Y-o-Y Growth (%) Projections by Network Type, 2023 to 2033
Figure 187: Eastern Europe Market Value (US$ Million) Analysis by Chipset, 2018 to 2033
Figure 188: Eastern Europe Market Value Share (%) and BPS Analysis by Chipset, 2023 to 2033
Figure 189: Eastern Europe Market Y-o-Y Growth (%) Projections by Chipset, 2023 to 2033
Figure 190: Eastern Europe Market Value (US$ Million) Analysis by Operational Frequency, 2018 to 2033
Figure 191: Eastern Europe Market Value Share (%) and BPS Analysis by Operational Frequency, 2023 to 2033
Figure 192: Eastern Europe Market Y-o-Y Growth (%) Projections by Operational Frequency, 2023 to 2033
Figure 193: Eastern Europe Market Attractiveness by Communication Infrastructure, 2023 to 2033
Figure 194: Eastern Europe Market Attractiveness by Core Network Technology, 2023 to 2033
Figure 195: Eastern Europe Market Attractiveness by Platform , 2023 to 2033
Figure 196: Eastern Europe Market Attractiveness by End User, 2023 to 2033
Figure 197: Eastern Europe Market Attractiveness by Network Type, 2023 to 2033
Figure 198: Eastern Europe Market Attractiveness by Chipset, 2023 to 2033
Figure 199: Eastern Europe Market Attractiveness by Operational Frequency, 2023 to 2033
Figure 200: Eastern Europe Market Attractiveness by Country, 2023 to 2033
Figure 201: South Asia and Pacific Market Value (US$ Million) by Communication Infrastructure, 2023 to 2033
Figure 202: South Asia and Pacific Market Value (US$ Million) by Core Network Technology, 2023 to 2033
Figure 203: South Asia and Pacific Market Value (US$ Million) by Platform , 2023 to 2033
Figure 204: South Asia and Pacific Market Value (US$ Million) by End User, 2023 to 2033
Figure 205: South Asia and Pacific Market Value (US$ Million) by Network Type, 2023 to 2033
Figure 206: South Asia and Pacific Market Value (US$ Million) by Chipset, 2023 to 2033
Figure 207: South Asia and Pacific Market Value (US$ Million) by Operational Frequency, 2023 to 2033
Figure 208: South Asia and Pacific Market Value (US$ Million) by Country, 2023 to 2033
Figure 209: South Asia and Pacific Market Value (US$ Million) Analysis by Country, 2018 to 2033
Figure 210: South Asia and Pacific Market Value Share (%) and BPS Analysis by Country, 2023 to 2033
Figure 211: South Asia and Pacific Market Y-o-Y Growth (%) Projections by Country, 2023 to 2033
Figure 212: South Asia and Pacific Market Value (US$ Million) Analysis by Communication Infrastructure, 2018 to 2033
Figure 213: South Asia and Pacific Market Value Share (%) and BPS Analysis by Communication Infrastructure, 2023 to 2033
Figure 214: South Asia and Pacific Market Y-o-Y Growth (%) Projections by Communication Infrastructure, 2023 to 2033
Figure 215: South Asia and Pacific Market Value (US$ Million) Analysis by Core Network Technology, 2018 to 2033
Figure 216: South Asia and Pacific Market Value Share (%) and BPS Analysis by Core Network Technology, 2023 to 2033
Figure 217: South Asia and Pacific Market Y-o-Y Growth (%) Projections by Core Network Technology, 2023 to 2033
Figure 218: South Asia and Pacific Market Value (US$ Million) Analysis by Platform , 2018 to 2033
Figure 219: South Asia and Pacific Market Value Share (%) and BPS Analysis by Platform , 2023 to 2033
Figure 220: South Asia and Pacific Market Y-o-Y Growth (%) Projections by Platform , 2023 to 2033
Figure 221: South Asia and Pacific Market Value (US$ Million) Analysis by End User, 2018 to 2033
Figure 222: South Asia and Pacific Market Value Share (%) and BPS Analysis by End User, 2023 to 2033
Figure 223: South Asia and Pacific Market Y-o-Y Growth (%) Projections by End User, 2023 to 2033
Figure 224: South Asia and Pacific Market Value (US$ Million) Analysis by Network Type, 2018 to 2033
Figure 225: South Asia and Pacific Market Value Share (%) and BPS Analysis by Network Type, 2023 to 2033
Figure 226: South Asia and Pacific Market Y-o-Y Growth (%) Projections by Network Type, 2023 to 2033
Figure 227: South Asia and Pacific Market Value (US$ Million) Analysis by Chipset, 2018 to 2033
Figure 228: South Asia and Pacific Market Value Share (%) and BPS Analysis by Chipset, 2023 to 2033
Figure 229: South Asia and Pacific Market Y-o-Y Growth (%) Projections by Chipset, 2023 to 2033
Figure 230: South Asia and Pacific Market Value (US$ Million) Analysis by Operational Frequency, 2018 to 2033
Figure 231: South Asia and Pacific Market Value Share (%) and BPS Analysis by Operational Frequency, 2023 to 2033
Figure 232: South Asia and Pacific Market Y-o-Y Growth (%) Projections by Operational Frequency, 2023 to 2033
Figure 233: South Asia and Pacific Market Attractiveness by Communication Infrastructure, 2023 to 2033
Figure 234: South Asia and Pacific Market Attractiveness by Core Network Technology, 2023 to 2033
Figure 235: South Asia and Pacific Market Attractiveness by Platform , 2023 to 2033
Figure 236: South Asia and Pacific Market Attractiveness by End User, 2023 to 2033
Figure 237: South Asia and Pacific Market Attractiveness by Network Type, 2023 to 2033
Figure 238: South Asia and Pacific Market Attractiveness by Chipset, 2023 to 2033
Figure 239: South Asia and Pacific Market Attractiveness by Operational Frequency, 2023 to 2033
Figure 240: South Asia and Pacific Market Attractiveness by Country, 2023 to 2033
Figure 241: East Asia Market Value (US$ Million) by Communication Infrastructure, 2023 to 2033
Figure 242: East Asia Market Value (US$ Million) by Core Network Technology, 2023 to 2033
Figure 243: East Asia Market Value (US$ Million) by Platform , 2023 to 2033
Figure 244: East Asia Market Value (US$ Million) by End User, 2023 to 2033
Figure 245: East Asia Market Value (US$ Million) by Network Type, 2023 to 2033
Figure 246: East Asia Market Value (US$ Million) by Chipset, 2023 to 2033
Figure 247: East Asia Market Value (US$ Million) by Operational Frequency, 2023 to 2033
Figure 248: East Asia Market Value (US$ Million) by Country, 2023 to 2033
Figure 249: East Asia Market Value (US$ Million) Analysis by Country, 2018 to 2033
Figure 250: East Asia Market Value Share (%) and BPS Analysis by Country, 2023 to 2033
Figure 251: East Asia Market Y-o-Y Growth (%) Projections by Country, 2023 to 2033
Figure 252: East Asia Market Value (US$ Million) Analysis by Communication Infrastructure, 2018 to 2033
Figure 253: East Asia Market Value Share (%) and BPS Analysis by Communication Infrastructure, 2023 to 2033
Figure 254: East Asia Market Y-o-Y Growth (%) Projections by Communication Infrastructure, 2023 to 2033
Figure 255: East Asia Market Value (US$ Million) Analysis by Core Network Technology, 2018 to 2033
Figure 256: East Asia Market Value Share (%) and BPS Analysis by Core Network Technology, 2023 to 2033
Figure 257: East Asia Market Y-o-Y Growth (%) Projections by Core Network Technology, 2023 to 2033
Figure 258: East Asia Market Value (US$ Million) Analysis by Platform , 2018 to 2033
Figure 259: East Asia Market Value Share (%) and BPS Analysis by Platform , 2023 to 2033
Figure 260: East Asia Market Y-o-Y Growth (%) Projections by Platform , 2023 to 2033
Figure 261: East Asia Market Value (US$ Million) Analysis by End User, 2018 to 2033
Figure 262: East Asia Market Value Share (%) and BPS Analysis by End User, 2023 to 2033
Figure 263: East Asia Market Y-o-Y Growth (%) Projections by End User, 2023 to 2033
Figure 264: East Asia Market Value (US$ Million) Analysis by Network Type, 2018 to 2033
Figure 265: East Asia Market Value Share (%) and BPS Analysis by Network Type, 2023 to 2033
Figure 266: East Asia Market Y-o-Y Growth (%) Projections by Network Type, 2023 to 2033
Figure 267: East Asia Market Value (US$ Million) Analysis by Chipset, 2018 to 2033
Figure 268: East Asia Market Value Share (%) and BPS Analysis by Chipset, 2023 to 2033
Figure 269: East Asia Market Y-o-Y Growth (%) Projections by Chipset, 2023 to 2033
Figure 270: East Asia Market Value (US$ Million) Analysis by Operational Frequency, 2018 to 2033
Figure 271: East Asia Market Value Share (%) and BPS Analysis by Operational Frequency, 2023 to 2033
Figure 272: East Asia Market Y-o-Y Growth (%) Projections by Operational Frequency, 2023 to 2033
Figure 273: East Asia Market Attractiveness by Communication Infrastructure, 2023 to 2033
Figure 274: East Asia Market Attractiveness by Core Network Technology, 2023 to 2033
Figure 275: East Asia Market Attractiveness by Platform , 2023 to 2033
Figure 276: East Asia Market Attractiveness by End User, 2023 to 2033
Figure 277: East Asia Market Attractiveness by Network Type, 2023 to 2033
Figure 278: East Asia Market Attractiveness by Chipset, 2023 to 2033
Figure 279: East Asia Market Attractiveness by Operational Frequency, 2023 to 2033
Figure 280: East Asia Market Attractiveness by Country, 2023 to 2033
Figure 281: Middle East and Africa Market Value (US$ Million) by Communication Infrastructure, 2023 to 2033
Figure 282: Middle East and Africa Market Value (US$ Million) by Core Network Technology, 2023 to 2033
Figure 283: Middle East and Africa Market Value (US$ Million) by Platform , 2023 to 2033
Figure 284: Middle East and Africa Market Value (US$ Million) by End User, 2023 to 2033
Figure 285: Middle East and Africa Market Value (US$ Million) by Network Type, 2023 to 2033
Figure 286: Middle East and Africa Market Value (US$ Million) by Chipset, 2023 to 2033
Figure 287: Middle East and Africa Market Value (US$ Million) by Operational Frequency, 2023 to 2033
Figure 288: Middle East and Africa Market Value (US$ Million) by Country, 2023 to 2033
Figure 289: Middle East and Africa Market Value (US$ Million) Analysis by Country, 2018 to 2033
Figure 290: Middle East and Africa Market Value Share (%) and BPS Analysis by Country, 2023 to 2033
Figure 291: Middle East and Africa Market Y-o-Y Growth (%) Projections by Country, 2023 to 2033
Figure 292: Middle East and Africa Market Value (US$ Million) Analysis by Communication Infrastructure, 2018 to 2033
Figure 293: Middle East and Africa Market Value Share (%) and BPS Analysis by Communication Infrastructure, 2023 to 2033
Figure 294: Middle East and Africa Market Y-o-Y Growth (%) Projections by Communication Infrastructure, 2023 to 2033
Figure 295: Middle East and Africa Market Value (US$ Million) Analysis by Core Network Technology, 2018 to 2033
Figure 296: Middle East and Africa Market Value Share (%) and BPS Analysis by Core Network Technology, 2023 to 2033
Figure 297: Middle East and Africa Market Y-o-Y Growth (%) Projections by Core Network Technology, 2023 to 2033
Figure 298: Middle East and Africa Market Value (US$ Million) Analysis by Platform , 2018 to 2033
Figure 299: Middle East and Africa Market Value Share (%) and BPS Analysis by Platform , 2023 to 2033
Figure 300: Middle East and Africa Market Y-o-Y Growth (%) Projections by Platform , 2023 to 2033
Figure 301: Middle East and Africa Market Value (US$ Million) Analysis by End User, 2018 to 2033
Figure 302: Middle East and Africa Market Value Share (%) and BPS Analysis by End User, 2023 to 2033
Figure 303: Middle East and Africa Market Y-o-Y Growth (%) Projections by End User, 2023 to 2033
Figure 304: Middle East and Africa Market Value (US$ Million) Analysis by Network Type, 2018 to 2033
Figure 305: Middle East and Africa Market Value Share (%) and BPS Analysis by Network Type, 2023 to 2033
Figure 306: Middle East and Africa Market Y-o-Y Growth (%) Projections by Network Type, 2023 to 2033
Figure 307: Middle East and Africa Market Value (US$ Million) Analysis by Chipset, 2018 to 2033
Figure 308: Middle East and Africa Market Value Share (%) and BPS Analysis by Chipset, 2023 to 2033
Figure 309: Middle East and Africa Market Y-o-Y Growth (%) Projections by Chipset, 2023 to 2033
Figure 310: Middle East and Africa Market Value (US$ Million) Analysis by Operational Frequency, 2018 to 2033
Figure 311: Middle East and Africa Market Value Share (%) and BPS Analysis by Operational Frequency, 2023 to 2033
Figure 312: Middle East and Africa Market Y-o-Y Growth (%) Projections by Operational Frequency, 2023 to 2033
Figure 313: Middle East and Africa Market Attractiveness by Communication Infrastructure, 2023 to 2033
Figure 314: Middle East and Africa Market Attractiveness by Core Network Technology, 2023 to 2033
Figure 315: Middle East and Africa Market Attractiveness by Platform , 2023 to 2033
Figure 316: Middle East and Africa Market Attractiveness by End User, 2023 to 2033
Figure 317: Middle East and Africa Market Attractiveness by Network Type, 2023 to 2033
Figure 318: Middle East and Africa Market Attractiveness by Chipset, 2023 to 2033
Figure 319: Middle East and Africa Market Attractiveness by Operational Frequency, 2023 to 2033
Figure 320: Middle East and Africa Market Attractiveness by Country, 2023 to 2033
During the projection period, the 5G in the defense market's CAGR is anticipated to be around 33.6%
North America and Asia Pacific are expected to dominate the 5G defense market.
Improved connections for communication, IoT integration, and real-time data analytics.
Remote control, real-time video streaming, and data sharing.
It facilitates the switch from antiquated communication systems to networks that are more adaptive.
Explore Similar Insights
Thank you!
You will receive an email from our Business Development Manager. Please be sure to check your SPAM/JUNK folder too.