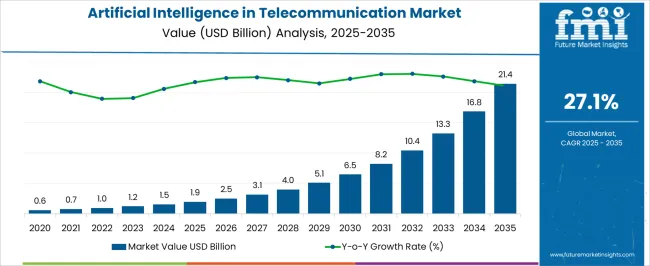
The Artificial Intelligence in Telecommunication Market is estimated to be valued at USD 1.9 billion in 2025 and is projected to reach USD 21.4 billion by 2035, registering a compound annual growth rate (CAGR) of 27.1% over the forecast period.

| Metric | Value |
|---|---|
| Artificial Intelligence in Telecommunication Market Estimated Value in (2025 E) | USD 1.9 billion |
| Artificial Intelligence in Telecommunication Market Forecast Value in (2035 F) | USD 21.4 billion |
| Forecast CAGR (2025 to 2035) | 27.1% |
The artificial intelligence in telecommunication market is expanding rapidly, driven by the increasing complexity of networks, the surge in data traffic, and the need for real-time decision-making. Telecom operators have been integrating AI technologies to optimize network performance, automate customer service functions, and strengthen security frameworks. Industry reports, corporate earnings calls, and technology announcements have highlighted significant investments in AI platforms designed for predictive analytics, network self-healing, and intelligent traffic routing.
Cloud providers and telecom vendors have formed strategic alliances, enabling scalable AI deployment across geographically dispersed infrastructures. Additionally, rising adoption of 5G technology has intensified the need for AI-powered solutions capable of managing dense network architectures and latency-sensitive applications.
Governments and regulatory bodies are also supporting digital transformation initiatives, which further accelerates AI adoption in telecom. Looking ahead, the market’s trajectory will be shaped by cloud-based deployments for scalability and cost efficiency, as well as the rising importance of AI in network security to address increasingly sophisticated cyber threats.

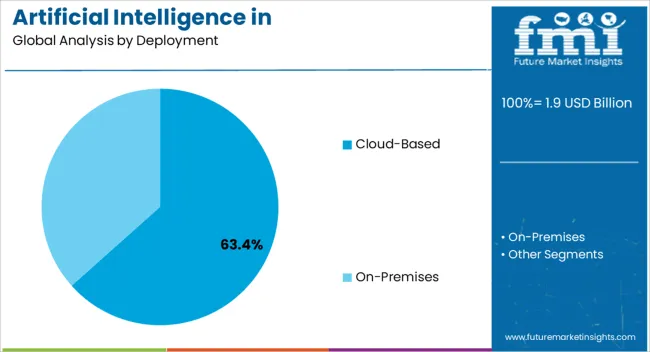
The Cloud-Based segment is projected to capture 63.40% of the artificial intelligence in telecommunication market revenue in 2025, maintaining its dominant position due to the scalability and flexibility it provides. Telecom operators have adopted cloud deployment to handle massive datasets generated from network operations, customer interactions, and IoT devices.
Cloud infrastructure enables AI models to be trained and updated continuously without the constraints of on-premise capacity, ensuring faster rollout of innovative services. Additionally, telecom providers have reduced capital expenditures by leveraging cloud services instead of investing in extensive physical infrastructure.
Industry updates have highlighted that hybrid and multi-cloud strategies are increasingly being employed to balance performance, regulatory compliance, and cost efficiency. Furthermore, global partnerships between telecom companies and cloud service providers have expanded AI accessibility across regions. These advantages have reinforced the leadership of the Cloud-Based segment, positioning it as the preferred choice for AI integration in telecom operations.

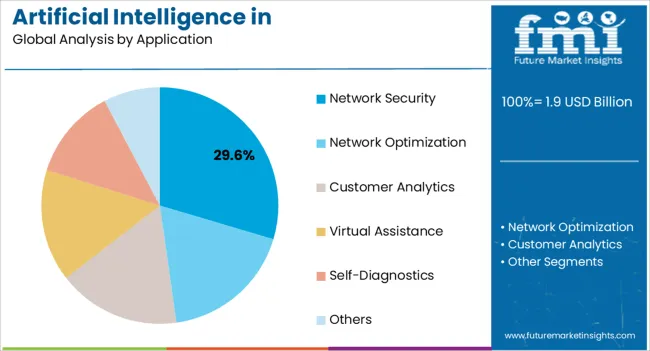
The Network Security segment is projected to account for 29.60% of the artificial intelligence in telecommunication market revenue in 2025, establishing itself as the leading application area. The growth of this segment has been fueled by escalating cyber threats targeting telecom networks, including ransomware, denial-of-service attacks, and identity theft.
AI technologies have been adopted for their ability to detect anomalies, predict vulnerabilities, and automate threat response in real time. Telecom operators have prioritized AI-enabled security solutions to safeguard sensitive customer data and maintain service continuity.
Press releases and security bulletins from telecom firms have reported increasing reliance on AI-driven security information and event management systems, capable of analyzing large-scale network traffic data with high precision. Regulatory requirements for data protection have also accelerated adoption, as telecom providers are mandated to comply with stringent cybersecurity frameworks. With cyber risks becoming more sophisticated, the integration of AI into network security is expected to remain a critical growth driver, ensuring the resilience and reliability of telecom infrastructures.
The customer analytics category is likely to have a significant market share with a valuation of USD 2,350 million by 2035 due to the increased demand for real-time behavioral insights.
Artificial intelligence enables operators to collect and evaluate consumer data from the perspective of subscriber intelligence. This information can then be used in a variety of circumstances, including adverts and personalized offers for the subscriber. Additionally, it can also be utilized by network operators to optimize network consumption.
The virtual assistance segment is predicted to expand notably at a CAGR of 25.5% during the forecast period as customer service automation generates significant savings for telecom firms. Customer service chatbots in the communication business can be effectively educated since machine learning algorithms can automate questions and send clients to the most appropriate person.
| Region/Country | North America |
|---|---|
| Key Growth Factors |
|
| Key Statistic | Projected to account for the second largest share with a value of USD 2,100 million by 2035. |
| Region/Country | Europe |
|---|---|
| Key Growth Factors |
|
| Key Statistic | Estimated to dominate artificial intelligence in the telecommunication market by 2035 with a CAGR of 26.5% from 2025 to 2035. |
| Region/Country | Middle East & Africa |
|---|---|
| Key Growth Factors |
|
| Key Statistic | Anticipated to be valued at USD 1.9 million and expanded at a significant CAGR of 32% from 2025 to 2035. |

The presence of active players in the artificial intelligence in telecommunication market makes it competitive. Further, market players are working on expanding their client base through various strategic initiatives such as partnerships, mergers and acquisitions, and collaborations. For example,
Startups in the artificial intelligence in the telecommunication market are conducting their own AI research to strengthen their business models. It is easy for telecom firms to make accurate decisions when using AI.
With the appropriate forecasts from AI systems, users can gain insight into their decisions before putting them into action in real life. Telecom firms can get an advantage over their competitors by utilizing AI's predictive skills. For example,
Recent Developments in the Artificial Intelligence in Telecommunication Market
| Report Attribute | Details |
|---|---|
| Base Year for Estimation | 2025 |
| Historical Data | 2020 to 2025 |
| Forecast Period | 2025 to 2035 |
| Artificial Intelligence in Telecommunication Market CAGR (2025 to 2035) | 28.5% |
| Artificial Intelligence in Telecommunication Market Value (2025) | USD 1,180.9 million |
| Artificial Intelligence in Telecommunication Market Value (2035) | USD 14,496 million |
| Quantitative Units | Revenue in USD million and CAGR from 2025 to 2035 |
| Report Coverage | Revenue Forecast, Volume Forecast, Company Ranking, Competitive Landscape, Growth Factors, Trends, and Pricing Analysis |
| Segments Covered | Deployment, Application, Region |
| Regions Covered | North America; Latin America; Western Europe; Eastern Europe; South Asia & Pacific; East Asia; The Middle East & Africa (MEA) |
| Key Countries Profiled | The United States, Canada, Brazil, Mexico, Germany, The United Kingdom, France, Spain, Italy, Poland, Russia, Czech Republic, Romania, India, Bangladesh, Australia, New Zealand, China, Japan, South Korea, GCC Countries, South Africa, Israel |
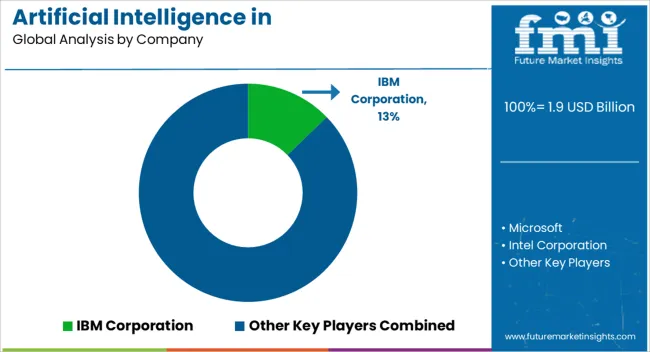
| Key Companies Covered | IBM Corporation; Microsoft; Intel Corporation; Google; AT&T Intellectual Property; Cisco Systems; Nuance Communications, Inc.; Evolv Technology Solutions, Inc.; H2O.ai; Infosys Limited; Salesforce.com, Inc.; NVIDIA Corporation |
| Customization | Available Upon Request |
The global artificial intelligence in telecommunication market is estimated to be valued at USD 1.9 billion in 2025.
The market size for the artificial intelligence in telecommunication market is projected to reach USD 21.4 billion by 2035.
The artificial intelligence in telecommunication market is expected to grow at a 27.1% CAGR between 2025 and 2035.
The key product types in artificial intelligence in telecommunication market are cloud-based and on-premises.
In terms of application, network security segment to command 29.6% share in the artificial intelligence in telecommunication market in 2025.


Full Research Suite comprises of:
Market outlook & trends analysis
Interviews & case studies
Strategic recommendations
Vendor profiles & capabilities analysis
5-year forecasts
8 regions and 60+ country-level data splits
Market segment data splits
12 months of continuous data updates
DELIVERED AS:
PDF EXCEL ONLINE
Artificial Tears Market Size and Share Forecast Outlook 2025 to 2035
Artificial Lift Systems Market Size and Share Forecast Outlook 2025 to 2035
Artificial Ventilation and Anaesthesia Masks Market Size and Share Forecast Outlook 2025 to 2035
Artificial Pancreas Device Market Size and Share Forecast Outlook 2025 to 2035
Artificial Flower Market Analysis by Growth, Trends and Forecast from 2025 to 2035
Artificial Preservative Market Outlook by Product, Type, Form, End Use Application and Others Through 2035
Analysis and Growth Projections for Artificial Sweetener Business
Artificial Turf Market Growth & Trends 2024-2034
Artificial Plants Market
Artificial Wood Beams Market
Artificial Airway Holders Market
Artificial Cartilage Implant Market
Artificial Insemination Market Size and Share Forecast Outlook 2025 to 2035
Artificial Intelligent Packaging Market Size and Share Forecast Outlook 2025 to 2035
Artificial Urinary Sphincter Market Size and Share Forecast Outlook 2025 to 2035
Artificial Bowling Surface Market
Artificial Hair Integration Market Growth - Trends & Forecast 2025 to 2035
Artificial Intelligence (chipset) Market Forecast and Outlook 2025 to 2035
Artificial Intelligence in Construction Market Size and Share Forecast Outlook 2025 to 2035
Artificial Intelligence in Retail Market Size and Share Forecast Outlook 2025 to 2035

Thank you!
You will receive an email from our Business Development Manager. Please be sure to check your SPAM/JUNK folder too.
Chat With
MaRIA