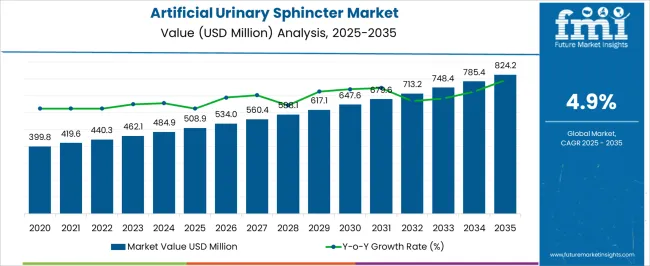
The Artificial Urinary Sphincter Market is estimated to be valued at USD 508.9 million in 2025 and is projected to reach USD 824.2 million by 2035, registering a compound annual growth rate (CAGR) of 4.9% over the forecast period.

| Metric | Value |
|---|---|
| Artificial Urinary Sphincter Market Estimated Value in (2025 E) | USD 508.9 million |
| Artificial Urinary Sphincter Market Forecast Value in (2035 F) | USD 824.2 million |
| Forecast CAGR (2025 to 2035) | 4.9% |
The Artificial Urinary Sphincter market is being driven by the growing need for effective solutions to manage urinary incontinence, particularly among aging populations and individuals recovering from prostate surgeries. The current market scenario reflects a steady increase in demand as medical institutions seek advanced therapeutic options that improve patient outcomes and enhance quality of life. The future outlook for this market is shaped by rising investments in healthcare infrastructure, expanding access to surgical treatments, and increasing awareness about urinary tract disorders.
Technological advancements in implantable devices, along with improvements in surgical procedures and post-operative care, are further supporting the adoption of artificial urinary sphincters. The growing prevalence of prostate cancer, coupled with the expanding geriatric population, is expected to fuel demand across various healthcare settings.
Additionally, the increasing focus on minimally invasive procedures and patient-centric care models is creating new opportunities for adoption The market is anticipated to experience sustained growth as healthcare providers increasingly seek reliable and long-lasting solutions to address urinary incontinence across diverse patient groups.

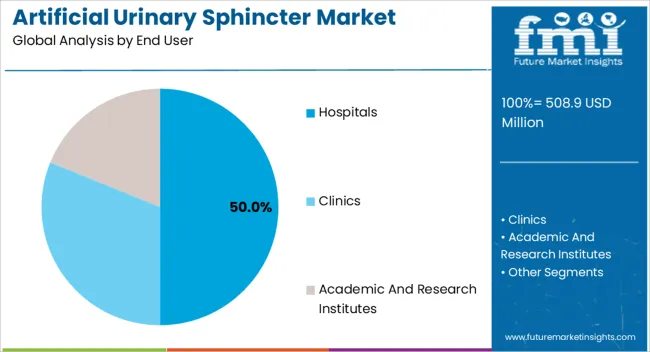
The hospitals end user segment is expected to account for 50.00% of the Artificial Urinary Sphincter market revenue in 2025, making it the largest segment in terms of usage. This dominance is being attributed to the high volume of surgical procedures performed in hospital settings, where specialized equipment, trained professionals, and advanced post-operative care are available. Hospitals are increasingly becoming the preferred setting for artificial urinary sphincter implantations due to the ability to provide comprehensive pre-surgical assessments and follow-up care.
The availability of multidisciplinary teams further supports the management of complex urinary incontinence cases, improving patient outcomes. The segment’s growth has been reinforced by the rising number of hospital admissions related to urological disorders and prostate surgeries, where the device is considered an effective intervention.
Additionally, hospitals are better positioned to adopt new medical technologies as part of treatment protocols, offering patients access to cutting-edge solutions As the demand for advanced care continues to rise, hospitals are expected to maintain their leading role in the artificial urinary sphincter market, supported by infrastructure development and a focus on patient safety and treatment effectiveness.
The artificial urinary sphincter (AUS) market witnessed significant growth between 2020 and 2025, driven by rising cases of urinary incontinence and the increasing adoption of minimally invasive surgical procedures. Additionally, technological advancements and product innovations further propelled market expansion.
From 2025 to 2035, the AUS market is anticipated to experience significant growth. Factors such as the aging population, growing awareness about urinary incontinence treatment options, and continuous advancements in healthcare technology are expected to accelerate market demand. Further, emerging economies and developing healthcare infrastructure may contribute to the market's expansion, making AUS a key focus area for medical device manufacturers and healthcare providers.
The AUS market is primarily driven by a few key factors such as the heavy reliance of patients on time-tested products and the increasing advancements in the artificial urinary sphincter, new product launches, and preference for safe and effective solutions by the patient group. In addition to this, the market observes significant growth due to increasing healthcare expenditure in developing countries.
The artificial urinary sphincter market is driven by the increasing incidence of urinary incontinence and the growth in the geriatric population across the globe. Moreover, the increasing number of prostate surgeries in men also leads to urinary incontinence resulting in one of the growth factors for the AUS market.
Numerous obstacles are likely to pose a challenge to market growth, although the artificial urinary sphincter (AUS) market has numerous end-uses. The main factor affecting the growth of the artificial urinary sphincter market is the high treatment costs of the artificial urinary sphincter which limit the usage of the artificial urinary sphincter in the healthcare industry.
The artificial urinary sphincter market is also associated with many risks regarding an injury to the urethra or bladder during the placement of the device which restricts the adoption among patients, device infection or persistent stress, and other side effects due to infections.
Recurrent cases of device failure have resulted in the loss of market share for manufacturers. Also, the factors such as stringent government regulations and the dearth of skilled professionals are expected to restrain market growth.
| Category | End User |
|---|---|
| Leading Segment | Hospitals |
| Market Share | 66.30% |
| Category | Gender |
|---|---|
| Leading Segment | Male |
| Market Share | 78.20% |
The global market has been categorized into hospitals, clinics, and Ambulatory Surgery Centers (ASCs) based on end-use. In 2025, the hospitals segment captured a significant share of the revenue. This can be attributed to the growing prevalence of urine incontinence and the increasing adoption of innovative treatment options. Further, the rise in hospital admissions for urine incontinence is a key driver of revenue growth in this segment.
Hospitals offer a wide range of treatment options, including surgical procedures, which contributes to the high demand for artificial urinary sphincters. Additionally, the presence of advanced medical facilities and access to skilled healthcare professionals are expected to boost revenue growth in the hospitals segment.
The clinics segment is projected to exhibit significant revenue growth during the forecast period. This growth is driven by the escalating prevalence of urine incontinence among the elderly population and the growing demand for minimally invasive treatment alternatives.
Patients often opt for outpatient procedures at clinics due to their affordability compared to hospitals. The clinics' accessibility to innovative diagnostic and therapeutic tools is expected to contribute to revenue growth.
The ASCs segment is anticipated to experience significantly notable revenue growth during the forecast period. This growth is primarily fueled by the increasing demand for same-day operations and the preference for outpatient procedures.
ASCs offer patients access to high-quality care in a comfortable environment, serving as a convenient alternative to hospitals and clinics. ASCs further provide cost-effective treatment options, which is expected to drive revenue growth in this segment.
| Countries | Market Share (2025) |
|---|---|
| North America | 34.8% |
| Europe | 25.8% |
North America was the significantly growing region for the artificial urinary sphincter industry. The trend is expected to continue into the forecast period owing to the development of many treatment facilities and rising investments in the healthcare sector. Moreover, North America is anticipated to account for a market share of 35% owing to an increase in the use of urinary incontinence devices by patients.
Factors such as an increase in the geriatric population, the presence of research & development programs, and high-class healthcare infrastructure are boosting demand in the urinary cystitis management market.
The market in North America is anticipated to be driven by an increasing number of market players researching urine incontinence, increasing awareness about the availability of surgical treatment for urological disorders, and the growing importance of surgical management of stress urinary incontinence.
The adoption of new approaches for sphincter placement has paved the way for new dimensions for surgical procedures. This is expected to boost the growth of the market.
| Countries | Market CAGR (From 2025 to 2035) |
|---|---|
| China | 6.3% |
| India | 5.2% |
| Australia | 4.6% |
| United Kingdom | 3.6% |

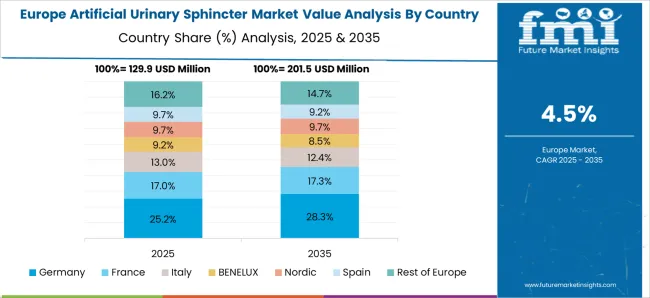
According to Future Market Insights, Europe accounts for a 26% share of the total global artificial urinary sphincter industry. The growth in Europe is attributed to growing allied industries in the region. An increase in government investments in the healthcare sector in emerging markets is expected to offer new opportunities during the analysis period.
The United Kingdom is predicted to make the most significant contribution to developing the regional market. This can be attributed to the presence of resources, the contribution of key players, and the ongoing development of the healthcare sector.
The factors which might fuel the growth of the artificial urinary sphincter market in the Asia Pacific are rising healthcare infrastructure and rapid development of the healthcare infrastructure across Asian countries. Further, the expansion of the regional market can be attributed to the increasing disposable income among developing countries such as India, China, and Japan.
There is an increase in the geriatric population and a growing number of healthcare centers such as hospitals offering treatment of urological conditions in the region. According to the Continence Foundation of Australia, nearly 5 million people in Australia experience bladder or bowel control problems. An increase in the number of urology care centers with technologically advanced surgical devices fuels the growth of the global artificial urinary sphincter market.
| Countries | Market Share - 2025 |
|---|---|
| The United States | 31.1% |
| Germany | 6.3% |
| Japan | 4.9% |

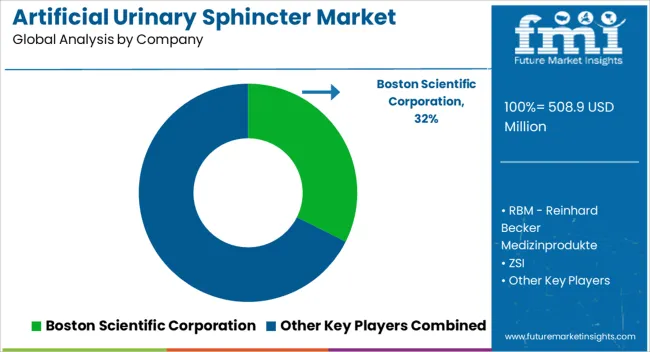
The competition in the artificial urinary sphincter (AUS) market is characterized by a moderate level of competition. Several key artificial urinary sphincter manufacturers dominate the market, including medical device manufacturers and healthcare companies. Further, these companies continually invest in research and development activities to improve their product offerings and gain a competitive edge.
The artificial urinary sphincter industry is driven by factors such as product efficacy, safety, durability, and affordability. To maintain their market position, companies also focus on strategic collaborations, mergers and acquisitions, and new product launches. Moreover, the artificial urinary sphincter business offers opportunities for new entrants with innovative technologies and approaches to challenge the established players and capture market share.
Key Players Operating in the Global Market
Latest Innovations:
| Company | ZSI |
|---|---|
| Strategy | Surgeons at French Hospital Foch Praise ZSI 100 D4 Penile Implant for Smooth Metoidioplasty Procedure |
| Details | ZSI reported that a metoidioplasty with penile implant ZSI 100 D4 was carried out by Drs. Madec and Vidart in the French hospital Foch in May 2024. Both surgeons are really happy with the implants, and the procedure went smoothly. |
| Company | Boston Scientific Corporation |
|---|---|
| Strategy | Boston Scientific's Strategic Move: Acquisition of Majority Stake in M.I.Tech Co., Ltd. |
| Details | The majority of M.I.Tech Co., Ltd., a publicly traded Korean manufacturer, and distributor of medical devices for endoscopic and urologic procedures, might be acquired by Boston Scientific Corporation. It was revealed in June 2025. |
The global artificial urinary sphincter market is estimated to be valued at USD 508.9 million in 2025.
The market size for the artificial urinary sphincter market is projected to reach USD 824.2 million by 2035.
The artificial urinary sphincter market is expected to grow at a 4.9% CAGR between 2025 and 2035.
The key product types in artificial urinary sphincter market are hospitals, clinics and academic and research institutes.
In terms of , segment to command 0.0% share in the artificial urinary sphincter market in 2025.


Our Research Products

The "Full Research Suite" delivers actionable market intel, deep dives on markets or technologies, so clients act faster, cut risk, and unlock growth.

The Leaderboard benchmarks and ranks top vendors, classifying them as Established Leaders, Leading Challengers, or Disruptors & Challengers.

Locates where complements amplify value and substitutes erode it, forecasting net impact by horizon

We deliver granular, decision-grade intel: market sizing, 5-year forecasts, pricing, adoption, usage, revenue, and operational KPIs—plus competitor tracking, regulation, and value chains—across 60 countries broadly.

Spot the shifts before they hit your P&L. We track inflection points, adoption curves, pricing moves, and ecosystem plays to show where demand is heading, why it is changing, and what to do next across high-growth markets and disruptive tech

Real-time reads of user behavior. We track shifting priorities, perceptions of today’s and next-gen services, and provider experience, then pace how fast tech moves from trial to adoption, blending buyer, consumer, and channel inputs with social signals (#WhySwitch, #UX).

Partner with our analyst team to build a custom report designed around your business priorities. From analysing market trends to assessing competitors or crafting bespoke datasets, we tailor insights to your needs.
Supplier Intelligence
Discovery & Profiling
Capacity & Footprint
Performance & Risk
Compliance & Governance
Commercial Readiness
Who Supplies Whom
Scorecards & Shortlists
Playbooks & Docs
Category Intelligence
Definition & Scope
Demand & Use Cases
Cost Drivers
Market Structure
Supply Chain Map
Trade & Policy
Operating Norms
Deliverables
Buyer Intelligence
Account Basics
Spend & Scope
Procurement Model
Vendor Requirements
Terms & Policies
Entry Strategy
Pain Points & Triggers
Outputs
Pricing Analysis
Benchmarks
Trends
Should-Cost
Indexation
Landed Cost
Commercial Terms
Deliverables
Brand Analysis
Positioning & Value Prop
Share & Presence
Customer Evidence
Go-to-Market
Digital & Reputation
Compliance & Trust
KPIs & Gaps
Outputs
Full Research Suite comprises of:
Market outlook & trends analysis
Interviews & case studies
Strategic recommendations
Vendor profiles & capabilities analysis
5-year forecasts
8 regions and 60+ country-level data splits
Market segment data splits
12 months of continuous data updates
DELIVERED AS:
PDF EXCEL ONLINE
Artificial Ear Simulator Market Size and Share Forecast Outlook 2025 to 2035
Artificial Intelligence (chipset) Market Forecast and Outlook 2025 to 2035
Artificial Insemination Market Size and Share Forecast Outlook 2025 to 2035
Artificial Intelligence in Construction Market Size and Share Forecast Outlook 2025 to 2035
Artificial Tears Market Size and Share Forecast Outlook 2025 to 2035
Artificial Intelligence in Telecommunication Market Size and Share Forecast Outlook 2025 to 2035
Artificial Lift Systems Market Size and Share Forecast Outlook 2025 to 2035
Artificial Intelligence in Retail Market Size and Share Forecast Outlook 2025 to 2035
Artificial Intelligence (AI) in Automotive Market Size and Share Forecast Outlook 2025 to 2035
Artificial Intelligent Packaging Market Size and Share Forecast Outlook 2025 to 2035
Artificial Intelligence in Healthcare Market Size, Growth, and Forecast for 2025 to 2035
Urinary Tract Infection (UTI) Treatment Market (UTI) Analysis - Size, Share, and Forecast 2025 to 2035
Urinary Collection Device Market Size and Share Forecast Outlook 2025 to 2035
Artificial Ventilation and Anaesthesia Masks Market Size and Share Forecast Outlook 2025 to 2035
Artificial Intelligence In Cybersecurity Market Size and Share Forecast Outlook 2025 to 2035
Urinary Bag Market - Trends & Forecast 2025 to 2035
Artificial Pancreas Device Market Size and Share Forecast Outlook 2025 to 2035
Urinary Tract Infection Testing Market Analysis – Size, Share, & Forecast Outlook 2025 to 2035
Artificial Flower Market Analysis by Growth, Trends and Forecast from 2025 to 2035
Urinary Antibacterial & Antiseptic Pharmaceuticals Market Analysis – Forecast 2025 to 2035

Thank you!
You will receive an email from our Business Development Manager. Please be sure to check your SPAM/JUNK folder too.
Chat With
MaRIA