Pharmaceutical Sterility Testing Market
Market Survey on Pharmaceutical Sterility Testing Market Covering Sales Outlook, Up-to-date Key Trends, Market Size and Forecast, Per Capita Expenditure, Company Share, Brand Share, Regulations, Reimbursement Scenario, Epidemiology, Procedure Numbers, and Pipeline Assessment
An In-depth Market Insights of Pharmaceutical Sterility Testing Market including Kits and Reagents, and Instruments Covering 30+ Countries like United States, United Kingdom, Germany, France, Norway, Sweden, Saudi Arabia, United Arab Emirates, Japan, Korea, Australia, New Zealand, and Others
Pharmaceutical Sterility Testing Market Outlook (2023 to 2033)
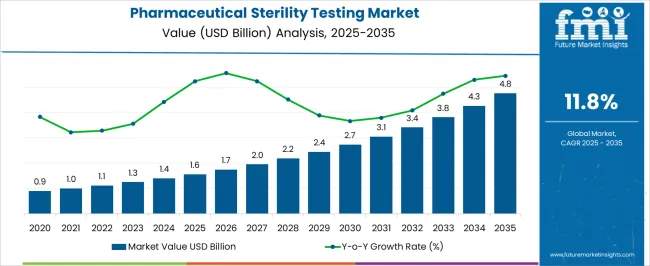
The pharmaceutical sterility testing market is anticipated to be generated global sales revenue of US$ 1,250.7 million in 2023. Demand is expected to develop at a CAGR of 11.8% to reach a valuation of US$ 3,815.6 million by 2033.
Sterility testing applications are endless in the pharmaceutical, biotech, and medical device industries. The need for sterility testing in pharmaceuticals is greatly increasing since it covers the important stage of investigating the quality of raw materials, as well as process control and validation of finished products.
The pharmaceutical and biopharmaceutical production business experienced increasing demand for sterility testing. This is due to the severity and high infection rate of diseases, as well as the growing number of medications and vaccines. As a result, there is now a huge requirement for rigorous sterility of the items.
Rising drug launches and life sciences research and development prove to be driving factors for the industry. The demand for pharmaceutical sterility testing is also predicted to increase due to the rising need for sterilized goods internationally, as well as a few potential product safety concerns.
Attributes |
Details |
Expected Market CAGR (2023 to 2033) |
11.8% |
Expected Market Size (2023) |
US$ 1,250.7 million |
Expected Market Size (2033) |
US$ 3,815.6 million |
Don't pay for what you don't need
Customize your report by selecting specific countries or regions and save 30%!
Pharmaceutical Sterility Testing Adoption Analysis (2018 to 2022) vs Market Outlook (2023 to 2033)
The background of the market is quite promising, and numbers are likely to increase during the research period. A number of developing nations have sped up the launch of new medicines in order to meet the world's rising need for healthcare. By doing this, the scope for CAGR increases from 9.8% (2018 to 2022) to 11.8% by 2033. As a result of the rising prevalence of chronic and infectious diseases, there is an increasing demand for pharmaceuticals on a global scale. For instance,
- The WHO (World Health Organization) announced in February 2021 that cardiovascular diseases remain one of the leading causes of mortality worldwide, killing 17.9 million people a year.
Future illness load is anticipated to increase demand for pharmaceuticals, supporting the need for pharmaceutical sterility testing. Due to this, the global market had the potential to thrive. In 2018, the market was valued at US$ 773.7 million, and by 2022, it reached US$ 1,124.7 million.
The regulatory changes have significantly improved the likelihood of widespread adoption. Drugs like Elagolix and Lanadelumab, whose debut is considerably assisting the market's growth, are biopharmaceutical products that require special sterility testing. Given all of these influences, the market is probably anticipating a 1.1x growth between 2022 and 2023.
How Does Sterility Testing for Pharmaceutical Products Find Its Way to Market Profits?
- The need for various types of sterility testing is driving the growth of the entire industry. These sterility testing types include sterility testing medical devices, b/f testing sterility, hypothesis testing, sgs sterility testing, VHP(Vaporized Hydrogen Peroxide) Ingress Testing, etc.,
- High levels of consolidation, strict regulatory environments, and drawn-out licensing procedures all pose serious obstacles for new market entrants. However, this can be resolved as many businesses enter the kit testing market, which offers a consistent flow of client revenue.
Comparative View of the Adjacent Market
Pharmaceutical Sterility Testing Market:
Attributes |
Pharmaceutical Sterility Testing Market |
CAGR (2023 to 2033) |
11.8% |
Market Value (2033) |
US$ 3,815.6 million |
Growth Factor |
Increasing prevalence of infectious disease |
Opportunity |
Favorable regulatory changes |
Trends |
Rising research and development in life sciences |
Cystatin C Testing Market:
Attributes |
Cystatin C Testing Market |
CAGR (2023 to 2033) |
7.5% |
Market Value (2033) |
US$ 372.47 million |
Growth Factor |
Rising number of research labs, hospitals, and diagnostic centers |
Opportunity |
Increased government investment in the market |
Trends |
Rising disposable income with health awareness |
Pharmaceutical Dissolution Testing Market:
Attributes |
Pharmaceutical Dissolution Testing Market |
CAGR (2023 to 2033) |
8.3% |
Market Value (2033) |
US$ 1,538.48 million |
Growth Factor |
Improvement in healthcare systems |
Opportunity |
Profitable developments in the in-vitro testing dissolution assays |
Trends |
Increasing efforts and awareness about healthcare products |
Regional Analysis
In 2022, it is anticipated that North America accounted for 39% of the global pharmaceutical sterility testing market. The existence of numerous international and domestic competitors in the area is responsible for the region's rise.
During the forecast period, a huge amount of money is likely to be spent on research and development to support the growth of North America market. The biopharmaceutical business has a substantial total economic impact on the economy of America.
What Benefits the Key Players in the United States Market?
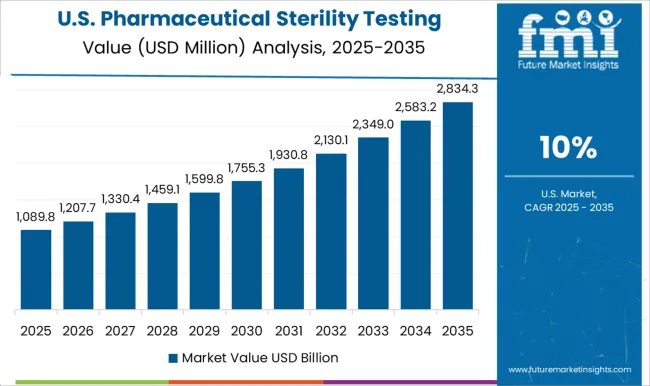
The United States held a dominant market share of 41.5% in 2022. This is due to the factors such as:
- Presence of numerous international pharmaceutical and biopharmaceutical businesses.
- Significant financing from both the public and commercial sectors in the nation.
For instance, PreHevbrio was introduced by VBI Vaccines Inc. in March 2022 for the treatment of persons aged 18 years old. It is for those who are at risk of contracting any of the recognized subtypes of the hepatitis B virus (HBV). In November 2021, the FDA authorized this vaccine as the exclusive adult 3-antigen HBV vaccine. Consequently, Canada spent US$ 23,400 million internally on pharmaceutical research and development in 2021, and it reached US$ 23,800 million in 2022, a 1.7% increase.
Pharmaceutical Sterility Testing in China Market Focus on Compiling with the Standards
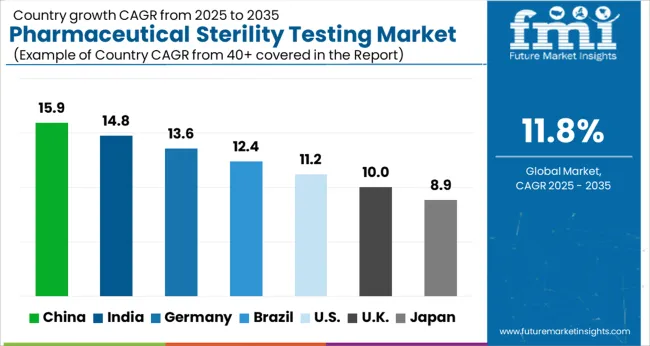
By 2033, China is anticipated to hold a significant rank in the pharmaceutical sterility testing sector, with a CAGR of 12.1%. This is a result of emerging countries increasingly harmonizing their regulatory norms with ICH standards. Additionally, the region's emerging economies are taking a variety of steps to expand their domestic pharmaceutical market and are enticing multinational corporations to establish operations there.
Contract research organizations (CROs) are anticipated to expand significantly over the next few years. Sterile testing services are significantly being outsourced to CROs because of the benefits they provide including flexibility, cost-effectiveness, and access to specialist knowledge. The primary end-users of sterility testing services in the nation are anticipated to be the biopharmaceutical industry and CROs.
Research and Development Creates a Sizable Market in India
India is prepared to manufacture medical devices and conduct extensive sterility testing due to substantial pharmaceutical investment. By 2033, India is projected to have a 12.8% CAGR.
According to the Union Budget for the years 2021 to 2022, the Indian Ministry of Science and Technology allocated US$ 430 million, a 25% increase from the budget for the years 2020 to 2021, for the DBT (Department of Biotechnology). This is primarily for biotechnology research and development, as well as industrial and entrepreneurship development in the nation. This budget sets new goals for India pharmaceutical sterility testing market. In accordance with the analysis, the Indian biotechnology market was estimated to be worth US$ 70,200 million in 2020; by 2025, it is anticipated to be worth US$ 150,000 million.
Automated Techniques Lead the Market in Germany
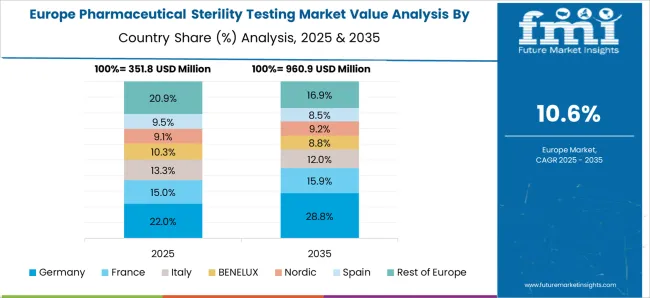
In Germany, automated methods rule the market. The market was initially growing, with a share of 6.2% in 2022, and by 2033, it is projected to have a wide scope. Automated systems that contribute effectively to the global industry include the BacT/ALERT system. These techniques are made to be highly sensitive and specific in identifying the presence of microorganisms in pharmaceutical items.
Germany has a stringent regulatory framework that is overseen by the European Pharmacopoeia (Ph. Eur.) and the German Medicines Act (AMG). All pharmaceutical products that are intended for infusion, implantation, or injection into the human body must pass sterility testing. This testing is essential to make sure the product is devoid of living microorganisms like bacteria, viruses, and fungi that possibly infect people or create other adverse effects.
Get the data you need at a Fraction of the cost
Personalize your report by choosing insights you need
and save 40%!
Category Analysis
Category | Product Type |
Top-segment | Kits & Reagents |
Market Share (2022) | 39.7% |
Category | Services |
Top-segment | Outsourced |
Market Share (2022) | 54.1% |
Category | Test type |
Top-segment | Bacterial endotoxin testing |
Market Share (2022) | 38.4% |
Which Services are Popular in the Pharmaceutical Sterility Testing Industry?
- By accounting for 54.1% of the market in 2022, the outsourcing segment had the top share.
- Small and medium-sized manufacturers of pharmaceuticals and medical devices do not always have the resources to undertake reliable sterility testing. Thus, they are likely to rather outsource these services to meet FDA standards.
- Outsourcing helps pharmaceutical and medical device companies save time and money, as they don't have to find and train new employees or buy new equipment.
- Pharmaceutical sterility testing services are gradually being outsourced by large pharmaceutical companies as they attempt to concentrate on their core capabilities, such as marketing. These elements have had a key role in the segment's growth.
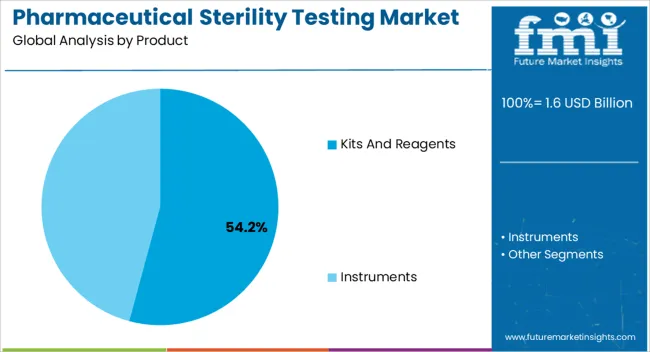
Kits and Reagents: Top Segment based on Product Type
Through 2033, the kits and reagents market is predicted to experience significant growth. The availability of a variety of items that aid in reducing the danger of false negative and false positive results is credited with this increase. These also consist of sterility testing pumps, which are easily integrated into any testing environment, streamline workflow, and help to maximize safety.
Over the anticipated period, segmental growth is expected to be boosted by the rising demand for comparable products.
Which Testing Type Gives Accurate Results?
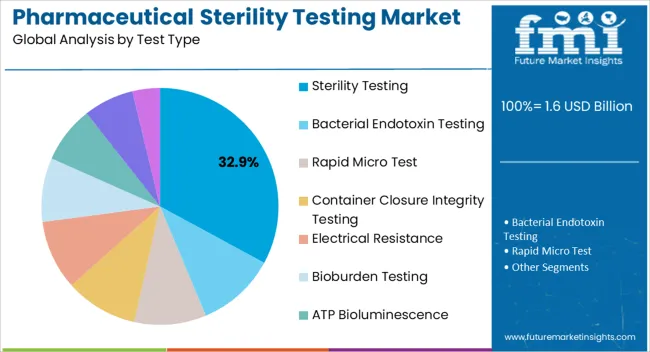
In 2022, the segment for bacterial endotoxin testing held the leading market share with 38.4%. These tests are used to evaluate medical equipment like implants. The market for this category is expanding as a result of rising parenteral medication and implant demand. Along with an increase in the number of drug and medical device launches, there is a growing emphasis on product quality.
Competitive Landscape
How do Pharmaceutical Sterility Testing Manufacturers Expand in the Market?
The demand for pharmaceutical sterility testing is projected to increase along with medical improvements, and producers can profit from these technological developments.
The growth of the biotechnology sector offers businesses a lot of room for future advancements.
Concerns like the safety of biological pharmaceuticals are surging. New technological advancements in the area of sterility testing have improved the procedure's efficiency, allowing manufacturers to introduce new products in the market.
Regulatory Scrutiny: Bane or Boon for Key Players in the Pharmaceutical Sterility Testing Market
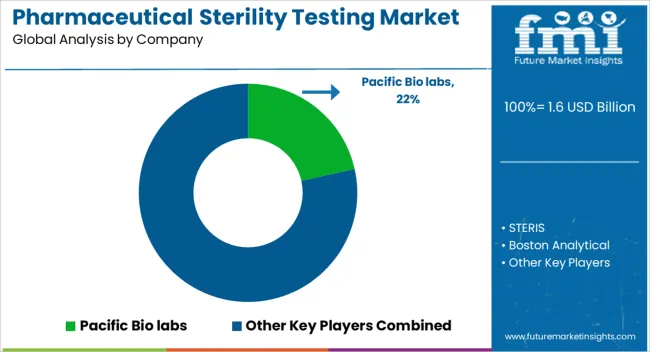
The market is highly fragmented due to the presence of multiple local and MNC contract service providers and research facilities. The main strategies employed by the bulk of these organizations include regional growth and digitalization of service delivery for sterility testing. Companies in the sector are subject to intense regulatory scrutiny and must abide by rules relating to the security of pharmaceutical products. As a result, specialized consulting companies have emerged. These companies offer services related to pharmaceutical sterility testing that are related to regulatory compliance and quality assurance.
Recent Developments:
- In June 2022, Lee, Massachusetts-based fill-finish CMO Berkshire Sterile Manufacturing (BSM) declared that its sterility testing isolator was prepared to conduct on-site sterility testing for its GMP batches. Most of the clients of the business, if not all of them, should see a short release due to the new service.
- The establishment of a newly expanded center of excellence for microbiological laboratory testing and improved sterilizing capacity in Nelson Labs' and Sterigenics Deutschland GmbHs Wiesbaden, Germany, facilities were both announced for September 2021.
- The EndoScan-V software platform for endotoxin testing and the Celsis automated detection system for assessing the fast sterility of pharmaceutical pharmaceuticals were both introduced by Charles River Laboratories in September 2019.
Key Players Operating in the Pharmaceutical Sterility Testing Market
- Merck KGaA
- bioMerieux SA
- Thermo Fisher Scientific Inc.
- Charles River Laboratories International Inc.
- Others
Key Segments
By Product:
- Kits and Reagents
- Instruments
By Application:
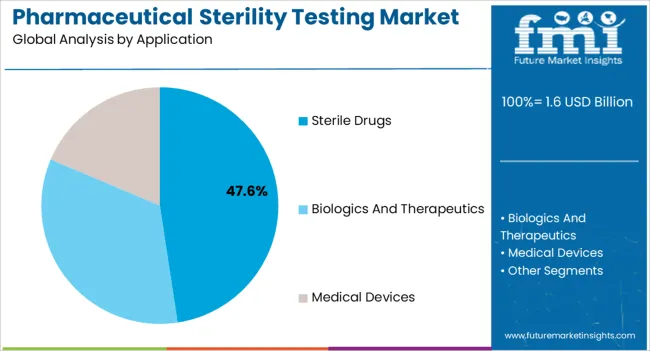
- Sterile Drugs
- Biologics and Therapeutics
- Medical Devices
By Test Type:
- Sterility Testing
- Membrane Filtration
- Direct Inoculation
- Bacterial Endotoxin Testing
- Rapid Micro Test
- Container Closure Integrity Testing
- Electrical Resistance
- Bioburden Testing
- ATP Bioluminescence
- Fluorescent Labeling
- Others
By Services:
- In-House
- Outsourced
By End Use:
- Compounding Pharmacies
- Medical Devices Companies
- Pharmaceutical Companies
By Region:
- North America
- Latin America
- Europe
- East Asia
- South Asia
- Oceania
- The Middle East & Africa (MEA)
Frequently Asked Questions
How Big is the Pharmaceutical Sterility Testing Market?
The market is valued at US$ 1,250.7 million in 2023.
Who are the Key Pharmaceutical Sterility Testing Market Players?
SGS SA, Toxikon, Inc., and Pace Analytical Services are key market players.
Which are the Key Asian Countries in the Pharmaceutical Sterility Testing Market?
India, Japan, and China dominate the Asian market.
How Big Will the Pharmaceutical Sterility Testing Market by 2033?
The market is estimated to reach US$ 3,815.6 million by 2033.
Which Region holds high Lucrativeness?
Asia-Pacific is projected to emerge as a lucrative market.
Table of Content
1. Executive Summary | Pharmaceutical Sterility Testing Market 1.1. Global Market Outlook 1.2. Demand-side Trends 1.3. Supply-side Trends 1.4. Technology Roadmap Analysis 1.5. Analysis and Recommendations 2. Market Overview 2.1. Market Coverage / Taxonomy 2.2. Market Definition / Scope / Limitations 3. Market Background 3.1. Market Dynamics 3.1.1. Drivers 3.1.2. Restraints 3.1.3. Opportunity 3.1.4. Trends 3.2. Scenario Forecast 3.2.1. Demand in Optimistic Scenario 3.2.2. Demand in Likely Scenario 3.2.3. Demand in Conservative Scenario 3.3. Opportunity Map Analysis 3.4. Product Life Cycle Analysis 3.5. Supply Chain Analysis 3.5.1. Supply Side Participants and their Roles 3.5.1.1. Producers 3.5.1.2. Mid-Level Participants (Traders/ Agents/ Brokers) 3.5.1.3. Wholesalers and Distributors 3.5.2. Value Added and Value Created at Node in the Supply Chain 3.5.3. List of Raw Material Suppliers 3.5.4. List of Existing and Potential Buyer’s 3.6. Investment Feasibility Matrix 3.7. Value Chain Analysis 3.7.1. Profit Margin Analysis 3.7.2. Wholesalers and Distributors 3.7.3. Retailers 3.8. PESTLE and Porter’s Analysis 3.9. Regulatory Landscape 3.9.1. By Key Regions 3.9.2. By Key Countries 3.10. Regional Parent Market Outlook 3.11. Production and Consumption Statistics 3.12. Import and Export Statistics 4. Global Market Analysis 2018 to 2022 and Forecast, 2023 to 2033 4.1. Historical Market Size Value (US$ Million) & Volume (Units) Analysis, 2018 to 2022 4.2. Current and Future Market Size Value (US$ Million) & Volume (Units) Projections, 2023 to 2033 4.2.1. Y-o-Y Growth Trend Analysis 4.2.2. Absolute $ Opportunity Analysis 5. Global Market Analysis 2018 to 2022 and Forecast 2023 to 2033, By Product 5.1. Introduction / Key Findings 5.2. Historical Market Size Value (US$ Million) & Volume (Units) Analysis By Product, 2018 to 2022 5.3. Current and Future Market Size Value (US$ Million) & Volume (Units) Analysis and Forecast By Product, 2023 to 2033 5.3.1. Kits and Reagents 5.3.2. Instruments 5.3.3. Services 5.4. Y-o-Y Growth Trend Analysis By Product, 2018 to 2022 5.5. Absolute $ Opportunity Analysis By Product, 2023 to 2033 6. Global Market Analysis 2018 to 2022 and Forecast 2023 to 2033, By Application 6.1. Introduction / Key Findings 6.2. Historical Market Size Value (US$ Million) & Volume (Units) Analysis By Application, 2018 to 2022 6.3. Current and Future Market Size Value (US$ Million) & Volume (Units) Analysis and Forecast By Application, 2023 to 2033 6.3.1. Sterile Drugs 6.3.2. Medical Devices 6.3.3. Biologics 6.3.4. Therapeutics 6.4. Y-o-Y Growth Trend Analysis By Application, 2018 to 2022 6.5. Absolute $ Opportunity Analysis By Application, 2023 to 2033 7. Global Market Analysis 2018 to 2022 and Forecast 2023 to 2033, By Test Type 7.1. Introduction / Key Findings 7.2. Historical Market Size Value (US$ Million) & Volume (Units) Analysis By Test Type, 2018 to 2022 7.3. Current and Future Market Size Value (US$ Million) & Volume (Units) Analysis and Forecast By Test Type, 2023 to 2033 7.3.1. Sterility Testing 7.3.1.1. Membrane Filtration 7.3.1.2. Direct Inoculation 7.3.2. Bioburden Testing 7.3.3. Bacterial Endotoxin Testing 7.3.4. Container Closure Integrity Testing 7.3.5. Rapid Micro Test 7.3.5.1. ATP Bioluminescence 7.3.5.2. Fluorescent Labeling 7.3.5.3. Electrical Resistance 7.3.6. others 7.4. Y-o-Y Growth Trend Analysis By Test Type, 2018 to 2022 7.5. Absolute $ Opportunity Analysis By Test Type, 2023 to 2033 8. Global Market Analysis 2018 to 2022 and Forecast 2023 to 2033, By Manufacturing 8.1. Introduction / Key Findings 8.2. Historical Market Size Value (US$ Million) & Volume (Units) Analysis By Manufacturing, 2018 to 2022 8.3. Current and Future Market Size Value (US$ Million) & Volume (Units) Analysis and Forecast By Manufacturing, 2023 to 2033 8.3.1. In-House 8.3.2. Outsourced 8.4. Y-o-Y Growth Trend Analysis By Manufacturing, 2018 to 2022 8.5. Absolute $ Opportunity Analysis By Manufacturing, 2023 to 2033 9. Global Market Analysis 2018 to 2022 and Forecast 2023 to 2033, By End Use 9.1. Introduction / Key Findings 9.2. Historical Market Size Value (US$ Million) & Volume (Units) Analysis By End Use, 2018 to 2022 9.3. Current and Future Market Size Value (US$ Million) & Volume (Units) Analysis and Forecast By End Use, 2023 to 2033 9.3.1. Compounding Pharmacies 9.3.2. Medical Devices Companies 9.3.3. Pharmaceutical Companies 9.4. Y-o-Y Growth Trend Analysis By End Use, 2018 to 2022 9.5. Absolute $ Opportunity Analysis By End Use, 2023 to 2033 10. Global Market Analysis 2018 to 2022 and Forecast 2023 to 2033, By Region 10.1. Introduction 10.2. Historical Market Size Value (US$ Million) & Volume (Units) Analysis By Region, 2018 to 2022 10.3. Current Market Size Value (US$ Million) & Volume (Units) Analysis and Forecast By Region, 2023 to 2033 10.3.1. North America 10.3.2. Latin America 10.3.3. Europe 10.3.4. Asia Pacific 10.3.5. MEA 10.4. Market Attractiveness Analysis By Region 11. North America Global Market Analysis 2018 to 2022 and Forecast 2023 to 2033, By Country 11.1. Historical Market Size Value (US$ Million) & Volume (Units) Trend Analysis By Market Taxonomy, 2018 to 2022 11.2. Market Size Value (US$ Million) & Volume (Units) Forecast By Market Taxonomy, 2023 to 2033 11.2.1. By Country 11.2.1.1. United States of America 11.2.1.2. Canada 11.2.2. By Product 11.2.3. By Application 11.2.4. By Test Type 11.2.5. By Manufacturing 11.2.6. By End Use 11.3. Market Attractiveness Analysis 11.3.1. By Country 11.3.2. By Product 11.3.3. By Application 11.3.4. By Test Type 11.3.5. By Manufacturing 11.3.6. By End Use 11.4. Key Takeaways 12. Latin America Global Market Analysis 2018 to 2022 and Forecast 2023 to 2033, By Country 12.1. Historical Market Size Value (US$ Million) & Volume (Units) Trend Analysis By Market Taxonomy, 2018 to 2022 12.2. Market Size Value (US$ Million) & Volume (Units) Forecast By Market Taxonomy, 2023 to 2033 12.2.1. By Country 12.2.1.1. Brazil 12.2.1.2. Mexico 12.2.1.3. Rest of Latin America 12.2.2. By Product 12.2.3. By Application 12.2.4. By Test Type 12.2.5. By Manufacturing 12.2.6. By End Use 12.3. Market Attractiveness Analysis 12.3.1. By Country 12.3.2. By Product 12.3.3. By Application 12.3.4. By Test Type 12.3.5. By Manufacturing 12.3.6. By End Use 12.4. Key Takeaways 13. Europe Global Market Analysis 2018 to 2022 and Forecast 2023 to 2033, By Country 13.1. Historical Market Size Value (US$ Million) & Volume (Units) Trend Analysis By Market Taxonomy, 2018 to 2022 13.2. Market Size Value (US$ Million) & Volume (Units) Forecast By Market Taxonomy, 2023 to 2033 13.2.1. By Country 13.2.1.1. Germany 13.2.1.2. United Kingdom 13.2.1.3. France 13.2.1.4. Spain 13.2.1.5. Italy 13.2.1.6. Rest of Europe 13.2.2. By Product 13.2.3. By Application 13.2.4. By Test Type 13.2.5. By Manufacturing 13.2.6. By End Use 13.3. Market Attractiveness Analysis 13.3.1. By Country 13.3.2. By Product 13.3.3. By Application 13.3.4. By Test Type 13.3.5. By Manufacturing 13.3.6. By End Use 13.4. Key Takeaways 14. Asia Pacific Global Market Analysis 2018 to 2022 and Forecast 2023 to 2033, By Country 14.1. Historical Market Size Value (US$ Million) & Volume (Units) Trend Analysis By Market Taxonomy, 2018 to 2022 14.2. Market Size Value (US$ Million) & Volume (Units) Forecast By Market Taxonomy, 2023 to 2033 14.2.1. By Country 14.2.1.1. China 14.2.1.2. Japan 14.2.1.3. South Korea 14.2.1.4. Singapore 14.2.1.5. Thailand 14.2.1.6. Indonesia 14.2.1.7. Australia 14.2.1.8. New Zealand 14.2.1.9. Rest of Asia Pacific 14.2.2. By Product 14.2.3. By Application 14.2.4. By Test Type 14.2.5. By Manufacturing 14.2.6. By End Use 14.3. Market Attractiveness Analysis 14.3.1. By Country 14.3.2. By Product 14.3.3. By Application 14.3.4. By Test Type 14.3.5. By Manufacturing 14.3.6. By End Use 14.4. Key Takeaways 15. MEA Global Market Analysis 2018 to 2022 and Forecast 2023 to 2033, By Country 15.1. Historical Market Size Value (US$ Million) & Volume (Units) Trend Analysis By Market Taxonomy, 2018 to 2022 15.2. Market Size Value (US$ Million) & Volume (Units) Forecast By Market Taxonomy, 2023 to 2033 15.2.1. By Country 15.2.1.1. GCC Countries 15.2.1.2. South Africa 15.2.1.3. Israel 15.2.1.4. Rest of MEA 15.2.2. By Product 15.2.3. By Application 15.2.4. By Test Type 15.2.5. By Manufacturing 15.2.6. By End Use 15.3. Market Attractiveness Analysis 15.3.1. By Country 15.3.2. By Product 15.3.3. By Application 15.3.4. By Test Type 15.3.5. By Manufacturing 15.3.6. By End Use 15.4. Key Takeaways 16. Key Countries Global Market Analysis 16.1. United States of America 16.1.1. Pricing Analysis 16.1.2. Market Share Analysis, 2022 16.1.2.1. By Product 16.1.2.2. By Application 16.1.2.3. By Test Type 16.1.2.4. By Manufacturing 16.1.2.5. By End Use 16.2. Canada 16.2.1. Pricing Analysis 16.2.2. Market Share Analysis, 2022 16.2.2.1. By Product 16.2.2.2. By Application 16.2.2.3. By Test Type 16.2.2.4. By Manufacturing 16.2.2.5. By End Use 16.3. Brazil 16.3.1. Pricing Analysis 16.3.2. Market Share Analysis, 2022 16.3.2.1. By Product 16.3.2.2. By Application 16.3.2.3. By Test Type 16.3.2.4. By Manufacturing 16.3.2.5. By End Use 16.4. Mexico 16.4.1. Pricing Analysis 16.4.2. Market Share Analysis, 2022 16.4.2.1. By Product 16.4.2.2. By Application 16.4.2.3. By Test Type 16.4.2.4. By Manufacturing 16.4.2.5. By End Use 16.5. Germany 16.5.1. Pricing Analysis 16.5.2. Market Share Analysis, 2022 16.5.2.1. By Product 16.5.2.2. By Application 16.5.2.3. By Test Type 16.5.2.4. By Manufacturing 16.5.2.5. By End Use 16.6. United Kingdom 16.6.1. Pricing Analysis 16.6.2. Market Share Analysis, 2022 16.6.2.1. By Product 16.6.2.2. By Application 16.6.2.3. By Test Type 16.6.2.4. By Manufacturing 16.6.2.5. By End Use 16.7. France 16.7.1. Pricing Analysis 16.7.2. Market Share Analysis, 2022 16.7.2.1. By Product 16.7.2.2. By Application 16.7.2.3. By Test Type 16.7.2.4. By Manufacturing 16.7.2.5. By End Use 16.8. Spain 16.8.1. Pricing Analysis 16.8.2. Market Share Analysis, 2022 16.8.2.1. By Product 16.8.2.2. By Application 16.8.2.3. By Test Type 16.8.2.4. By Manufacturing 16.8.2.5. By End Use 16.9. Italy 16.9.1. Pricing Analysis 16.9.2. Market Share Analysis, 2022 16.9.2.1. By Product 16.9.2.2. By Application 16.9.2.3. By Test Type 16.9.2.4. By Manufacturing 16.9.2.5. By End Use 16.10. China 16.10.1. Pricing Analysis 16.10.2. Market Share Analysis, 2022 16.10.2.1. By Product 16.10.2.2. By Application 16.10.2.3. By Test Type 16.10.2.4. By Manufacturing 16.10.2.5. By End Use 16.11. Japan 16.11.1. Pricing Analysis 16.11.2. Market Share Analysis, 2022 16.11.2.1. By Product 16.11.2.2. By Application 16.11.2.3. By Test Type 16.11.2.4. By Manufacturing 16.11.2.5. By End Use 16.12. South Korea 16.12.1. Pricing Analysis 16.12.2. Market Share Analysis, 2022 16.12.2.1. By Product 16.12.2.2. By Application 16.12.2.3. By Test Type 16.12.2.4. By Manufacturing 16.12.2.5. By End Use 16.13. Singapore 16.13.1. Pricing Analysis 16.13.2. Market Share Analysis, 2022 16.13.2.1. By Product 16.13.2.2. By Application 16.13.2.3. By Test Type 16.13.2.4. By Manufacturing 16.13.2.5. By End Use 16.14. Thailand 16.14.1. Pricing Analysis 16.14.2. Market Share Analysis, 2022 16.14.2.1. By Product 16.14.2.2. By Application 16.14.2.3. By Test Type 16.14.2.4. By Manufacturing 16.14.2.5. By End Use 16.15. Indonesia 16.15.1. Pricing Analysis 16.15.2. Market Share Analysis, 2022 16.15.2.1. By Product 16.15.2.2. By Application 16.15.2.3. By Test Type 16.15.2.4. By Manufacturing 16.15.2.5. By End Use 16.16. Australia 16.16.1. Pricing Analysis 16.16.2. Market Share Analysis, 2022 16.16.2.1. By Product 16.16.2.2. By Application 16.16.2.3. By Test Type 16.16.2.4. By Manufacturing 16.16.2.5. By End Use 16.17. New Zealand 16.17.1. Pricing Analysis 16.17.2. Market Share Analysis, 2022 16.17.2.1. By Product 16.17.2.2. By Application 16.17.2.3. By Test Type 16.17.2.4. By Manufacturing 16.17.2.5. By End Use 16.18. GCC Countries 16.18.1. Pricing Analysis 16.18.2. Market Share Analysis, 2022 16.18.2.1. By Product 16.18.2.2. By Application 16.18.2.3. By Test Type 16.18.2.4. By Manufacturing 16.18.2.5. By End Use 16.19. South Africa 16.19.1. Pricing Analysis 16.19.2. Market Share Analysis, 2022 16.19.2.1. By Product 16.19.2.2. By Application 16.19.2.3. By Test Type 16.19.2.4. By Manufacturing 16.19.2.5. By End Use 16.20. Israel 16.20.1. Pricing Analysis 16.20.2. Market Share Analysis, 2022 16.20.2.1. By Product 16.20.2.2. By Application 16.20.2.3. By Test Type 16.20.2.4. By Manufacturing 16.20.2.5. By End Use 17. Market Structure Analysis 17.1. Competition Dashboard 17.2. Competition Benchmarking 17.3. Market Share Analysis of Top Players 17.3.1. By Regional 17.3.2. By Product 17.3.3. By Application 17.3.4. By Test Type 17.3.5. By Manufacturing 17.3.6. By End Use 18. Competition Analysis 18.1. Competition Deep Dive 18.1.1. Pacific Bio labs 18.1.1.1. Overview 18.1.1.2. Product Portfolio 18.1.1.3. Profitability by Market Segments 18.1.1.4. Sales Footprint 18.1.1.5. Strategy Overview 18.1.1.5.1. Marketing Strategy 18.1.1.5.2. Product Strategy 18.1.1.5.3. Channel Strategy 18.1.2. STERIS 18.1.2.1. Overview 18.1.2.2. Product Portfolio 18.1.2.3. Profitability by Market Segments 18.1.2.4. Sales Footprint 18.1.2.5. Strategy Overview 18.1.2.5.1. Marketing Strategy 18.1.2.5.2. Product Strategy 18.1.2.5.3. Channel Strategy 18.1.3. Boston Analytical 18.1.3.1. Overview 18.1.3.2. Product Portfolio 18.1.3.3. Profitability by Market Segments 18.1.3.4. Sales Footprint 18.1.3.5. Strategy Overview 18.1.3.5.1. Marketing Strategy 18.1.3.5.2. Product Strategy 18.1.3.5.3. Channel Strategy 18.1.4. Nelson Laboratories, LLC 18.1.4.1. Overview 18.1.4.2. Product Portfolio 18.1.4.3. Profitability by Market Segments 18.1.4.4. Sales Footprint 18.1.4.5. Strategy Overview 18.1.4.5.1. Marketing Strategy 18.1.4.5.2. Product Strategy 18.1.4.5.3. Channel Strategy 18.1.5. Sartorius AG 18.1.5.1. Overview 18.1.5.2. Product Portfolio 18.1.5.3. Profitability by Market Segments 18.1.5.4. Sales Footprint 18.1.5.5. Strategy Overview 18.1.5.5.1. Marketing Strategy 18.1.5.5.2. Product Strategy 18.1.5.5.3. Channel Strategy 18.1.6. SOLVIAS AG 18.1.6.1. Overview 18.1.6.2. Product Portfolio 18.1.6.3. Profitability by Market Segments 18.1.6.4. Sales Footprint 18.1.6.5. Strategy Overview 18.1.6.5.1. Marketing Strategy 18.1.6.5.2. Product Strategy 18.1.6.5.3. Channel Strategy 18.1.7. SGS SA 18.1.7.1. Overview 18.1.7.2. Product Portfolio 18.1.7.3. Profitability by Market Segments 18.1.7.4. Sales Footprint 18.1.7.5. Strategy Overview 18.1.7.5.1. Marketing Strategy 18.1.7.5.2. Product Strategy 18.1.7.5.3. Channel Strategy 18.1.8. Laboratory Corporation of America Holding 18.1.8.1. Overview 18.1.8.2. Product Portfolio 18.1.8.3. Profitability by Market Segments 18.1.8.4. Sales Footprint 18.1.8.5. Strategy Overview 18.1.8.5.1. Marketing Strategy 18.1.8.5.2. Product Strategy 18.1.8.5.3. Channel Strategy 18.1.9. Pace Analytical 18.1.9.1. Overview 18.1.9.2. Product Portfolio 18.1.9.3. Profitability by Market Segments 18.1.9.4. Sales Footprint 18.1.9.5. Strategy Overview 18.1.9.5.1. Marketing Strategy 18.1.9.5.2. Product Strategy 18.1.9.5.3. Channel Strategy 18.1.10. Charles River Laboratories 18.1.10.1. Overview 18.1.10.2. Product Portfolio 18.1.10.3. Profitability by Market Segments 18.1.10.4. Sales Footprint 18.1.10.5. Strategy Overview 18.1.10.5.1. Marketing Strategy 18.1.10.5.2. Product Strategy 18.1.10.5.3. Channel Strategy 18.1.11. Thermo Fisher Scientific, Inc. 18.1.11.1. Overview 18.1.11.2. Product Portfolio 18.1.11.3. Profitability by Market Segments 18.1.11.4. Sales Footprint 18.1.11.5. Strategy Overview 18.1.11.5.1. Marketing Strategy 18.1.11.5.2. Product Strategy 18.1.11.5.3. Channel Strategy 19. Assumptions & Acronyms Used 20. Research Methodology
Don't pay for what you don't need
Customize your report by selecting specific countries or regions and save 30%!
List of Tables
Table 1: Global Market Value (US$ Million) Forecast by Region, 2018 to 2033 Table 2: Global Market Volume (Units) Forecast by Region, 2018 to 2033 Table 3: Global Market Value (US$ Million) Forecast by Product, 2018 to 2033 Table 4: Global Market Volume (Units) Forecast by Product, 2018 to 2033 Table 5: Global Market Value (US$ Million) Forecast by Application, 2018 to 2033 Table 6: Global Market Volume (Units) Forecast by Application, 2018 to 2033 Table 7: Global Market Value (US$ Million) Forecast by Test Type, 2018 to 2033 Table 8: Global Market Volume (Units) Forecast by Test Type, 2018 to 2033 Table 9: Global Market Value (US$ Million) Forecast by Manufacturing, 2018 to 2033 Table 10: Global Market Volume (Units) Forecast by Manufacturing, 2018 to 2033 Table 11: Global Market Value (US$ Million) Forecast by End Use, 2018 to 2033 Table 12: Global Market Volume (Units) Forecast by End Use, 2018 to 2033 Table 13: North America Global Market Value (US$ Million) Forecast by Country, 2018 to 2033 Table 14: North America Global Market Volume (Units) Forecast by Country, 2018 to 2033 Table 15: North America Global Market Value (US$ Million) Forecast by Product, 2018 to 2033 Table 16: North America Global Market Volume (Units) Forecast by Product, 2018 to 2033 Table 17: North America Global Market Value (US$ Million) Forecast by Application, 2018 to 2033 Table 18: North America Global Market Volume (Units) Forecast by Application, 2018 to 2033 Table 19: North America Global Market Value (US$ Million) Forecast by Test Type, 2018 to 2033 Table 20: North America Global Market Volume (Units) Forecast by Test Type, 2018 to 2033 Table 21: North America Global Market Value (US$ Million) Forecast by Manufacturing, 2018 to 2033 Table 22: North America Global Market Volume (Units) Forecast by Manufacturing, 2018 to 2033 Table 23: North America Global Market Value (US$ Million) Forecast by End Use, 2018 to 2033 Table 24: North America Global Market Volume (Units) Forecast by End Use, 2018 to 2033 Table 25: Latin America Global Market Value (US$ Million) Forecast by Country, 2018 to 2033 Table 26: Latin America Global Market Volume (Units) Forecast by Country, 2018 to 2033 Table 27: Latin America Global Market Value (US$ Million) Forecast by Product, 2018 to 2033 Table 28: Latin America Global Market Volume (Units) Forecast by Product, 2018 to 2033 Table 29: Latin America Global Market Value (US$ Million) Forecast by Application, 2018 to 2033 Table 30: Latin America Global Market Volume (Units) Forecast by Application, 2018 to 2033 Table 31: Latin America Global Market Value (US$ Million) Forecast by Test Type, 2018 to 2033 Table 32: Latin America Global Market Volume (Units) Forecast by Test Type, 2018 to 2033 Table 33: Latin America Global Market Value (US$ Million) Forecast by Manufacturing, 2018 to 2033 Table 34: Latin America Global Market Volume (Units) Forecast by Manufacturing, 2018 to 2033 Table 35: Latin America Global Market Value (US$ Million) Forecast by End Use, 2018 to 2033 Table 36: Latin America Global Market Volume (Units) Forecast by End Use, 2018 to 2033 Table 37: Europe Global Market Value (US$ Million) Forecast by Country, 2018 to 2033 Table 38: Europe Global Market Volume (Units) Forecast by Country, 2018 to 2033 Table 39: Europe Global Market Value (US$ Million) Forecast by Product, 2018 to 2033 Table 40: Europe Global Market Volume (Units) Forecast by Product, 2018 to 2033 Table 41: Europe Global Market Value (US$ Million) Forecast by Application, 2018 to 2033 Table 42: Europe Global Market Volume (Units) Forecast by Application, 2018 to 2033 Table 43: Europe Global Market Value (US$ Million) Forecast by Test Type, 2018 to 2033 Table 44: Europe Global Market Volume (Units) Forecast by Test Type, 2018 to 2033 Table 45: Europe Global Market Value (US$ Million) Forecast by Manufacturing, 2018 to 2033 Table 46: Europe Global Market Volume (Units) Forecast by Manufacturing, 2018 to 2033 Table 47: Europe Global Market Value (US$ Million) Forecast by End Use, 2018 to 2033 Table 48: Europe Global Market Volume (Units) Forecast by End Use, 2018 to 2033 Table 49: Asia Pacific Global Market Value (US$ Million) Forecast by Country, 2018 to 2033 Table 50: Asia Pacific Global Market Volume (Units) Forecast by Country, 2018 to 2033 Table 51: Asia Pacific Global Market Value (US$ Million) Forecast by Product, 2018 to 2033 Table 52: Asia Pacific Global Market Volume (Units) Forecast by Product, 2018 to 2033 Table 53: Asia Pacific Global Market Value (US$ Million) Forecast by Application, 2018 to 2033 Table 54: Asia Pacific Global Market Volume (Units) Forecast by Application, 2018 to 2033 Table 55: Asia Pacific Global Market Value (US$ Million) Forecast by Test Type, 2018 to 2033 Table 56: Asia Pacific Global Market Volume (Units) Forecast by Test Type, 2018 to 2033 Table 57: Asia Pacific Global Market Value (US$ Million) Forecast by Manufacturing, 2018 to 2033 Table 58: Asia Pacific Global Market Volume (Units) Forecast by Manufacturing, 2018 to 2033 Table 59: Asia Pacific Global Market Value (US$ Million) Forecast by End Use, 2018 to 2033 Table 60: Asia Pacific Global Market Volume (Units) Forecast by End Use, 2018 to 2033 Table 61: MEA Global Market Value (US$ Million) Forecast by Country, 2018 to 2033 Table 62: MEA Global Market Volume (Units) Forecast by Country, 2018 to 2033 Table 63: MEA Global Market Value (US$ Million) Forecast by Product, 2018 to 2033 Table 64: MEA Global Market Volume (Units) Forecast by Product, 2018 to 2033 Table 65: MEA Global Market Value (US$ Million) Forecast by Application, 2018 to 2033 Table 66: MEA Global Market Volume (Units) Forecast by Application, 2018 to 2033 Table 67: MEA Global Market Value (US$ Million) Forecast by Test Type, 2018 to 2033 Table 68: MEA Global Market Volume (Units) Forecast by Test Type, 2018 to 2033 Table 69: MEA Global Market Value (US$ Million) Forecast by Manufacturing, 2018 to 2033 Table 70: MEA Global Market Volume (Units) Forecast by Manufacturing, 2018 to 2033 Table 71: MEA Global Market Value (US$ Million) Forecast by End Use, 2018 to 2033 Table 72: MEA Global Market Volume (Units) Forecast by End Use, 2018 to 2033
List of Charts
Figure 1: Global Market Value (US$ Million) by Product, 2023 to 2033 Figure 2: Global Market Value (US$ Million) by Application, 2023 to 2033 Figure 3: Global Market Value (US$ Million) by Test Type, 2023 to 2033 Figure 4: Global Market Value (US$ Million) by Manufacturing, 2023 to 2033 Figure 5: Global Market Value (US$ Million) by End Use, 2023 to 2033 Figure 6: Global Market Value (US$ Million) by Region, 2023 to 2033 Figure 7: Global Market Value (US$ Million) Analysis by Region, 2018 to 2033 Figure 8: Global Market Volume (Units) Analysis by Region, 2018 to 2033 Figure 9: Global Market Value Share (%) and BPS Analysis by Region, 2023 to 2033 Figure 10: Global Market Y-o-Y Growth (%) Projections by Region, 2023 to 2033 Figure 11: Global Market Value (US$ Million) Analysis by Product, 2018 to 2033 Figure 12: Global Market Volume (Units) Analysis by Product, 2018 to 2033 Figure 13: Global Market Value Share (%) and BPS Analysis by Product, 2023 to 2033 Figure 14: Global Market Y-o-Y Growth (%) Projections by Product, 2023 to 2033 Figure 15: Global Market Value (US$ Million) Analysis by Application, 2018 to 2033 Figure 16: Global Market Volume (Units) Analysis by Application, 2018 to 2033 Figure 17: Global Market Value Share (%) and BPS Analysis by Application, 2023 to 2033 Figure 18: Global Market Y-o-Y Growth (%) Projections by Application, 2023 to 2033 Figure 19: Global Market Value (US$ Million) Analysis by Test Type, 2018 to 2033 Figure 20: Global Market Volume (Units) Analysis by Test Type, 2018 to 2033 Figure 21: Global Market Value Share (%) and BPS Analysis by Test Type, 2023 to 2033 Figure 22: Global Market Y-o-Y Growth (%) Projections by Test Type, 2023 to 2033 Figure 23: Global Market Value (US$ Million) Analysis by Manufacturing, 2018 to 2033 Figure 24: Global Market Volume (Units) Analysis by Manufacturing, 2018 to 2033 Figure 25: Global Market Value Share (%) and BPS Analysis by Manufacturing, 2023 to 2033 Figure 26: Global Market Y-o-Y Growth (%) Projections by Manufacturing, 2023 to 2033 Figure 27: Global Market Value (US$ Million) Analysis by End Use, 2018 to 2033 Figure 28: Global Market Volume (Units) Analysis by End Use, 2018 to 2033 Figure 29: Global Market Value Share (%) and BPS Analysis by End Use, 2023 to 2033 Figure 30: Global Market Y-o-Y Growth (%) Projections by End Use, 2023 to 2033 Figure 31: Global Market Attractiveness by Product, 2023 to 2033 Figure 32: Global Market Attractiveness by Application, 2023 to 2033 Figure 33: Global Market Attractiveness by Test Type, 2023 to 2033 Figure 34: Global Market Attractiveness by Manufacturing, 2023 to 2033 Figure 35: Global Market Attractiveness by End Use, 2023 to 2033 Figure 36: Global Market Attractiveness by Region, 2023 to 2033 Figure 37: North America Global Market Value (US$ Million) by Product, 2023 to 2033 Figure 38: North America Global Market Value (US$ Million) by Application, 2023 to 2033 Figure 39: North America Global Market Value (US$ Million) by Test Type, 2023 to 2033 Figure 40: North America Global Market Value (US$ Million) by Manufacturing, 2023 to 2033 Figure 41: North America Global Market Value (US$ Million) by End Use, 2023 to 2033 Figure 42: North America Global Market Value (US$ Million) by Country, 2023 to 2033 Figure 43: North America Global Market Value (US$ Million) Analysis by Country, 2018 to 2033 Figure 44: North America Global Market Volume (Units) Analysis by Country, 2018 to 2033 Figure 45: North America Global Market Value Share (%) and BPS Analysis by Country, 2023 to 2033 Figure 46: North America Global Market Y-o-Y Growth (%) Projections by Country, 2023 to 2033 Figure 47: North America Global Market Value (US$ Million) Analysis by Product, 2018 to 2033 Figure 48: North America Global Market Volume (Units) Analysis by Product, 2018 to 2033 Figure 49: North America Global Market Value Share (%) and BPS Analysis by Product, 2023 to 2033 Figure 50: North America Global Market Y-o-Y Growth (%) Projections by Product, 2023 to 2033 Figure 51: North America Global Market Value (US$ Million) Analysis by Application, 2018 to 2033 Figure 52: North America Global Market Volume (Units) Analysis by Application, 2018 to 2033 Figure 53: North America Global Market Value Share (%) and BPS Analysis by Application, 2023 to 2033 Figure 54: North America Global Market Y-o-Y Growth (%) Projections by Application, 2023 to 2033 Figure 55: North America Global Market Value (US$ Million) Analysis by Test Type, 2018 to 2033 Figure 56: North America Global Market Volume (Units) Analysis by Test Type, 2018 to 2033 Figure 57: North America Global Market Value Share (%) and BPS Analysis by Test Type, 2023 to 2033 Figure 58: North America Global Market Y-o-Y Growth (%) Projections by Test Type, 2023 to 2033 Figure 59: North America Global Market Value (US$ Million) Analysis by Manufacturing, 2018 to 2033 Figure 60: North America Global Market Volume (Units) Analysis by Manufacturing, 2018 to 2033 Figure 61: North America Global Market Value Share (%) and BPS Analysis by Manufacturing, 2023 to 2033 Figure 62: North America Global Market Y-o-Y Growth (%) Projections by Manufacturing, 2023 to 2033 Figure 63: North America Global Market Value (US$ Million) Analysis by End Use, 2018 to 2033 Figure 64: North America Global Market Volume (Units) Analysis by End Use, 2018 to 2033 Figure 65: North America Global Market Value Share (%) and BPS Analysis by End Use, 2023 to 2033 Figure 66: North America Global Market Y-o-Y Growth (%) Projections by End Use, 2023 to 2033 Figure 67: North America Global Market Attractiveness by Product, 2023 to 2033 Figure 68: North America Global Market Attractiveness by Application, 2023 to 2033 Figure 69: North America Global Market Attractiveness by Test Type, 2023 to 2033 Figure 70: North America Global Market Attractiveness by Manufacturing, 2023 to 2033 Figure 71: North America Global Market Attractiveness by End Use, 2023 to 2033 Figure 72: North America Global Market Attractiveness by Country, 2023 to 2033 Figure 73: Latin America Global Market Value (US$ Million) by Product, 2023 to 2033 Figure 74: Latin America Global Market Value (US$ Million) by Application, 2023 to 2033 Figure 75: Latin America Global Market Value (US$ Million) by Test Type, 2023 to 2033 Figure 76: Latin America Global Market Value (US$ Million) by Manufacturing, 2023 to 2033 Figure 77: Latin America Global Market Value (US$ Million) by End Use, 2023 to 2033 Figure 78: Latin America Global Market Value (US$ Million) by Country, 2023 to 2033 Figure 79: Latin America Global Market Value (US$ Million) Analysis by Country, 2018 to 2033 Figure 80: Latin America Global Market Volume (Units) Analysis by Country, 2018 to 2033 Figure 81: Latin America Global Market Value Share (%) and BPS Analysis by Country, 2023 to 2033 Figure 82: Latin America Global Market Y-o-Y Growth (%) Projections by Country, 2023 to 2033 Figure 83: Latin America Global Market Value (US$ Million) Analysis by Product, 2018 to 2033 Figure 84: Latin America Global Market Volume (Units) Analysis by Product, 2018 to 2033 Figure 85: Latin America Global Market Value Share (%) and BPS Analysis by Product, 2023 to 2033 Figure 86: Latin America Global Market Y-o-Y Growth (%) Projections by Product, 2023 to 2033 Figure 87: Latin America Global Market Value (US$ Million) Analysis by Application, 2018 to 2033 Figure 88: Latin America Global Market Volume (Units) Analysis by Application, 2018 to 2033 Figure 89: Latin America Global Market Value Share (%) and BPS Analysis by Application, 2023 to 2033 Figure 90: Latin America Global Market Y-o-Y Growth (%) Projections by Application, 2023 to 2033 Figure 91: Latin America Global Market Value (US$ Million) Analysis by Test Type, 2018 to 2033 Figure 92: Latin America Global Market Volume (Units) Analysis by Test Type, 2018 to 2033 Figure 93: Latin America Global Market Value Share (%) and BPS Analysis by Test Type, 2023 to 2033 Figure 94: Latin America Global Market Y-o-Y Growth (%) Projections by Test Type, 2023 to 2033 Figure 95: Latin America Global Market Value (US$ Million) Analysis by Manufacturing, 2018 to 2033 Figure 96: Latin America Global Market Volume (Units) Analysis by Manufacturing, 2018 to 2033 Figure 97: Latin America Global Market Value Share (%) and BPS Analysis by Manufacturing, 2023 to 2033 Figure 98: Latin America Global Market Y-o-Y Growth (%) Projections by Manufacturing, 2023 to 2033 Figure 99: Latin America Global Market Value (US$ Million) Analysis by End Use, 2018 to 2033 Figure 100: Latin America Global Market Volume (Units) Analysis by End Use, 2018 to 2033 Figure 101: Latin America Global Market Value Share (%) and BPS Analysis by End Use, 2023 to 2033 Figure 102: Latin America Global Market Y-o-Y Growth (%) Projections by End Use, 2023 to 2033 Figure 103: Latin America Global Market Attractiveness by Product, 2023 to 2033 Figure 104: Latin America Global Market Attractiveness by Application, 2023 to 2033 Figure 105: Latin America Global Market Attractiveness by Test Type, 2023 to 2033 Figure 106: Latin America Global Market Attractiveness by Manufacturing, 2023 to 2033 Figure 107: Latin America Global Market Attractiveness by End Use, 2023 to 2033 Figure 108: Latin America Global Market Attractiveness by Country, 2023 to 2033 Figure 109: Europe Global Market Value (US$ Million) by Product, 2023 to 2033 Figure 110: Europe Global Market Value (US$ Million) by Application, 2023 to 2033 Figure 111: Europe Global Market Value (US$ Million) by Test Type, 2023 to 2033 Figure 112: Europe Global Market Value (US$ Million) by Manufacturing, 2023 to 2033 Figure 113: Europe Global Market Value (US$ Million) by End Use, 2023 to 2033 Figure 114: Europe Global Market Value (US$ Million) by Country, 2023 to 2033 Figure 115: Europe Global Market Value (US$ Million) Analysis by Country, 2018 to 2033 Figure 116: Europe Global Market Volume (Units) Analysis by Country, 2018 to 2033 Figure 117: Europe Global Market Value Share (%) and BPS Analysis by Country, 2023 to 2033 Figure 118: Europe Global Market Y-o-Y Growth (%) Projections by Country, 2023 to 2033 Figure 119: Europe Global Market Value (US$ Million) Analysis by Product, 2018 to 2033 Figure 120: Europe Global Market Volume (Units) Analysis by Product, 2018 to 2033 Figure 121: Europe Global Market Value Share (%) and BPS Analysis by Product, 2023 to 2033 Figure 122: Europe Global Market Y-o-Y Growth (%) Projections by Product, 2023 to 2033 Figure 123: Europe Global Market Value (US$ Million) Analysis by Application, 2018 to 2033 Figure 124: Europe Global Market Volume (Units) Analysis by Application, 2018 to 2033 Figure 125: Europe Global Market Value Share (%) and BPS Analysis by Application, 2023 to 2033 Figure 126: Europe Global Market Y-o-Y Growth (%) Projections by Application, 2023 to 2033 Figure 127: Europe Global Market Value (US$ Million) Analysis by Test Type, 2018 to 2033 Figure 128: Europe Global Market Volume (Units) Analysis by Test Type, 2018 to 2033 Figure 129: Europe Global Market Value Share (%) and BPS Analysis by Test Type, 2023 to 2033 Figure 130: Europe Global Market Y-o-Y Growth (%) Projections by Test Type, 2023 to 2033 Figure 131: Europe Global Market Value (US$ Million) Analysis by Manufacturing, 2018 to 2033 Figure 132: Europe Global Market Volume (Units) Analysis by Manufacturing, 2018 to 2033 Figure 133: Europe Global Market Value Share (%) and BPS Analysis by Manufacturing, 2023 to 2033 Figure 134: Europe Global Market Y-o-Y Growth (%) Projections by Manufacturing, 2023 to 2033 Figure 135: Europe Global Market Value (US$ Million) Analysis by End Use, 2018 to 2033 Figure 136: Europe Global Market Volume (Units) Analysis by End Use, 2018 to 2033 Figure 137: Europe Global Market Value Share (%) and BPS Analysis by End Use, 2023 to 2033 Figure 138: Europe Global Market Y-o-Y Growth (%) Projections by End Use, 2023 to 2033 Figure 139: Europe Global Market Attractiveness by Product, 2023 to 2033 Figure 140: Europe Global Market Attractiveness by Application, 2023 to 2033 Figure 141: Europe Global Market Attractiveness by Test Type, 2023 to 2033 Figure 142: Europe Global Market Attractiveness by Manufacturing, 2023 to 2033 Figure 143: Europe Global Market Attractiveness by End Use, 2023 to 2033 Figure 144: Europe Global Market Attractiveness by Country, 2023 to 2033 Figure 145: Asia Pacific Global Market Value (US$ Million) by Product, 2023 to 2033 Figure 146: Asia Pacific Global Market Value (US$ Million) by Application, 2023 to 2033 Figure 147: Asia Pacific Global Market Value (US$ Million) by Test Type, 2023 to 2033 Figure 148: Asia Pacific Global Market Value (US$ Million) by Manufacturing, 2023 to 2033 Figure 149: Asia Pacific Global Market Value (US$ Million) by End Use, 2023 to 2033 Figure 150: Asia Pacific Global Market Value (US$ Million) by Country, 2023 to 2033 Figure 151: Asia Pacific Global Market Value (US$ Million) Analysis by Country, 2018 to 2033 Figure 152: Asia Pacific Global Market Volume (Units) Analysis by Country, 2018 to 2033 Figure 153: Asia Pacific Global Market Value Share (%) and BPS Analysis by Country, 2023 to 2033 Figure 154: Asia Pacific Global Market Y-o-Y Growth (%) Projections by Country, 2023 to 2033 Figure 155: Asia Pacific Global Market Value (US$ Million) Analysis by Product, 2018 to 2033 Figure 156: Asia Pacific Global Market Volume (Units) Analysis by Product, 2018 to 2033 Figure 157: Asia Pacific Global Market Value Share (%) and BPS Analysis by Product, 2023 to 2033 Figure 158: Asia Pacific Global Market Y-o-Y Growth (%) Projections by Product, 2023 to 2033 Figure 159: Asia Pacific Global Market Value (US$ Million) Analysis by Application, 2018 to 2033 Figure 160: Asia Pacific Global Market Volume (Units) Analysis by Application, 2018 to 2033 Figure 161: Asia Pacific Global Market Value Share (%) and BPS Analysis by Application, 2023 to 2033 Figure 162: Asia Pacific Global Market Y-o-Y Growth (%) Projections by Application, 2023 to 2033 Figure 163: Asia Pacific Global Market Value (US$ Million) Analysis by Test Type, 2018 to 2033 Figure 164: Asia Pacific Global Market Volume (Units) Analysis by Test Type, 2018 to 2033 Figure 165: Asia Pacific Global Market Value Share (%) and BPS Analysis by Test Type, 2023 to 2033 Figure 166: Asia Pacific Global Market Y-o-Y Growth (%) Projections by Test Type, 2023 to 2033 Figure 167: Asia Pacific Global Market Value (US$ Million) Analysis by Manufacturing, 2018 to 2033 Figure 168: Asia Pacific Global Market Volume (Units) Analysis by Manufacturing, 2018 to 2033 Figure 169: Asia Pacific Global Market Value Share (%) and BPS Analysis by Manufacturing, 2023 to 2033 Figure 170: Asia Pacific Global Market Y-o-Y Growth (%) Projections by Manufacturing, 2023 to 2033 Figure 171: Asia Pacific Global Market Value (US$ Million) Analysis by End Use, 2018 to 2033 Figure 172: Asia Pacific Global Market Volume (Units) Analysis by End Use, 2018 to 2033 Figure 173: Asia Pacific Global Market Value Share (%) and BPS Analysis by End Use, 2023 to 2033 Figure 174: Asia Pacific Global Market Y-o-Y Growth (%) Projections by End Use, 2023 to 2033 Figure 175: Asia Pacific Global Market Attractiveness by Product, 2023 to 2033 Figure 176: Asia Pacific Global Market Attractiveness by Application, 2023 to 2033 Figure 177: Asia Pacific Global Market Attractiveness by Test Type, 2023 to 2033 Figure 178: Asia Pacific Global Market Attractiveness by Manufacturing, 2023 to 2033 Figure 179: Asia Pacific Global Market Attractiveness by End Use, 2023 to 2033 Figure 180: Asia Pacific Global Market Attractiveness by Country, 2023 to 2033 Figure 181: MEA Global Market Value (US$ Million) by Product, 2023 to 2033 Figure 182: MEA Global Market Value (US$ Million) by Application, 2023 to 2033 Figure 183: MEA Global Market Value (US$ Million) by Test Type, 2023 to 2033 Figure 184: MEA Global Market Value (US$ Million) by Manufacturing, 2023 to 2033 Figure 185: MEA Global Market Value (US$ Million) by End Use, 2023 to 2033 Figure 186: MEA Global Market Value (US$ Million) by Country, 2023 to 2033 Figure 187: MEA Global Market Value (US$ Million) Analysis by Country, 2018 to 2033 Figure 188: MEA Global Market Volume (Units) Analysis by Country, 2018 to 2033 Figure 189: MEA Global Market Value Share (%) and BPS Analysis by Country, 2023 to 2033 Figure 190: MEA Global Market Y-o-Y Growth (%) Projections by Country, 2023 to 2033 Figure 191: MEA Global Market Value (US$ Million) Analysis by Product, 2018 to 2033 Figure 192: MEA Global Market Volume (Units) Analysis by Product, 2018 to 2033 Figure 193: MEA Global Market Value Share (%) and BPS Analysis by Product, 2023 to 2033 Figure 194: MEA Global Market Y-o-Y Growth (%) Projections by Product, 2023 to 2033 Figure 195: MEA Global Market Value (US$ Million) Analysis by Application, 2018 to 2033 Figure 196: MEA Global Market Volume (Units) Analysis by Application, 2018 to 2033 Figure 197: MEA Global Market Value Share (%) and BPS Analysis by Application, 2023 to 2033 Figure 198: MEA Global Market Y-o-Y Growth (%) Projections by Application, 2023 to 2033 Figure 199: MEA Global Market Value (US$ Million) Analysis by Test Type, 2018 to 2033 Figure 200: MEA Global Market Volume (Units) Analysis by Test Type, 2018 to 2033 Figure 201: MEA Global Market Value Share (%) and BPS Analysis by Test Type, 2023 to 2033 Figure 202: MEA Global Market Y-o-Y Growth (%) Projections by Test Type, 2023 to 2033 Figure 203: MEA Global Market Value (US$ Million) Analysis by Manufacturing, 2018 to 2033 Figure 204: MEA Global Market Volume (Units) Analysis by Manufacturing, 2018 to 2033 Figure 205: MEA Global Market Value Share (%) and BPS Analysis by Manufacturing, 2023 to 2033 Figure 206: MEA Global Market Y-o-Y Growth (%) Projections by Manufacturing, 2023 to 2033 Figure 207: MEA Global Market Value (US$ Million) Analysis by End Use, 2018 to 2033 Figure 208: MEA Global Market Volume (Units) Analysis by End Use, 2018 to 2033 Figure 209: MEA Global Market Value Share (%) and BPS Analysis by End Use, 2023 to 2033 Figure 210: MEA Global Market Y-o-Y Growth (%) Projections by End Use, 2023 to 2033 Figure 211: MEA Global Market Attractiveness by Product, 2023 to 2033 Figure 212: MEA Global Market Attractiveness by Application, 2023 to 2033 Figure 213: MEA Global Market Attractiveness by Test Type, 2023 to 2033 Figure 214: MEA Global Market Attractiveness by Manufacturing, 2023 to 2033 Figure 215: MEA Global Market Attractiveness by End Use, 2023 to 2033 Figure 216: MEA Global Market Attractiveness by Country, 2023 to 2033
Recommendations
Explore Healthcare Insights
View Reports