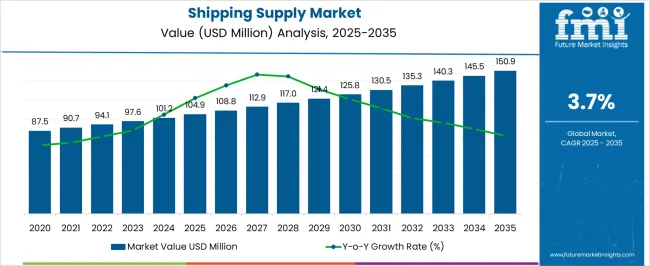
The global shipping supply market value in 2024 is estimated to be around USD 101.2 billion. The demand for shipping supplies is predicted to grow at a CAGR of 3.7% from 2024 to 2034. The overall industry value is expected to reach around USD 145.5 billion by 2034.
Shipping Supply Market Trends & Analysis
Report Attribute | Details |
---|---|
Shipping Supply Market Revenue (2024) | USD 101.2 billion |
Anticipated Market Value (2034) | USD 145.5 billion |
Value-based CAGR (2024 to 2034) | 3.7% |
The global shipping supply market was valued at USD 89.4 billion in 2019. It expanded at a CAGR of 2.1% from 2019 to 2023. The market reached USD 97.2 billion by 2023.
Attributes | Details |
---|---|
Historical Market Size (2019) | USD 89.4 billion |
Market Size (2023) | USD 97.2 billion |
HCAGR (2019 to 2023) | 2.1% |
As more consumers opted for online shopping during 2020 and 2021, there was a significant increase in parcel packaging and mailing supplies. This fateful behavioral change in the consumer side led to the strengthening of logistics packaging trends that are expected to drive the market in the future as well.
Currently, packaging materials like corrugated boxes and cardboard boxes that are recyclable, biodegradable, and reusable are in a position to carve out a market niche. So, shipping and packing products suppliers are reorienting their supply chains to take advantage of sustainable packaging trends by using environmentally friendly packaging materials.
To improve customer experience and brand awareness, shipping service providers are looking for custom-made packaging solutions that are branded or easily printable. The sheer complexity of present-day supply chains due to globalization also necessitates greater marking and branding of cargo packaging solutions for easy sorting.
Market players that provided shipping supplies for pharmaceutical industries became essential during the pandemic years and reshaped the packaging materials industry outlook. Many shipping supply businesses that catered to different commercial sectors started concentrating on medicine and vaccine supplies only.
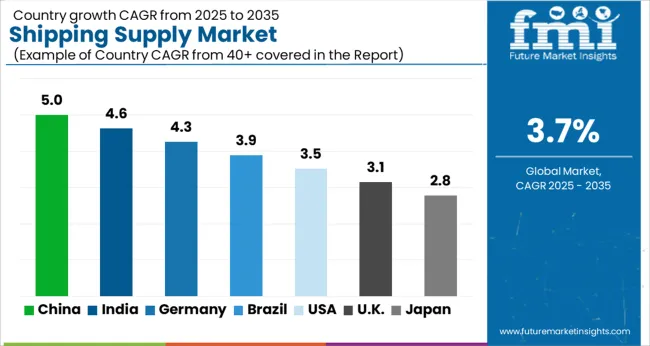
The list below presents a brief overview of how shipping supply industries in different geographical locations are going to perform in the coming days. The overall market size in developed economies like the United States and the United Kingdom is poised to remain higher. Meanwhile, emerging markets like India and China are anticipated to present more lucrative growth opportunities in the region.
Countries | CAGR (2024 to 2034) |
---|---|
United States | 2.5% |
United Kingdom | 3.8% |
China | 5.7% |
India | 6.4% |
The United States shipping supply market is projected to rise at a CAGR of 2.5% from 2024 to 2034.
The use of modern and effective transportation methods, such as logistics vehicles with GPS trackers, has also transformed the market in the United States. So, a greater share of the shipping supply business has been concentrated in the hands of a few market players with higher capital.
The demand for shipping supplies in the United Kingdom is poised to advance at a 3.8% CAGR during the forecast period.
Logistics companies in the United Kingdom are always more concerned regarding the safe delivery of cargo making packaging and shipping crucial for the industrial economy. There is a great demand for packaging solutions in the country that are safe, robust, and adhere to international shipping regulations.
Demand for shipping supplies is higher in China than in other Asian countries, and the market is expected to progress at a 5.7% CAGR through 2034.
The logistics and shipping industry has seen tremendous growth in China due to the weakening of laws to encourage import, export, and trade across the country. Furthermore, as cross-border eCommerce is growing fast in China, shipping supply companies have more opportunities to meet the special packing and shipping requirements of export companies.
The demand for shipping supplies in India is estimated to rise at a CAGR of 6.4% over the next ten years.
As direct-to-consumer services have grown in popularity, more small and medium-sized companies have joined the market in India in recent years. In addition, the development of small-scale industries in several tier II and tier III cities has indirectly increased the demand for shipping supplies for the packaging of merchandise.
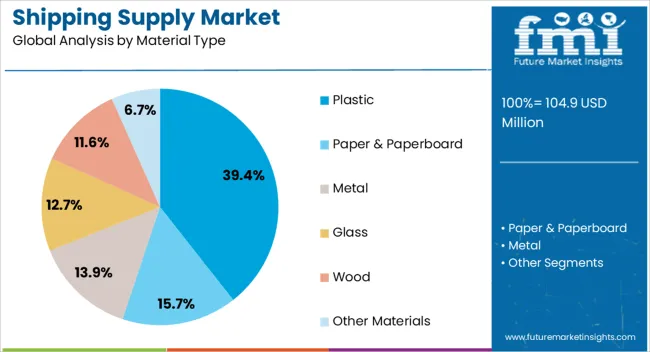
The paper segment is estimated to constitute 43.6% of the market by material in 2024.
Attributes | Details |
---|---|
Top Material Type | Paper |
Market Share in 2024 | 43.6% |
Most companies prefer shipping products that are both affordable and dependable, resulting in higher use of paper materials by shipping supply service providers. Moreover, corrugated paper boxes and cardboard boxes made of paper are in line with the global shift toward a sustainable shipping and logistics sector.
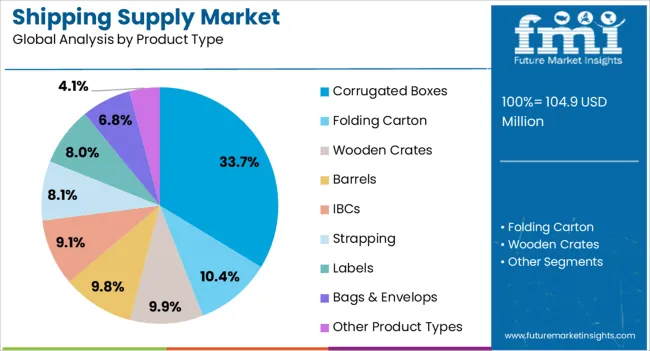
The demand for packaging bags is expected to hold a total market share of 21.3% in 2024.
Attributes | Details |
---|---|
Top Packaging Format Type | Bags |
Market Share in 2024 | 21.3% |
As last-mile delivery services have grown, logistics companies are preferring lightweight and compact packing solutions like shipping bags and mailers. Durability, custom compliance, and protection during long-distance transit are highly desirable in the present-day shipping supply market. This is contributing to the segment’s growth.
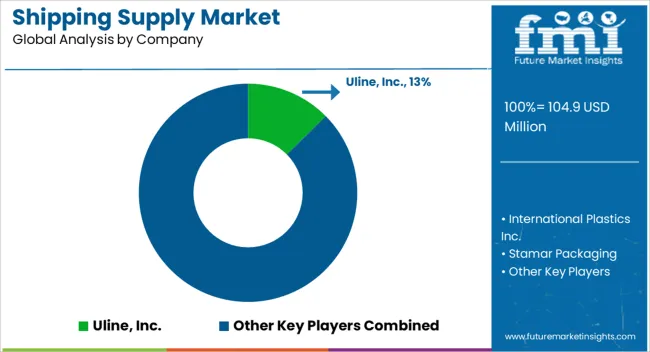
Many big and small shipping supply service providers are present in the global landscape, and the intense competition is orchestrating cargo packaging market developments further. The responsibility of market players has stretched out to designing shipping equipment as per traveling conditions and protecting the cargo while they are in transit. Leading market players have also improved their brand visibility and control by focusing on innovations like temperature-controlled packaging, smart packaging, and track-and-trace technology.
Recent Developments in the Global Shipping Supply Market
Attribute | Details |
---|---|
Estimated Market Size (2024) | USD 101.2 billion |
Projected Market Size (2034) | USD 145.5 billion |
CAGR (2024 to 2034) | 3.7% |
Forecast Period | 2024 to 2034 |
Historical Data Available for | 2019 to 2023 |
Market Analysis | USD million or billion for Value and Units for Volume |
Key Regions Covered | North America; Latin America; Europe; Middle East & Africa (MEA); East Asia; South Asia and Oceania |
Key Countries Covered | United States, Canada, Brazil, Mexico, Germany, Spain, Italy, France, United Kingdom, Russia, China, India, Australia & New Zealand, GCC Countries, and South Africa |
Key Segments Covered | By Product Type, By Material Type, By End User Verticals and By Region |
Key Companies Profiled | Uline, Inc.; International Plastics Inc.; Stamar Packaging; UWAY Packaging Supplies.; Ferguson Box Company; Volk Packaging Corporation; Western Container Corporation; Great Little Box Company Ltd.; Liaoning Hengyue Printing and Packaging Co., Ltd.; Dahua Brother Enterprise Co., Ltd. |
Report Coverage | Market Forecast, Company Share Analysis, Competition Intelligence, DROT Analysis, Market Dynamics and Challenges, and Strategic Growth Initiatives |
Customization & Pricing | Available upon Request |
Table 1: Global Market Value (US$ Million) Forecast by Region, 2019 to 2034
Table 2: Global Market Volume (Units) Forecast by Region, 2019 to 2034
Table 3: Global Market Value (US$ Million) Forecast by Material, 2019 to 2034
Table 4: Global Market Volume (Units) Forecast by Material, 2019 to 2034
Table 5: Global Market Value (US$ Million) Forecast by Packaging Format, 2019 to 2034
Table 6: Global Market Volume (Units) Forecast by Packaging Format, 2019 to 2034
Table 7: Global Market Value (US$ Million) Forecast by End Use, 2019 to 2034
Table 8: Global Market Volume (Units) Forecast by End Use, 2019 to 2034
Table 9: North America Market Value (US$ Million) Forecast by Country, 2019 to 2034
Table 10: North America Market Volume (Units) Forecast by Country, 2019 to 2034
Table 11: North America Market Value (US$ Million) Forecast by Material, 2019 to 2034
Table 12: North America Market Volume (Units) Forecast by Material, 2019 to 2034
Table 13: North America Market Value (US$ Million) Forecast by Packaging Format, 2019 to 2034
Table 14: North America Market Volume (Units) Forecast by Packaging Format, 2019 to 2034
Table 15: North America Market Value (US$ Million) Forecast by End Use, 2019 to 2034
Table 16: North America Market Volume (Units) Forecast by End Use, 2019 to 2034
Table 17: Latin America Market Value (US$ Million) Forecast by Country, 2019 to 2034
Table 18: Latin America Market Volume (Units) Forecast by Country, 2019 to 2034
Table 19: Latin America Market Value (US$ Million) Forecast by Material, 2019 to 2034
Table 20: Latin America Market Volume (Units) Forecast by Material, 2019 to 2034
Table 21: Latin America Market Value (US$ Million) Forecast by Packaging Format, 2019 to 2034
Table 22: Latin America Market Volume (Units) Forecast by Packaging Format, 2019 to 2034
Table 23: Latin America Market Value (US$ Million) Forecast by End Use, 2019 to 2034
Table 24: Latin America Market Volume (Units) Forecast by End Use, 2019 to 2034
Table 25: Western Europe Market Value (US$ Million) Forecast by Country, 2019 to 2034
Table 26: Western Europe Market Volume (Units) Forecast by Country, 2019 to 2034
Table 27: Western Europe Market Value (US$ Million) Forecast by Material, 2019 to 2034
Table 28: Western Europe Market Volume (Units) Forecast by Material, 2019 to 2034
Table 29: Western Europe Market Value (US$ Million) Forecast by Packaging Format, 2019 to 2034
Table 30: Western Europe Market Volume (Units) Forecast by Packaging Format, 2019 to 2034
Table 31: Western Europe Market Value (US$ Million) Forecast by End Use, 2019 to 2034
Table 32: Western Europe Market Volume (Units) Forecast by End Use, 2019 to 2034
Table 33: Eastern Europe Market Value (US$ Million) Forecast by Country, 2019 to 2034
Table 34: Eastern Europe Market Volume (Units) Forecast by Country, 2019 to 2034
Table 35: Eastern Europe Market Value (US$ Million) Forecast by Material, 2019 to 2034
Table 36: Eastern Europe Market Volume (Units) Forecast by Material, 2019 to 2034
Table 37: Eastern Europe Market Value (US$ Million) Forecast by Packaging Format, 2019 to 2034
Table 38: Eastern Europe Market Volume (Units) Forecast by Packaging Format, 2019 to 2034
Table 39: Eastern Europe Market Value (US$ Million) Forecast by End Use, 2019 to 2034
Table 40: Eastern Europe Market Volume (Units) Forecast by End Use, 2019 to 2034
Table 41: South Asia and Pacific Market Value (US$ Million) Forecast by Country, 2019 to 2034
Table 42: South Asia and Pacific Market Volume (Units) Forecast by Country, 2019 to 2034
Table 43: South Asia and Pacific Market Value (US$ Million) Forecast by Material, 2019 to 2034
Table 44: South Asia and Pacific Market Volume (Units) Forecast by Material, 2019 to 2034
Table 45: South Asia and Pacific Market Value (US$ Million) Forecast by Packaging Format, 2019 to 2034
Table 46: South Asia and Pacific Market Volume (Units) Forecast by Packaging Format, 2019 to 2034
Table 47: South Asia and Pacific Market Value (US$ Million) Forecast by End Use, 2019 to 2034
Table 48: South Asia and Pacific Market Volume (Units) Forecast by End Use, 2019 to 2034
Table 49: East Asia Market Value (US$ Million) Forecast by Country, 2019 to 2034
Table 50: East Asia Market Volume (Units) Forecast by Country, 2019 to 2034
Table 51: East Asia Market Value (US$ Million) Forecast by Material, 2019 to 2034
Table 52: East Asia Market Volume (Units) Forecast by Material, 2019 to 2034
Table 53: East Asia Market Value (US$ Million) Forecast by Packaging Format, 2019 to 2034
Table 54: East Asia Market Volume (Units) Forecast by Packaging Format, 2019 to 2034
Table 55: East Asia Market Value (US$ Million) Forecast by End Use, 2019 to 2034
Table 56: East Asia Market Volume (Units) Forecast by End Use, 2019 to 2034
Table 57: Middle East and Africa Market Value (US$ Million) Forecast by Country, 2019 to 2034
Table 58: Middle East and Africa Market Volume (Units) Forecast by Country, 2019 to 2034
Table 59: Middle East and Africa Market Value (US$ Million) Forecast by Material, 2019 to 2034
Table 60: Middle East and Africa Market Volume (Units) Forecast by Material, 2019 to 2034
Table 61: Middle East and Africa Market Value (US$ Million) Forecast by Packaging Format, 2019 to 2034
Table 62: Middle East and Africa Market Volume (Units) Forecast by Packaging Format, 2019 to 2034
Table 63: Middle East and Africa Market Value (US$ Million) Forecast by End Use, 2019 to 2034
Table 64: Middle East and Africa Market Volume (Units) Forecast by End Use, 2019 to 2034
Figure 1: Global Market Value (US$ Million) by Material, 2024 to 2034
Figure 2: Global Market Value (US$ Million) by Packaging Format, 2024 to 2034
Figure 3: Global Market Value (US$ Million) by End Use, 2024 to 2034
Figure 4: Global Market Value (US$ Million) by Region, 2024 to 2034
Figure 5: Global Market Value (US$ Million) Analysis by Region, 2019 to 2034
Figure 6: Global Market Volume (Units) Analysis by Region, 2019 to 2034
Figure 7: Global Market Value Share (%) and BPS Analysis by Region, 2024 to 2034
Figure 8: Global Market Y-o-Y Growth (%) Projections by Region, 2024 to 2034
Figure 9: Global Market Value (US$ Million) Analysis by Material, 2019 to 2034
Figure 10: Global Market Volume (Units) Analysis by Material, 2019 to 2034
Figure 11: Global Market Value Share (%) and BPS Analysis by Material, 2024 to 2034
Figure 12: Global Market Y-o-Y Growth (%) Projections by Material, 2024 to 2034
Figure 13: Global Market Value (US$ Million) Analysis by Packaging Format, 2019 to 2034
Figure 14: Global Market Volume (Units) Analysis by Packaging Format, 2019 to 2034
Figure 15: Global Market Value Share (%) and BPS Analysis by Packaging Format, 2024 to 2034
Figure 16: Global Market Y-o-Y Growth (%) Projections by Packaging Format, 2024 to 2034
Figure 17: Global Market Value (US$ Million) Analysis by End Use, 2019 to 2034
Figure 18: Global Market Volume (Units) Analysis by End Use, 2019 to 2034
Figure 19: Global Market Value Share (%) and BPS Analysis by End Use, 2024 to 2034
Figure 20: Global Market Y-o-Y Growth (%) Projections by End Use, 2024 to 2034
Figure 21: Global Market Attractiveness by Material, 2024 to 2034
Figure 22: Global Market Attractiveness by Packaging Format, 2024 to 2034
Figure 23: Global Market Attractiveness by End Use, 2024 to 2034
Figure 24: Global Market Attractiveness by Region, 2024 to 2034
Figure 25: North America Market Value (US$ Million) by Material, 2024 to 2034
Figure 26: North America Market Value (US$ Million) by Packaging Format, 2024 to 2034
Figure 27: North America Market Value (US$ Million) by End Use, 2024 to 2034
Figure 28: North America Market Value (US$ Million) by Country, 2024 to 2034
Figure 29: North America Market Value (US$ Million) Analysis by Country, 2019 to 2034
Figure 30: North America Market Volume (Units) Analysis by Country, 2019 to 2034
Figure 31: North America Market Value Share (%) and BPS Analysis by Country, 2024 to 2034
Figure 32: North America Market Y-o-Y Growth (%) Projections by Country, 2024 to 2034
Figure 33: North America Market Value (US$ Million) Analysis by Material, 2019 to 2034
Figure 34: North America Market Volume (Units) Analysis by Material, 2019 to 2034
Figure 35: North America Market Value Share (%) and BPS Analysis by Material, 2024 to 2034
Figure 36: North America Market Y-o-Y Growth (%) Projections by Material, 2024 to 2034
Figure 37: North America Market Value (US$ Million) Analysis by Packaging Format, 2019 to 2034
Figure 38: North America Market Volume (Units) Analysis by Packaging Format, 2019 to 2034
Figure 39: North America Market Value Share (%) and BPS Analysis by Packaging Format, 2024 to 2034
Figure 40: North America Market Y-o-Y Growth (%) Projections by Packaging Format, 2024 to 2034
Figure 41: North America Market Value (US$ Million) Analysis by End Use, 2019 to 2034
Figure 42: North America Market Volume (Units) Analysis by End Use, 2019 to 2034
Figure 43: North America Market Value Share (%) and BPS Analysis by End Use, 2024 to 2034
Figure 44: North America Market Y-o-Y Growth (%) Projections by End Use, 2024 to 2034
Figure 45: North America Market Attractiveness by Material, 2024 to 2034
Figure 46: North America Market Attractiveness by Packaging Format, 2024 to 2034
Figure 47: North America Market Attractiveness by End Use, 2024 to 2034
Figure 48: North America Market Attractiveness by Country, 2024 to 2034
Figure 49: Latin America Market Value (US$ Million) by Material, 2024 to 2034
Figure 50: Latin America Market Value (US$ Million) by Packaging Format, 2024 to 2034
Figure 51: Latin America Market Value (US$ Million) by End Use, 2024 to 2034
Figure 52: Latin America Market Value (US$ Million) by Country, 2024 to 2034
Figure 53: Latin America Market Value (US$ Million) Analysis by Country, 2019 to 2034
Figure 54: Latin America Market Volume (Units) Analysis by Country, 2019 to 2034
Figure 55: Latin America Market Value Share (%) and BPS Analysis by Country, 2024 to 2034
Figure 56: Latin America Market Y-o-Y Growth (%) Projections by Country, 2024 to 2034
Figure 57: Latin America Market Value (US$ Million) Analysis by Material, 2019 to 2034
Figure 58: Latin America Market Volume (Units) Analysis by Material, 2019 to 2034
Figure 59: Latin America Market Value Share (%) and BPS Analysis by Material, 2024 to 2034
Figure 60: Latin America Market Y-o-Y Growth (%) Projections by Material, 2024 to 2034
Figure 61: Latin America Market Value (US$ Million) Analysis by Packaging Format, 2019 to 2034
Figure 62: Latin America Market Volume (Units) Analysis by Packaging Format, 2019 to 2034
Figure 63: Latin America Market Value Share (%) and BPS Analysis by Packaging Format, 2024 to 2034
Figure 64: Latin America Market Y-o-Y Growth (%) Projections by Packaging Format, 2024 to 2034
Figure 65: Latin America Market Value (US$ Million) Analysis by End Use, 2019 to 2034
Figure 66: Latin America Market Volume (Units) Analysis by End Use, 2019 to 2034
Figure 67: Latin America Market Value Share (%) and BPS Analysis by End Use, 2024 to 2034
Figure 68: Latin America Market Y-o-Y Growth (%) Projections by End Use, 2024 to 2034
Figure 69: Latin America Market Attractiveness by Material, 2024 to 2034
Figure 70: Latin America Market Attractiveness by Packaging Format, 2024 to 2034
Figure 71: Latin America Market Attractiveness by End Use, 2024 to 2034
Figure 72: Latin America Market Attractiveness by Country, 2024 to 2034
Figure 73: Western Europe Market Value (US$ Million) by Material, 2024 to 2034
Figure 74: Western Europe Market Value (US$ Million) by Packaging Format, 2024 to 2034
Figure 75: Western Europe Market Value (US$ Million) by End Use, 2024 to 2034
Figure 76: Western Europe Market Value (US$ Million) by Country, 2024 to 2034
Figure 77: Western Europe Market Value (US$ Million) Analysis by Country, 2019 to 2034
Figure 78: Western Europe Market Volume (Units) Analysis by Country, 2019 to 2034
Figure 79: Western Europe Market Value Share (%) and BPS Analysis by Country, 2024 to 2034
Figure 80: Western Europe Market Y-o-Y Growth (%) Projections by Country, 2024 to 2034
Figure 81: Western Europe Market Value (US$ Million) Analysis by Material, 2019 to 2034
Figure 82: Western Europe Market Volume (Units) Analysis by Material, 2019 to 2034
Figure 83: Western Europe Market Value Share (%) and BPS Analysis by Material, 2024 to 2034
Figure 84: Western Europe Market Y-o-Y Growth (%) Projections by Material, 2024 to 2034
Figure 85: Western Europe Market Value (US$ Million) Analysis by Packaging Format, 2019 to 2034
Figure 86: Western Europe Market Volume (Units) Analysis by Packaging Format, 2019 to 2034
Figure 87: Western Europe Market Value Share (%) and BPS Analysis by Packaging Format, 2024 to 2034
Figure 88: Western Europe Market Y-o-Y Growth (%) Projections by Packaging Format, 2024 to 2034
Figure 89: Western Europe Market Value (US$ Million) Analysis by End Use, 2019 to 2034
Figure 90: Western Europe Market Volume (Units) Analysis by End Use, 2019 to 2034
Figure 91: Western Europe Market Value Share (%) and BPS Analysis by End Use, 2024 to 2034
Figure 92: Western Europe Market Y-o-Y Growth (%) Projections by End Use, 2024 to 2034
Figure 93: Western Europe Market Attractiveness by Material, 2024 to 2034
Figure 94: Western Europe Market Attractiveness by Packaging Format, 2024 to 2034
Figure 95: Western Europe Market Attractiveness by End Use, 2024 to 2034
Figure 96: Western Europe Market Attractiveness by Country, 2024 to 2034
Figure 97: Eastern Europe Market Value (US$ Million) by Material, 2024 to 2034
Figure 98: Eastern Europe Market Value (US$ Million) by Packaging Format, 2024 to 2034
Figure 99: Eastern Europe Market Value (US$ Million) by End Use, 2024 to 2034
Figure 100: Eastern Europe Market Value (US$ Million) by Country, 2024 to 2034
Figure 101: Eastern Europe Market Value (US$ Million) Analysis by Country, 2019 to 2034
Figure 102: Eastern Europe Market Volume (Units) Analysis by Country, 2019 to 2034
Figure 103: Eastern Europe Market Value Share (%) and BPS Analysis by Country, 2024 to 2034
Figure 104: Eastern Europe Market Y-o-Y Growth (%) Projections by Country, 2024 to 2034
Figure 105: Eastern Europe Market Value (US$ Million) Analysis by Material, 2019 to 2034
Figure 106: Eastern Europe Market Volume (Units) Analysis by Material, 2019 to 2034
Figure 107: Eastern Europe Market Value Share (%) and BPS Analysis by Material, 2024 to 2034
Figure 108: Eastern Europe Market Y-o-Y Growth (%) Projections by Material, 2024 to 2034
Figure 109: Eastern Europe Market Value (US$ Million) Analysis by Packaging Format, 2019 to 2034
Figure 110: Eastern Europe Market Volume (Units) Analysis by Packaging Format, 2019 to 2034
Figure 111: Eastern Europe Market Value Share (%) and BPS Analysis by Packaging Format, 2024 to 2034
Figure 112: Eastern Europe Market Y-o-Y Growth (%) Projections by Packaging Format, 2024 to 2034
Figure 113: Eastern Europe Market Value (US$ Million) Analysis by End Use, 2019 to 2034
Figure 114: Eastern Europe Market Volume (Units) Analysis by End Use, 2019 to 2034
Figure 115: Eastern Europe Market Value Share (%) and BPS Analysis by End Use, 2024 to 2034
Figure 116: Eastern Europe Market Y-o-Y Growth (%) Projections by End Use, 2024 to 2034
Figure 117: Eastern Europe Market Attractiveness by Material, 2024 to 2034
Figure 118: Eastern Europe Market Attractiveness by Packaging Format, 2024 to 2034
Figure 119: Eastern Europe Market Attractiveness by End Use, 2024 to 2034
Figure 120: Eastern Europe Market Attractiveness by Country, 2024 to 2034
Figure 121: South Asia and Pacific Market Value (US$ Million) by Material, 2024 to 2034
Figure 122: South Asia and Pacific Market Value (US$ Million) by Packaging Format, 2024 to 2034
Figure 123: South Asia and Pacific Market Value (US$ Million) by End Use, 2024 to 2034
Figure 124: South Asia and Pacific Market Value (US$ Million) by Country, 2024 to 2034
Figure 125: South Asia and Pacific Market Value (US$ Million) Analysis by Country, 2019 to 2034
Figure 126: South Asia and Pacific Market Volume (Units) Analysis by Country, 2019 to 2034
Figure 127: South Asia and Pacific Market Value Share (%) and BPS Analysis by Country, 2024 to 2034
Figure 128: South Asia and Pacific Market Y-o-Y Growth (%) Projections by Country, 2024 to 2034
Figure 129: South Asia and Pacific Market Value (US$ Million) Analysis by Material, 2019 to 2034
Figure 130: South Asia and Pacific Market Volume (Units) Analysis by Material, 2019 to 2034
Figure 131: South Asia and Pacific Market Value Share (%) and BPS Analysis by Material, 2024 to 2034
Figure 132: South Asia and Pacific Market Y-o-Y Growth (%) Projections by Material, 2024 to 2034
Figure 133: South Asia and Pacific Market Value (US$ Million) Analysis by Packaging Format, 2019 to 2034
Figure 134: South Asia and Pacific Market Volume (Units) Analysis by Packaging Format, 2019 to 2034
Figure 135: South Asia and Pacific Market Value Share (%) and BPS Analysis by Packaging Format, 2024 to 2034
Figure 136: South Asia and Pacific Market Y-o-Y Growth (%) Projections by Packaging Format, 2024 to 2034
Figure 137: South Asia and Pacific Market Value (US$ Million) Analysis by End Use, 2019 to 2034
Figure 138: South Asia and Pacific Market Volume (Units) Analysis by End Use, 2019 to 2034
Figure 139: South Asia and Pacific Market Value Share (%) and BPS Analysis by End Use, 2024 to 2034
Figure 140: South Asia and Pacific Market Y-o-Y Growth (%) Projections by End Use, 2024 to 2034
Figure 141: South Asia and Pacific Market Attractiveness by Material, 2024 to 2034
Figure 142: South Asia and Pacific Market Attractiveness by Packaging Format, 2024 to 2034
Figure 143: South Asia and Pacific Market Attractiveness by End Use, 2024 to 2034
Figure 144: South Asia and Pacific Market Attractiveness by Country, 2024 to 2034
Figure 145: East Asia Market Value (US$ Million) by Material, 2024 to 2034
Figure 146: East Asia Market Value (US$ Million) by Packaging Format, 2024 to 2034
Figure 147: East Asia Market Value (US$ Million) by End Use, 2024 to 2034
Figure 148: East Asia Market Value (US$ Million) by Country, 2024 to 2034
Figure 149: East Asia Market Value (US$ Million) Analysis by Country, 2019 to 2034
Figure 150: East Asia Market Volume (Units) Analysis by Country, 2019 to 2034
Figure 151: East Asia Market Value Share (%) and BPS Analysis by Country, 2024 to 2034
Figure 152: East Asia Market Y-o-Y Growth (%) Projections by Country, 2024 to 2034
Figure 153: East Asia Market Value (US$ Million) Analysis by Material, 2019 to 2034
Figure 154: East Asia Market Volume (Units) Analysis by Material, 2019 to 2034
Figure 155: East Asia Market Value Share (%) and BPS Analysis by Material, 2024 to 2034
Figure 156: East Asia Market Y-o-Y Growth (%) Projections by Material, 2024 to 2034
Figure 157: East Asia Market Value (US$ Million) Analysis by Packaging Format, 2019 to 2034
Figure 158: East Asia Market Volume (Units) Analysis by Packaging Format, 2019 to 2034
Figure 159: East Asia Market Value Share (%) and BPS Analysis by Packaging Format, 2024 to 2034
Figure 160: East Asia Market Y-o-Y Growth (%) Projections by Packaging Format, 2024 to 2034
Figure 161: East Asia Market Value (US$ Million) Analysis by End Use, 2019 to 2034
Figure 162: East Asia Market Volume (Units) Analysis by End Use, 2019 to 2034
Figure 163: East Asia Market Value Share (%) and BPS Analysis by End Use, 2024 to 2034
Figure 164: East Asia Market Y-o-Y Growth (%) Projections by End Use, 2024 to 2034
Figure 165: East Asia Market Attractiveness by Material, 2024 to 2034
Figure 166: East Asia Market Attractiveness by Packaging Format, 2024 to 2034
Figure 167: East Asia Market Attractiveness by End Use, 2024 to 2034
Figure 168: East Asia Market Attractiveness by Country, 2024 to 2034
Figure 169: Middle East and Africa Market Value (US$ Million) by Material, 2024 to 2034
Figure 170: Middle East and Africa Market Value (US$ Million) by Packaging Format, 2024 to 2034
Figure 171: Middle East and Africa Market Value (US$ Million) by End Use, 2024 to 2034
Figure 172: Middle East and Africa Market Value (US$ Million) by Country, 2024 to 2034
Figure 173: Middle East and Africa Market Value (US$ Million) Analysis by Country, 2019 to 2034
Figure 174: Middle East and Africa Market Volume (Units) Analysis by Country, 2019 to 2034
Figure 175: Middle East and Africa Market Value Share (%) and BPS Analysis by Country, 2024 to 2034
Figure 176: Middle East and Africa Market Y-o-Y Growth (%) Projections by Country, 2024 to 2034
Figure 177: Middle East and Africa Market Value (US$ Million) Analysis by Material, 2019 to 2034
Figure 178: Middle East and Africa Market Volume (Units) Analysis by Material, 2019 to 2034
Figure 179: Middle East and Africa Market Value Share (%) and BPS Analysis by Material, 2024 to 2034
Figure 180: Middle East and Africa Market Y-o-Y Growth (%) Projections by Material, 2024 to 2034
Figure 181: Middle East and Africa Market Value (US$ Million) Analysis by Packaging Format, 2019 to 2034
Figure 182: Middle East and Africa Market Volume (Units) Analysis by Packaging Format, 2019 to 2034
Figure 183: Middle East and Africa Market Value Share (%) and BPS Analysis by Packaging Format, 2024 to 2034
Figure 184: Middle East and Africa Market Y-o-Y Growth (%) Projections by Packaging Format, 2024 to 2034
Figure 185: Middle East and Africa Market Value (US$ Million) Analysis by End Use, 2019 to 2034
Figure 186: Middle East and Africa Market Volume (Units) Analysis by End Use, 2019 to 2034
Figure 187: Middle East and Africa Market Value Share (%) and BPS Analysis by End Use, 2024 to 2034
Figure 188: Middle East and Africa Market Y-o-Y Growth (%) Projections by End Use, 2024 to 2034
Figure 189: Middle East and Africa Market Attractiveness by Material, 2024 to 2034
Figure 190: Middle East and Africa Market Attractiveness by Packaging Format, 2024 to 2034
Figure 191: Middle East and Africa Market Attractiveness by End Use, 2024 to 2034
Figure 192: Middle East and Africa Market Attractiveness by Country, 2024 to 2034
The global shipping supply market is set to grow at a CAGR of 3.7% during the forecast period.
The global shipping supply market is predicted to be valued at USD 145.5 billion by 2034.
The global shipping supply market was valued at USD 97.2 billion in 2023.
Uline, Stamar, and UWAY are a few of the leading shipping supply manufacturers.
The market in India is predicted to witness a CAGR of 6.4% through 2034.
Explore Similar Insights
Thank you!
You will receive an email from our Business Development Manager. Please be sure to check your SPAM/JUNK folder too.