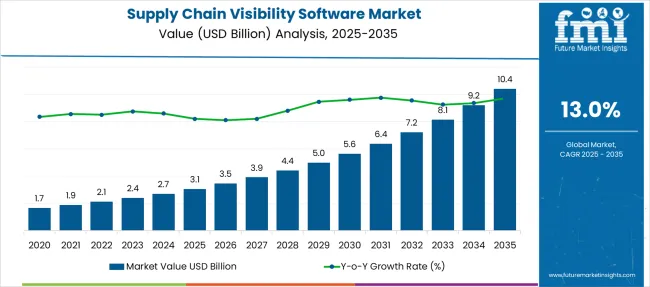
The Supply Chain Visibility Software Market is estimated to be valued at USD 3.1 billion in 2025 and is projected to reach USD 10.4 billion by 2035, registering a compound annual growth rate (CAGR) of 13.0% over the forecast period. Between 2025 and 2030, the year-on-year growth remains relatively steady, ranging from USD 0.4 billion to USD 0.6 billion annually. This initial phase reflects a moderate pace where enterprises begin prioritizing real-time logistics tracking, inventory synchronization, and vendor performance dashboards. Companies such as FourKites and project44 have extended their platform integration capabilities, allowing retailers and manufacturers to improve delivery predictability while reducing supply risk. The market’s shape during this phase exhibits a consistent incline, without sharp jumps, indicating stable demand and standard enterprise adoption cycles.
From 2030 to 2035, year-on-year gains become more pronounced, increasing by USD 0.8 billion to USD 1.2 billion annually. This growth pattern is attributed to heightened demand for advanced analytics, IoT-linked tracking modules, and cross-border compliance tools. Tools developed by Infor Nexus and SAP have been adopted by multi-regional firms aiming to consolidate procurement intelligence across global warehousing and transport nodes. The acceleration in value during this phase suggests a growing preference for modular and cloud-native solutions capable of delivering predictive logistics, resilience alerts, and multi-tier supplier mapping. The YoY trend reflects rising investment intent and extended deployment timelines across both mid-size and large enterprises.
| Metric | Value |
|---|---|
| Supply Chain Visibility Software Market Estimated Value in (2025 E) | USD 3.1 billion |
| Supply Chain Visibility Software Market Forecast Value in (2035 F) | USD 10.4 billion |
| Forecast CAGR (2025 to 2035) | 13.0% |
The supply chain visibility software market operates across five interconnected parent sectors. Logistics and transportation systems contribute around 30%, where shipment tracking and route optimization rely on visibility platforms. Enterprise resource planning systems account for nearly 28%, driven by integration of procurement, inventory, and production data into a unified view.
Warehouse management systems represent close to 20%, with adoption focusing on tracking inbound goods, storage, and order fulfillment. Approximately 15% comes from supply chain analytics, where visibility enables real-time modeling and performance forecasting. The remaining 7% stems from third-party logistics providers, which embed visibility features into client-facing services. These five markets shape demand by emphasizing operational transparency, improved delivery accuracy, and cross-platform coordination throughout the logistics, manufacturing, and distribution ecosystem.
The industry is evolving rapidly as real-time intelligence and predictive capabilities become essential for managing global operations. AI and machine learning are being used to detect disruptions, forecast demand shifts, and optimize inventory flow across multi-tier networks.
IoT-enabled tracking devices provide continuous monitoring of goods through GPS, RFID, and sensor-based inputs, improving traceability across transportation modes. Blockchain technology is being adopted to secure data integrity and improve transparency in supplier transactions. Cloud-based platforms are enabling centralized access, faster deployment, and better integration with ERP systems. Sustainability features such as carbon tracking and ethical sourcing validation are gaining traction.
Enterprises are actively pursuing digital transformation strategies that integrate advanced visibility platforms across logistics, inventory, and procurement functions. Supply chain transparency is being prioritized to comply with ESG mandates, combat counterfeiting, and enhance multi-tier supplier collaboration. The post-pandemic emphasis on risk reduction and responsiveness has reinforced the need for cloud-based platforms that support dynamic, end-to-end network monitoring.
Regulatory frameworks such as traceability standards in pharmaceuticals, food, and electronics are further accelerating software adoption. Integration of AI, IoT, and blockchain technologies is expected to strengthen platform capabilities, enabling smarter decision-making and improved resilience across global value chains.
The supply chain visibility software market is segmented by component type, deployment model, enterprise size, application type, industry vertical, and region. By component type, the segmentation includes software, services, consulting, implementation, and support and maintenance, addressing different stages of solution delivery. In terms of deployment model, the market is categorized into cloud and on-premises options, supporting diverse IT infrastructures. Based on enterprise size, it is classified into large enterprises and SMEs, indicating adoption across varied organizational scales.
By application type, the market encompasses inventory management, order management, asset tracking, shipment tracking, supply chain planning, and other related processes. Industry vertical segmentation includes transportation and logistics, retail and consumer goods, healthcare and pharmaceuticals, manufacturing, automotive, aerospace and defense, food and beverage, and additional sectors. Regionally, the market spans North America, Latin America, Western and Eastern Europe, Balkan and Baltic countries, Russia and Belarus, Central Asia, East Asia, South Asia and Pacific, and the Middle East and Africa.
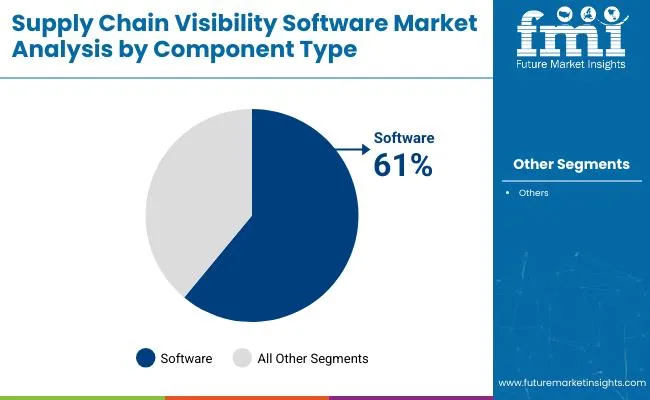
Software is projected to hold 61.0% of the total market revenue in 2025, making it the dominant component type in the supply chain visibility software landscape. This leadership is driven by increasing adoption of integrated dashboards, analytics engines, and real-time tracking systems that offer centralized visibility across complex, multi-node supply networks.
Software platforms are being preferred due to their flexibility in configuration, compatibility with existing ERP systems, and support for automation across order management and inventory functions. The rise of supply chain control towers and digital twins has further expanded demand for advanced software modules capable of scenario planning, exception management, and sustainability reporting.
As organizations prioritize digital infrastructure that enables data-driven insights, the software segment is expected to maintain its lead in delivering scalability and cross-border transparency.
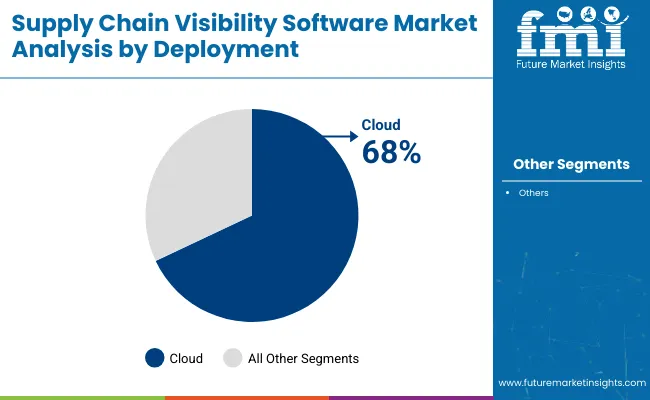
Cloud deployment is expected to account for 68.0% of the market revenue in 2025, establishing it as the leading deployment model. This segment’s dominance is being driven by its cost efficiency, scalability, and ease of remote access across global operations.
Cloud-based platforms facilitate seamless integration with logistics partners, carriers, and suppliers, enabling real-time data exchange and collaborative workflows. As enterprises increasingly shift toward distributed and hybrid supply chain models, the flexibility and low upfront investment associated with cloud solutions have proven essential.
Cybersecurity advancements and adherence to global compliance frameworks have improved confidence in cloud environments, further accelerating their adoption. In a market defined by rapid demand fluctuations and geopolitical risks, cloud-based visibility tools are enabling faster response times and continuous process optimization..
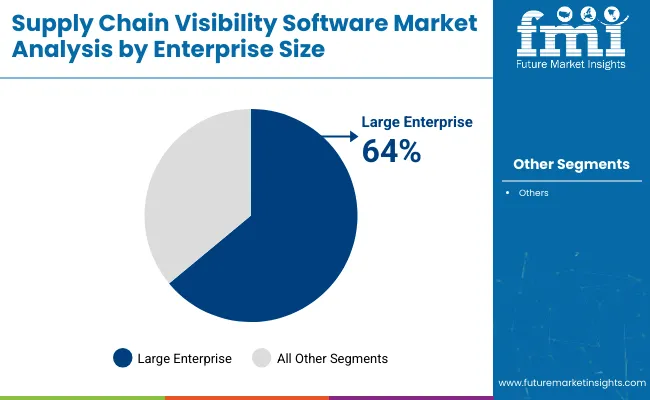
Large enterprises are forecast to represent 64.0% of the market revenue in 2025, making them the leading customer segment in the supply chain visibility software market. Their dominance is attributed to the scale and complexity of their supply chains, which span multiple regions, suppliers, and transportation nodes.
These enterprises have greater budget flexibility to invest in advanced analytics platforms, control towers, and AI-enabled insights that support predictive and prescriptive decision-making. Compliance requirements, global customer demands, and internal performance benchmarks have driven the need for integrated visibility platforms that can manage high transaction volumes and multi-tier risk exposure.
Large enterprises are increasingly investing in digital sustainability tracking and carbon footprint analytics, functions best served by sophisticated software solutions. This continued focus on digital supply chain orchestration is expected to reinforce their leadership position.
The integration of IoT sensors, AI-powered analytics, and blockchain frameworks is enabling comprehensive monitoring of goods flow, inventory levels, and production processes across global supply networks. Adoption is most prominent in automotive, pharmaceutical, and retail sectors, where precision in inventory management, risk control, and regulatory compliance is essential.
Modern SCV solutions incorporate interactive digital dashboards, predictive alerting systems, and seamless interoperability with transportation and warehouse management platforms, which collectively enhance operational resilience and minimize disruption risks.
Enterprises are investing in visibility solutions to ensure end-to-end shipment traceability, minimize disruptions, and maintain compliance with cross-border regulations. Event-based alerts for route deviations, cold chain failures, and customs delays help mitigate risks and improve operational decisions. Industries handling high-value goods such as electronics and pharmaceuticals have accelerated adoption to ensure the integrity of goods across transit.
Integration of IoT sensors and connected GPS devices is providing accurate data streams to centralized dashboards. Platforms offering compliance automation for trade documentation and safety certifications have simplified audits and reduced delays. As businesses transition to multi-modal and global networks, digital visibility has become a strategic priority for cost control and timely delivery.
Despite growing adoption, many organizations face difficulties in consolidating data from diverse sources, including carriers, ports, and suppliers. Fragmented ecosystems create inconsistencies in shipment status updates and delay event notifications, impacting decision-making accuracy. Integrating visibility software with legacy enterprise systems like ERP and WMS requires significant customization and high upfront investment. Data security concerns persist as platforms exchange sensitive trade and supplier information across multiple regions.
Variability in digital maturity among supply chain partners limits real-time collaboration and predictive modelling. Additionally, compliance differences across countries complicate software configuration and increase implementation timelines, making adoption challenging for small and mid-sized enterprises operating under cost constraints.
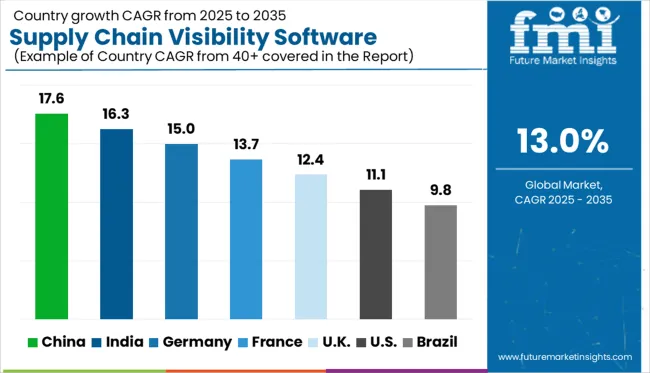
| Country | CAGR |
|---|---|
| China | 17.6% |
| India | 16.3% |
| Germany | 15.0% |
| France | 13.7% |
| UK | 12.4% |
| USA | 11.1% |
| Brazil | 9.8% |
The supply chain visibility software market is projected to grow at a 13% CAGR from 2025 to 2035, driven by heightened demand for real-time tracking, predictive analytics, and multi-tier supply transparency. China leads with 17.6%, propelled by e-commerce ecosystems, manufacturing exports, and AI-enabled logistics platforms. India follows at 16.3%, supported by government-led digital logistics programs and 3PL adoption across retail and automotive sectors. Germany, at 15.0%, emphasizes SCV deployment in industrial IoT-integrated manufacturing networks and compliance-driven supply operations. France grows at 13.7%, leveraging SCV in luxury goods, pharma cold chains, and food traceability programs. The United Kingdom, at 12.4%, focuses on SCV integration in retail, FMCG, and warehouse automation post-Brexit, ensuring regulatory alignment and customs optimization. The report includes an analysis of over 40 countries, with key countries profiled below for reference.
China is expected to grow at a 17.6% CAGR, leading global SCV adoption with real-time visibility platforms integrated across e-commerce and manufacturing ecosystems. Major logistics providers deploy AI-enabled route optimization, predictive analytics, and IoT tracking for multi-modal shipments. Cross-border trade and compliance-driven transparency for export markets fuel demand for integrated SCV dashboards. SCV solutions are embedded into ERP systems by large enterprises to synchronize production schedules and inventory flows. Domestic tech giants and SaaS providers are expanding cloud-based SCV platforms tailored for SMEs, further accelerating adoption across the value chain.
Adoption of SCV software in India is forecast to grow at a 16.3% CAGR, driven by e-commerce expansion, government-led logistics digitization, and the rollout of the Unified Logistics Interface Platform (ULIP). Multi-tier tracking is becoming standard in pharma cold chains and food supply networks. Tech-enabled logistics players deploy SCV for last-mile visibility and dynamic rerouting. SaaS models offering API-based integration with transport management systems and customs platforms are gaining traction. Private equity investments in SCV-focused startups underline India’s shift toward real-time, compliance-ready supply networks. Demand from FMCG and automotive OEMs remains dominant, reinforced by GST-based multi-warehouse optimization needs.
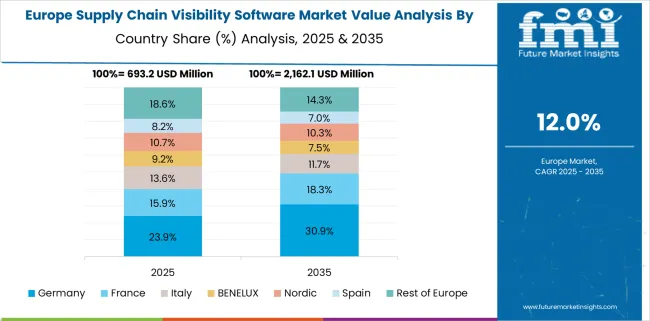
Germany is projected to expand at a 15.0% CAGR, supported by Industry 4.0 adoption and integration of SCV software with IoT-driven production lines. Automotive and heavy machinery sectors implement SCV systems to enable predictive supply planning and compliance tracking under EU trade norms. Real-time dashboards connected with RFID and telematics enhance traceability across inbound and outbound flows. SCV platforms are integrated with advanced warehouse execution systems to streamline cross-docking and order fulfillment. Strategic investments focus on AI-powered demand forecasting combined with supplier risk analytics. Cybersecurity integration is prioritized to protect SCV data exchange in interconnected manufacturing ecosystems.
France is expected to grow at a 13.7% CAGR, driven by SCV applications in luxury goods, food traceability, and healthcare supply networks. Retailers and logistics providers are implementing visibility software to ensure compliance with EU labeling, temperature control, and origin traceability mandates. Cloud-based SCV solutions integrated with ERP and TMS platforms dominate enterprise adoption models. Investments in AI for demand sensing and blockchain for authenticity verification in wine and luxury segments are gaining traction. France’s strong export market for perishable goods has accelerated SCV adoption in cold chain networks, aligning with EU Green Deal sustainability metrics.
The United Kingdom is forecast to grow at a 12.4% CAGR, with SCV adoption accelerated by post-Brexit customs complexities and retail omnichannel expansion. Retail and FMCG players prioritize SCV for real-time shipment visibility and customs clearance optimization. Integration of SCV tools with warehouse automation and robotics is shaping next-generation distribution centers. Cloud-native SCV solutions offering predictive analytics for inventory optimization and demand fluctuations are in high demand. Third-party logistics (3PL) providers deploy API-based visibility tools for multi-carrier orchestration. SCV innovation aligns with UK regulatory focus on transparent trade flows and carbon reduction reporting for supply networks.
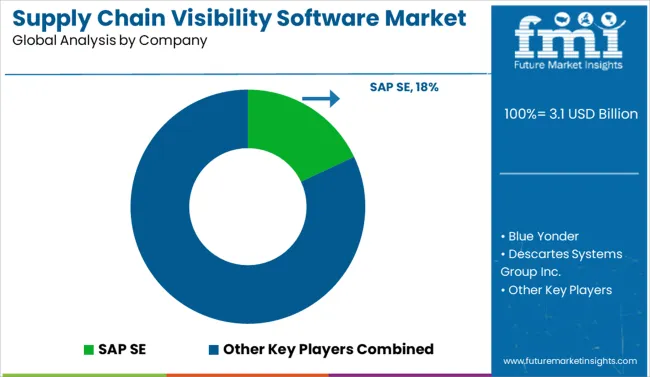
The SCV software market is moderately consolidated, led by SAP SE, which commands a leading position with deep integration of AI-enabled tracking modules and advanced analytics across its ERP ecosystem. Oracle, IBM, and Blue Yonder follow closely, focusing on predictive insights and cloud-native architectures for end-to-end visibility. Blue Yonder, bolstered by Panasonic’s investment, emphasizes machine learning for demand-supply orchestration, positioning itself as a pioneer in predictive analytics for real-time logistics decision-making.
FourKites emerges as a specialist player, managing over three million shipments daily across multi-modal transport and providing advanced ML-based ETA predictions, giving it a strong edge in real-time insights. Kinaxis leverages visibility data to power concurrent planning and risk mitigation, complementing its core S&OP and supply chain planning suite. Vendors like Descartes, Infor, Epicor, and Manhattan Associates differentiate through modular SCV components integrated with ERP, WMS, and TMS platforms, appealing to mid-market enterprises seeking interoperability without full-suite replacements.
Competitive differentiation is increasingly driven by API-driven interoperability, predictive ETA accuracy, compliance frameworks, and vertical-specific customization. Partnerships with IoT device manufacturers, integration of blockchain for traceability, and AI-driven risk forecasting are emerging as key strategic levers for sustaining market leadership.
In August 2024, FourKites introduced its YardWorks™ suite of solutions, featuring advanced AI-driven tools for gate and yard optimization, along with strategic partnerships and investments aimed at transforming facilities management and improving operational efficiency.
| Item | Value |
|---|---|
| Quantitative Units | USD 3.1 Billion |
| Component Type | Software, Services, Consulting, Implementation, and Support & maintenance |
| Deployment Model | Cloud and On-premises |
| Enterprise Size | Large enterprises and SME |
| Application Type | Inventory management, Order management, Asset tracking, Shipment tracking, Supply chain planning, and Others |
| Industry Vertical | Transportation and logistics, Retail and consumer goods, Healthcare and pharmaceuticals, Manufacturing, Automotive, Aerospace and defense, Food and beverage, and Others |
| Regions Covered | North America, Europe, Asia-Pacific, Latin America, Middle East & Africa |
| Country Covered | United States, Canada, Germany, France, United Kingdom, China, Japan, India, Brazil, South Africa |
| Key Companies Profiled | SAP SE, Blue Yonder, Descartes Systems Group Inc., Epicor Software Corporation, FourKites, Inc., IBM Corporation, Infor, Kinaxis, Manhattan Associates, Inc., and Oracle Corporation |
| Additional Attributes | Dollar sales in supply chain visibility software are segmented by deployment model, with cloud-based solutions dominating due to scalability and cost efficiency. Demand is accelerating for real-time tracking, predictive analytics, and collaborative workflow tools. Key sectors include retail, healthcare, manufacturing, and logistics, where visibility is critical for compliance and performance optimization. Major players are integrating AI, blockchain, and machine learning to enhance transparency and predictive accuracy. Adoption is strongest in North America and Europe, driven by regulatory mandates, customs compliance, and the need for operational efficiency in multi-tier supply chains. |
The global supply chain visibility software market is estimated to be valued at USD 3.1 billion in 2025.
The market size for the supply chain visibility software market is projected to reach USD 10.4 billion by 2035.
The supply chain visibility software market is expected to grow at a 13.0% CAGR between 2025 and 2035.
The key product types in supply chain visibility software market are software, services, consulting, implementation and support & maintenance.
In terms of deployment model, cloud segment to command 68.0% share in the supply chain visibility software market in 2025.


Full Research Suite comprises of:
Market outlook & trends analysis
Interviews & case studies
Strategic recommendations
Vendor profiles & capabilities analysis
5-year forecasts
8 regions and 60+ country-level data splits
Market segment data splits
12 months of continuous data updates
DELIVERED AS:
PDF EXCEL ONLINE
Supply Chain Analytics Market Size and Share Forecast Outlook 2025 to 2035
Supply Chain Management Market Size and Share Forecast Outlook 2025 to 2035
Supply Chain Management BPO Market Analysis 2025 to 2035 by Outsourcing Model, Application, Service Type, Enterprise Size & Region
Power Supply Equipment for Data Center Market Size and Share Forecast Outlook 2025 to 2035
Power Supply Isolation Equipment Market Size and Share Forecast Outlook 2025 to 2035
Office Supply Market Forecast and Outlook 2025 to 2035
IoT in Supply Chain Market Insights – Trends, Growth & Forecast 2023-2033
Shipping Supply Market Size and Share Forecast Outlook 2025 to 2035
DC Power Supply Module Market – Powering IoT & Electronics
Packaging Supply Market Insights - Growth & Forecast 2024 to 2034
Cognitive Supply Chain Market Forecast Outlook 2025 to 2035
Commodity Supply Chain Management Solution Market Size and Share Forecast Outlook 2025 to 2035
Aviation Power Supply Market Size and Share Forecast Outlook 2025 to 2035
Industrial Power Supply Market Size and Share Forecast Outlook 2025 to 2035
Ammonium Sulphate Supply Market-Trends & Forecast 2025 to 2035
Switching Mode Power Supply Market - Growth & Forecast 2025 to 2035
Digital Transformation in Supply Chain Market
SBOM Management and Software Supply Chain Compliance Market Analysis - Size, Share, and Forecast Outlook 2025 to 2035
PVC-M High Impact Resistant Water Supply Pipe Market Size and Share Forecast Outlook 2025 to 2035
High Voltage Direct Current Power Supply Market Size and Share Forecast Outlook 2025 to 2035

Thank you!
You will receive an email from our Business Development Manager. Please be sure to check your SPAM/JUNK folder too.
Chat With
MaRIA