Supply Chain Analytics Market Outlook from 2025 to 2035

The supply chain analytics market is undergoing rapid evolution, driven by heightened demand for operational visibility, cost optimization, and data-driven decision-making across industries. Digital transformation initiatives, accelerated by post-pandemic supply disruptions, have led enterprises to adopt advanced analytics to mitigate risks and enhance real-time responsiveness.

Industry press releases and investor briefings from global software vendors have emphasized increasing investments in cloud-native analytics platforms, predictive modeling, and AI-powered optimization tools tailored for supply chain operations. Additionally, manufacturers and retailers are prioritizing end-to-end traceability and scenario planning to navigate global uncertainties, including geopolitical shifts and raw material shortages.

With growing regulatory pressures around sustainability and compliance, analytics solutions that enable carbon tracking and responsible sourcing are gaining prominence. The market outlook remains positive, with long-term growth supported by integration of IoT, blockchain, and machine learning in supply chain workflows. Segmental dominance is being observed in Logistics Analytics, Professional Services, and Large Enterprises, reflecting where technology readiness and operational complexity are driving the highest adoption rates.
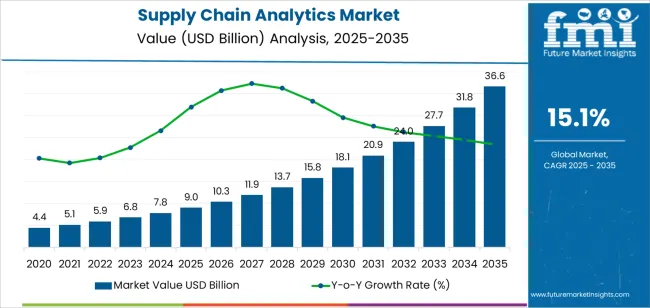
Quick Stats for Supply Chain Analytics Market

  • Supply Chain Analytics Market Industry Value (2025): USD 9.0 billion
  • Supply Chain Analytics Market Forecast Value (2035): USD 36.6 billion
  • Supply Chain Analytics Market Forecast CAGR: 15.1%
  • Leading Segment in Supply Chain Analytics Market in 2025: Logistics Analytics (31.4%)
  • Key Growth Region in Supply Chain Analytics Market: North America, Asia-Pacific, Europe
  • Top Key Players in Supply Chain Analytics Market: IBM Corporation, Mecalux, S.A., Analytics8, LLC, SS Supply Chain Solutions Pvt. Ltd., Sigmoid Analytics, Accenture, Oracle Corporation, SAP SE, SAS Institute Inc., Manhattan Associates

Supply Chain Analytics Market Market Value Analysis

Metric Value
Supply Chain Analytics Market Estimated Value in (2025 E) USD 9.0 billion
Supply Chain Analytics Market Forecast Value in (2035 F) USD 36.6 billion
Forecast CAGR (2025 to 2035) 15.1%

Segmental Analysis

The market is segmented by Solution, Service, Enterprise Type, End Use Industry, and Deployment and region. By Solution, the market is divided into Logistics Analytics, Manufacturing Analytics, Planning & Procurement, Sales & Operations Analytics, and Visualization & Reporting. In terms of Service, the market is classified into Professional and Support & Maintenance. Based on Enterprise Type, the market is segmented into Large Enterprises and SMEs. By End Use Industry, the market is divided into Retail & E-commerce Industry, Healthcare Industry, Transportation & Logistics Industry, Automotive Industry, Manufacturing Industry, Oil & Gas Industry, Chemical Industry, and Others. By Deployment, the market is segmented into Cloud-Based and On-Premise. Regionally, the market is classified into North America, Latin America, Western Europe, Eastern Europe, Balkan & Baltic Countries, Russia & Belarus, Central Asia, East Asia, South Asia & Pacific, and the Middle East & Africa.
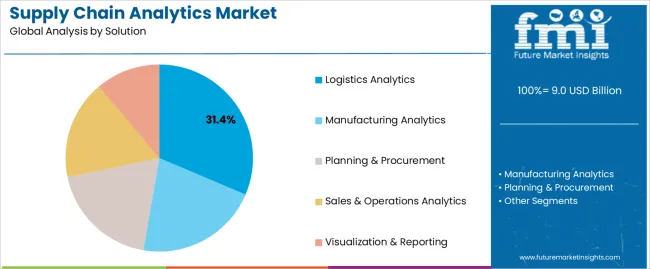
Insights into the Solution Segment: Logistics Analytics

Supply Chain Analytics Market Analysis By Solution

The Logistics Analytics segment is projected to account for 31.4% of the supply chain analytics market revenue in 2025, making it the leading solution category. This dominance has been shaped by the growing complexity of transportation networks and rising demand for real-time visibility into shipment flows.

Organizations have prioritized logistics analytics to reduce lead times, optimize routing, and improve last-mile delivery performance. Industry publications and company announcements have highlighted investments in fleet management systems, route optimization software, and warehouse automation as key contributors to this segment’s expansion.

Additionally, disruptions caused by global events have underscored the importance of predictive analytics in managing delivery risks and identifying cost-saving opportunities. As cross-border commerce and e-commerce volumes continue to grow, logistics analytics is expected to remain critical for businesses seeking resilience, efficiency, and agility in their distribution strategies.
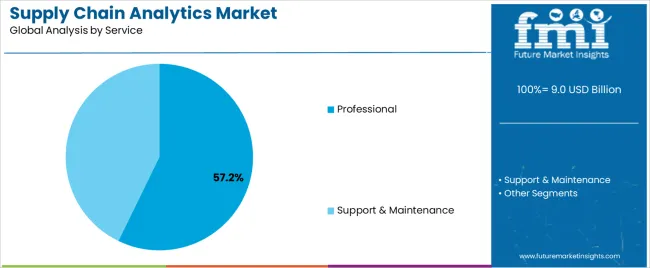
Insights into the Service Segment: Professional

Supply Chain Analytics Market Analysis By Service

The Professional Services segment is projected to contribute 57.2% of the supply chain analytics market revenue in 2025, maintaining its position as the dominant service category. Growth in this segment has been fueled by the need for customized implementation, integration, and strategic consulting services to support analytics platform adoption.

Enterprises have increasingly relied on professional services to bridge the skills gap in advanced analytics and to ensure seamless alignment with existing enterprise systems. Service providers have offered tailored solutions including data cleansing, dashboard creation, machine learning model development, and supply chain transformation roadmaps.

Analyst briefings and corporate service portfolios have emphasized the role of professional services in accelerating digital maturity and ROI realization. As supply chains grow more complex and globalized, the demand for expert-led deployments and change management support is expected to sustain the prominence of the Professional Services segment.
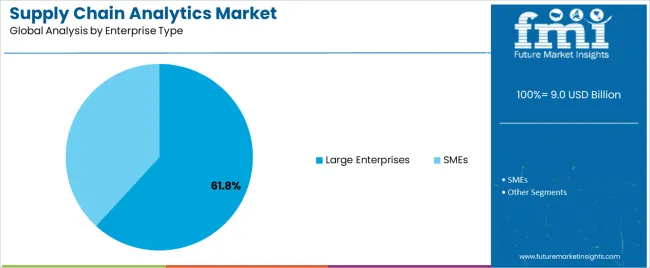
Insights into the Enterprise Type Segment: Large Enterprises

Supply Chain Analytics Market Analysis By Enterprise Type

The Large Enterprises segment is expected to hold 61.8% of the supply chain analytics market revenue in 2025, positioning it as the leading adopter group. Growth of this segment has been driven by the scale and intricacy of operations across multinational corporations, which require advanced analytical capabilities to manage diverse supplier bases, multimodal logistics, and dynamic customer demand.

Internal reports and IT spending disclosures from large enterprises have shown increased budget allocations toward data infrastructure modernization, cloud-based analytics platforms, and predictive demand planning. These organizations have also been early adopters of digital twins and AI-powered supply chain control towers to enhance scenario modeling and decision-making.

Moreover, compliance with global regulatory frameworks and ESG commitments has necessitated the use of supply chain analytics for transparency and sustainability tracking. With greater financial and technical resources to support enterprise-grade analytics deployments, large enterprises are expected to continue driving the majority of market demand.

Critical Restraints Affecting the Supply Chain Analytics Market

Despite the promising growth, several restraining factors impact the supply chain analytics market. One significant challenge is the high cost of implementing advanced analytics solutions. The initial investment in software, hardware, and skilled personnel can be prohibitive for small and medium-sized enterprises (SMEs), limiting widespread adoption. Additionally, integrating SCA solutions with existing legacy systems poses technical difficulties, requiring substantial time and resources for seamless integration and data migration.

Data privacy and security concerns also hinder market growth. As SCA involves handling vast amounts of sensitive information, companies are wary of potential data breaches and cyber-attacks, which could lead to financial losses and reputational damage. Compliance with stringent regulatory requirements regarding data protection further complicates the deployment of these solutions.

Another restraining factor is the lack of skilled professionals capable of managing and interpreting complex analytical tools. The shortage of data scientists and supply chain analysts creates a bottleneck, preventing companies from fully leveraging the benefits of SCA technologies.

Lastly, resistance to change within organizations can impede the adoption of new technologies. Many businesses remain hesitant to overhaul their traditional supply chain management practices, preferring familiar, albeit less efficient, methods over innovative analytics solutions. This cultural inertia slows the pace of market penetration for advanced SCA tools.

Key Market Trends Shaping the Supply Chain Analytics Market

Adoption of AI and Machine Learning and Focus on Sustainability

AI and ML are revolutionizing supply chain analytics by enabling predictive insights and automation. Companies are increasingly leveraging these technologies to forecast demand, optimize inventory, and streamline logistics, resulting in improved efficiency and reduced costs.

Sustainability is becoming a critical focus area, with companies utilizing analytics to optimize routes, reduce waste, and lower carbon footprints. SCA solutions help businesses align with environmental regulations and consumer expectations for sustainable practices.

Real-Time Data and IoT Integration and Cloud-Based Solutions

The integration of IoT with supply chain analytics is providing unprecedented real-time visibility into operations. IoT devices collect data on asset conditions, locations, and movements, allowing companies to monitor and react to supply chain events instantly, thus enhancing responsiveness and decision-making.

The shift towards cloud-based SCA solutions is gaining momentum due to their scalability, flexibility, and lower upfront costs. These solutions facilitate seamless data integration from various sources, enabling comprehensive analytics and fostering collaboration across the supply chain network.

Customization and Industry-Specific Solutions

There is a growing demand for tailored analytics solutions that address specific industry challenges. Vendors are developing specialized tools that cater to the unique needs of sectors such as retail, manufacturing, and healthcare, enhancing the relevance and impact of SCA implementations. These trends are collectively enhancing the capabilities of supply chain analytics, making it an indispensable tool for modern supply chain management.

Strategic Opportunities for Investors in the Supply Chain Analytics Market

Investors have strategic opportunities in the supply chain analytics market by focusing on companies developing AI and ML-driven analytics solutions, which are crucial for predictive insights and automation. Investing in IoT and real-time data integration technologies offers potential, as these enhance supply chain visibility and responsiveness.

Additionally, supporting cloud-based SCA platforms can be lucrative due to their scalability and growing adoption across industries. There's also a promising opportunity in sustainable supply chain analytics solutions, aligning with global sustainability trends. Lastly, funding niche startups offering industry-specific SCA tools can yield significant returns, given their tailored market appeal and specialized capabilities.

Country-wise Insights

Robust Technological Ecosystem of the United States Drives Industrial Expansion

The United States is at the forefront of the supply chain analytics market expansion, driven by its robust technological ecosystem and high adoption rates of advanced analytics. Major corporations like IBM, Oracle, and SAS Institute are spearheading innovations in AI and machine learning applications for supply chain optimization. The presence of leading retail, manufacturing, and logistics companies further fuels the demand for sophisticated SCA solutions, making the USA a critical hub for supply chain innovation and investment.

Strong Manufacturing Base of China Proves Impetus

China is rapidly advancing in the supply chain analytics market, leveraging its extensive manufacturing base and increasing e-commerce activities. Chinese tech giants such as Alibaba and Huawei are investing heavily in AI, IoT, and big data technologies to enhance supply chain efficiencies. The Chinese government's initiatives to modernize industry practices and improve digital infrastructure are also propelling the growth of SCA solutions. This focus on technological advancement positions China as a significant player in the global SCA landscape.

Integration of Cutting-Edge Supply Chain Analytics in Germany Solidify its Global Presence

Germany is emerging as a key player in the supply chain analytics market, particularly within Europe. Known for its engineering and manufacturing prowess, Germany is adopting advanced SCA solutions to maintain its competitive edge in industries like automotive, machinery, and chemicals. Companies such as SAP SE are leading the way with innovative analytics platforms. Additionally, Germany's strong emphasis on Industry 4.0 and digital transformation initiatives supports the integration of cutting-edge supply chain analytics, solidifying its role in the market's growth.

Category-wise Insights

Logistics Analytics Dominates Due to its Role in Optimizing Operations

Logistics analytics is paramount in the supply chain analytics market due to its ability to optimize transportation routes, warehouse management, and inventory tracking. In today's competitive landscape, efficient logistics operations are essential for timely delivery, cost reduction, and maintaining customer satisfaction, driving the demand for advanced analytics solutions.

Complex Logistics and Real-time Insights Drive Retail or E-commerce Leadership

The retail and e-commerce industry leads in supply chain analytics due to its complex and dynamic supply chains, necessitating real-time insights for inventory management, demand forecasting, and order fulfillment. With fierce competition and customer expectations for fast delivery, retailers heavily rely on analytics to optimize operations and enhance customer satisfaction.
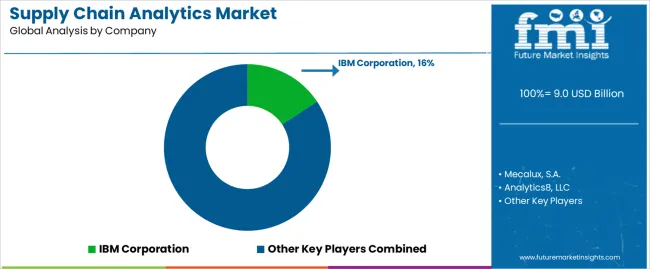
Competition Outlook

Supply Chain Analytics Market Analysis By Company

Manufacturers are investing in advanced analytics tools to optimize production, inventory management, and distribution networks. They're leveraging predictive analytics to forecast demand accurately, minimize stockouts, and streamline supply chain operations. Additionally, partnerships with tech firms facilitate the integration of IoT and AI technologies for enhanced visibility and efficiency.

Industry Updates

  • On March 7, 2025, TVS Supply Chain Solutions inaugurated a cutting-edge warehousing facility in Hosur, Tamil Nadu. Equipped with automation and data analytics, it enhanced client productivity.
  • On June 19, 2025, Jaguar Land Rover partnered with Everstream Analytics, embedding AI into its system to address supply chain challenges. This collaboration aimed to prevent future global supply disruptions.

Leading Supply Chain Analytics Brands

  • IBM Corporation
  • Oracle Corporation
  • SAS Institute Inc.
  • SAP SE
  • Capgemini SA
  • Tableau Software Inc.
  • Entercoms Inc.
  • Birst Inc.
  • Demand Solutions Group LLC
  • Tata Consultancy Services Ltd and Kinaxis Inc.

Key Segments of Industry Report

By Solution:

Based on solution, the industry is categorized into logistics analytics, manufacturing analytics, planning and procurement, sales and operations analytics, visualization, and reporting.

By Service:

Professional and support and maintenance are two services categorized in the supply chain analytics industry.

By Enterprise Type:

SMEs and large enterprises are bifurcated segments of the enterprise type of the sector.

By End Use Industry:

The sector is applicable to healthcare, retail and e-commerce, transportation and logistics, automotive, manufacturing, oil and gas, chemical, and other industries.

By Deployment:

On-premise and cloud-based are two segment categories of deployment in this industry.

By Regions:

A regional analysis has been conducted across key countries of North America, Latin America, Europe, Asia Pacific, and the Middle East and Africa.

Frequently Asked Questions

How big is the supply chain analytics market in 2025?

The global supply chain analytics market is estimated to be valued at USD 9.0 billion in 2025.

What will be the size of supply chain analytics market in 2035?

The market size for the supply chain analytics market is projected to reach USD 36.6 billion by 2035.

How much will be the supply chain analytics market growth between 2025 and 2035?

The supply chain analytics market is expected to grow at a 15.1% CAGR between 2025 and 2035.

What are the key product types in the supply chain analytics market?

The key product types in supply chain analytics market are logistics analytics, manufacturing analytics, planning & procurement, sales & operations analytics and visualization & reporting.

Which service segment to contribute significant share in the supply chain analytics market in 2025?

In terms of service, professional segment to command 57.2% share in the supply chain analytics market in 2025.

Table of Content

  1. Executive Summary
    • Global Market Outlook
    • Demand to side Trends
    • Supply to side Trends
    • Technology Roadmap Analysis
    • Analysis and Recommendations
  2. Market Overview
    • Market Coverage / Taxonomy
    • Market Definition / Scope / Limitations
  3. Market Background
    • Market Dynamics
      • Drivers
      • Restraints
      • Opportunity
      • Trends
    • Scenario Forecast
      • Demand in Optimistic Scenario
      • Demand in Likely Scenario
      • Demand in Conservative Scenario
    • Opportunity Map Analysis
    • Product Life Cycle Analysis
    • Supply Chain Analysis
    • Investment Feasibility Matrix
    • Value Chain Analysis
    • PESTLE and Porter’s Analysis
    • Regulatory Landscape
    • Regional Parent Market Outlook
    • Production and Consumption Statistics
    • Import and Export Statistics
  4. Global Market Analysis 2020 to 2024 and Forecast, 2025 to 2035
    • Historical Market Size Value (USD Million) Analysis, 2020 to 2024
    • Current and Future Market Size Value (USD Million) Projections, 2025 to 2035
      • Y to o to Y Growth Trend Analysis
      • Absolute $ Opportunity Analysis
  5. Global Market Pricing Analysis 2020 to 2024 and Forecast 2025 to 2035
  6. Global Market Analysis 2020 to 2024 and Forecast 2025 to 2035, By Solution
    • Introduction / Key Findings
    • Historical Market Size Value (USD Million) Analysis By Solution , 2020 to 2024
    • Current and Future Market Size Value (USD Million) Analysis and Forecast By Solution , 2025 to 2035
      • Logistics Analytics
      • Manufacturing Analytics
      • Planning & Procurement
      • Sales & Operations Analytics
      • Visualization & Reporting
    • Y to o to Y Growth Trend Analysis By Solution , 2020 to 2024
    • Absolute $ Opportunity Analysis By Solution , 2025 to 2035
  7. Global Market Analysis 2020 to 2024 and Forecast 2025 to 2035, By Service
    • Introduction / Key Findings
    • Historical Market Size Value (USD Million) Analysis By Service, 2020 to 2024
    • Current and Future Market Size Value (USD Million) Analysis and Forecast By Service, 2025 to 2035
      • Professional
      • Support & Maintenance
    • Y to o to Y Growth Trend Analysis By Service, 2020 to 2024
    • Absolute $ Opportunity Analysis By Service, 2025 to 2035
  8. Global Market Analysis 2020 to 2024 and Forecast 2025 to 2035, By Enterprise Type
    • Introduction / Key Findings
    • Historical Market Size Value (USD Million) Analysis By Enterprise Type, 2020 to 2024
    • Current and Future Market Size Value (USD Million) Analysis and Forecast By Enterprise Type, 2025 to 2035
      • Large Enterprises
      • SMEs
    • Y to o to Y Growth Trend Analysis By Enterprise Type, 2020 to 2024
    • Absolute $ Opportunity Analysis By Enterprise Type, 2025 to 2035
  9. Global Market Analysis 2020 to 2024 and Forecast 2025 to 2035, By End Use Industry
    • Introduction / Key Findings
    • Historical Market Size Value (USD Million) Analysis By End Use Industry, 2020 to 2024
    • Current and Future Market Size Value (USD Million) Analysis and Forecast By End Use Industry, 2025 to 2035
      • Retail & E-commerce Industry
      • Healthcare Industry
      • Transportation & Logistics Industry
      • Automotive Industry
      • Manufacturing Industry
      • Oil & Gas Industry
      • Chemical Industry
      • Others
    • Y to o to Y Growth Trend Analysis By End Use Industry, 2020 to 2024
    • Absolute $ Opportunity Analysis By End Use Industry, 2025 to 2035
  10. Global Market Analysis 2020 to 2024 and Forecast 2025 to 2035, By Deployment
    • Introduction / Key Findings
    • Historical Market Size Value (USD Million) Analysis By Deployment, 2020 to 2024
    • Current and Future Market Size Value (USD Million) Analysis and Forecast By Deployment, 2025 to 2035
      • Cloud-Based
      • On-Premise
    • Y to o to Y Growth Trend Analysis By Deployment, 2020 to 2024
    • Absolute $ Opportunity Analysis By Deployment, 2025 to 2035
  11. Global Market Analysis 2020 to 2024 and Forecast 2025 to 2035, By Region
    • Introduction
    • Historical Market Size Value (USD Million) Analysis By Region, 2020 to 2024
    • Current Market Size Value (USD Million) Analysis and Forecast By Region, 2025 to 2035
      • North America
      • Latin America
      • Western Europe
      • Eastern Europe
      • East Asia
      • South Asia and Pacific
      • Middle East & Africa
    • Market Attractiveness Analysis By Region
  12. North America Market Analysis 2020 to 2024 and Forecast 2025 to 2035, By Country
    • Historical Market Size Value (USD Million) Trend Analysis By Market Taxonomy, 2020 to 2024
    • Market Size Value (USD Million) Forecast By Market Taxonomy, 2025 to 2035
      • By Country
        • USA
        • Canada
        • Mexico
      • By Solution
      • By Service
      • By Enterprise Type
      • By End Use Industry
      • By Deployment
    • Market Attractiveness Analysis
      • By Country
      • By Solution
      • By Service
      • By Enterprise Type
      • By End Use Industry
      • By Deployment
    • Key Takeaways
  13. Latin America Market Analysis 2020 to 2024 and Forecast 2025 to 2035, By Country
    • Historical Market Size Value (USD Million) Trend Analysis By Market Taxonomy, 2020 to 2024
    • Market Size Value (USD Million) Forecast By Market Taxonomy, 2025 to 2035
      • By Country
        • Brazil
        • Chile
        • Rest of Latin America
      • By Solution
      • By Service
      • By Enterprise Type
      • By End Use Industry
      • By Deployment
    • Market Attractiveness Analysis
      • By Country
      • By Solution
      • By Service
      • By Enterprise Type
      • By End Use Industry
      • By Deployment
    • Key Takeaways
  14. Western Europe Market Analysis 2020 to 2024 and Forecast 2025 to 2035, By Country
    • Historical Market Size Value (USD Million) Trend Analysis By Market Taxonomy, 2020 to 2024
    • Market Size Value (USD Million) Forecast By Market Taxonomy, 2025 to 2035
      • By Country
        • Germany
        • UK
        • Italy
        • Spain
        • France
        • Nordic
        • BENELUX
        • Rest of Western Europe
      • By Solution
      • By Service
      • By Enterprise Type
      • By End Use Industry
      • By Deployment
    • Market Attractiveness Analysis
      • By Country
      • By Solution
      • By Service
      • By Enterprise Type
      • By End Use Industry
      • By Deployment
    • Key Takeaways
  15. Eastern Europe Market Analysis 2020 to 2024 and Forecast 2025 to 2035, By Country
    • Historical Market Size Value (USD Million) Trend Analysis By Market Taxonomy, 2020 to 2024
    • Market Size Value (USD Million) Forecast By Market Taxonomy, 2025 to 2035
      • By Country
        • Russia
        • Poland
        • Hungary
        • Balkan & Baltic
        • Rest of Eastern Europe
      • By Solution
      • By Service
      • By Enterprise Type
      • By End Use Industry
      • By Deployment
    • Market Attractiveness Analysis
      • By Country
      • By Solution
      • By Service
      • By Enterprise Type
      • By End Use Industry
      • By Deployment
    • Key Takeaways
  16. East Asia Market Analysis 2020 to 2024 and Forecast 2025 to 2035, By Country
    • Historical Market Size Value (USD Million) Trend Analysis By Market Taxonomy, 2020 to 2024
    • Market Size Value (USD Million) Forecast By Market Taxonomy, 2025 to 2035
      • By Country
        • China
        • Japan
        • South Korea
      • By Solution
      • By Service
      • By Enterprise Type
      • By End Use Industry
      • By Deployment
    • Market Attractiveness Analysis
      • By Country
      • By Solution
      • By Service
      • By Enterprise Type
      • By End Use Industry
      • By Deployment
    • Key Takeaways
  17. South Asia and Pacific Market Analysis 2020 to 2024 and Forecast 2025 to 2035, By Country
    • Historical Market Size Value (USD Million) Trend Analysis By Market Taxonomy, 2020 to 2024
    • Market Size Value (USD Million) Forecast By Market Taxonomy, 2025 to 2035
      • By Country
        • India
        • ASEAN
        • Australia & New Zealand
        • Rest of South Asia and Pacific
      • By Solution
      • By Service
      • By Enterprise Type
      • By End Use Industry
      • By Deployment
    • Market Attractiveness Analysis
      • By Country
      • By Solution
      • By Service
      • By Enterprise Type
      • By End Use Industry
      • By Deployment
    • Key Takeaways
  18. Middle East & Africa Market Analysis 2020 to 2024 and Forecast 2025 to 2035, By Country
    • Historical Market Size Value (USD Million) Trend Analysis By Market Taxonomy, 2020 to 2024
    • Market Size Value (USD Million) Forecast By Market Taxonomy, 2025 to 2035
      • By Country
        • Kingdom of Saudi Arabia
        • Other GCC Countries
        • Turkiye
        • South Africa
        • Other African Union
        • Rest of Middle East & Africa
      • By Solution
      • By Service
      • By Enterprise Type
      • By End Use Industry
      • By Deployment
    • Market Attractiveness Analysis
      • By Country
      • By Solution
      • By Service
      • By Enterprise Type
      • By End Use Industry
      • By Deployment
    • Key Takeaways
  19. Key Countries Market Analysis
    • USA
      • Pricing Analysis
      • Market Share Analysis, 2024
        • By Solution
        • By Service
        • By Enterprise Type
        • By End Use Industry
        • By Deployment
    • Canada
      • Pricing Analysis
      • Market Share Analysis, 2024
        • By Solution
        • By Service
        • By Enterprise Type
        • By End Use Industry
        • By Deployment
    • Mexico
      • Pricing Analysis
      • Market Share Analysis, 2024
        • By Solution
        • By Service
        • By Enterprise Type
        • By End Use Industry
        • By Deployment
    • Brazil
      • Pricing Analysis
      • Market Share Analysis, 2024
        • By Solution
        • By Service
        • By Enterprise Type
        • By End Use Industry
        • By Deployment
    • Chile
      • Pricing Analysis
      • Market Share Analysis, 2024
        • By Solution
        • By Service
        • By Enterprise Type
        • By End Use Industry
        • By Deployment
    • Germany
      • Pricing Analysis
      • Market Share Analysis, 2024
        • By Solution
        • By Service
        • By Enterprise Type
        • By End Use Industry
        • By Deployment
    • UK
      • Pricing Analysis
      • Market Share Analysis, 2024
        • By Solution
        • By Service
        • By Enterprise Type
        • By End Use Industry
        • By Deployment
    • Italy
      • Pricing Analysis
      • Market Share Analysis, 2024
        • By Solution
        • By Service
        • By Enterprise Type
        • By End Use Industry
        • By Deployment
    • Spain
      • Pricing Analysis
      • Market Share Analysis, 2024
        • By Solution
        • By Service
        • By Enterprise Type
        • By End Use Industry
        • By Deployment
    • France
      • Pricing Analysis
      • Market Share Analysis, 2024
        • By Solution
        • By Service
        • By Enterprise Type
        • By End Use Industry
        • By Deployment
    • India
      • Pricing Analysis
      • Market Share Analysis, 2024
        • By Solution
        • By Service
        • By Enterprise Type
        • By End Use Industry
        • By Deployment
    • ASEAN
      • Pricing Analysis
      • Market Share Analysis, 2024
        • By Solution
        • By Service
        • By Enterprise Type
        • By End Use Industry
        • By Deployment
    • Australia & New Zealand
      • Pricing Analysis
      • Market Share Analysis, 2024
        • By Solution
        • By Service
        • By Enterprise Type
        • By End Use Industry
        • By Deployment
    • China
      • Pricing Analysis
      • Market Share Analysis, 2024
        • By Solution
        • By Service
        • By Enterprise Type
        • By End Use Industry
        • By Deployment
    • Japan
      • Pricing Analysis
      • Market Share Analysis, 2024
        • By Solution
        • By Service
        • By Enterprise Type
        • By End Use Industry
        • By Deployment
    • South Korea
      • Pricing Analysis
      • Market Share Analysis, 2024
        • By Solution
        • By Service
        • By Enterprise Type
        • By End Use Industry
        • By Deployment
    • Russia
      • Pricing Analysis
      • Market Share Analysis, 2024
        • By Solution
        • By Service
        • By Enterprise Type
        • By End Use Industry
        • By Deployment
    • Poland
      • Pricing Analysis
      • Market Share Analysis, 2024
        • By Solution
        • By Service
        • By Enterprise Type
        • By End Use Industry
        • By Deployment
    • Hungary
      • Pricing Analysis
      • Market Share Analysis, 2024
        • By Solution
        • By Service
        • By Enterprise Type
        • By End Use Industry
        • By Deployment
    • Kingdom of Saudi Arabia
      • Pricing Analysis
      • Market Share Analysis, 2024
        • By Solution
        • By Service
        • By Enterprise Type
        • By End Use Industry
        • By Deployment
    • Turkiye
      • Pricing Analysis
      • Market Share Analysis, 2024
        • By Solution
        • By Service
        • By Enterprise Type
        • By End Use Industry
        • By Deployment
    • South Africa
      • Pricing Analysis
      • Market Share Analysis, 2024
        • By Solution
        • By Service
        • By Enterprise Type
        • By End Use Industry
        • By Deployment
  20. Market Structure Analysis
    • Competition Dashboard
    • Competition Benchmarking
    • Market Share Analysis of Top Players
      • By Regional
      • By Solution
      • By Service
      • By Enterprise Type
      • By End Use Industry
      • By Deployment
  21. Competition Analysis
    • Competition Deep Dive
      • IBM Corporation
        • Overview
        • Product Portfolio
        • Profitability by Market Segments (Product/Age /Sales Channel/Region)
        • Sales Footprint
        • Strategy Overview
          • Marketing Strategy
          • Product Strategy
          • Channel Strategy
      • Mecalux, S.A.
      • Analytics8, LLC
      • SS Supply Chain Solutions Pvt. Ltd.
      • Sigmoid Analytics
      • Accenture
      • Oracle Corporation
      • SAP SE
      • SAS Institute Inc.
      • Manhattan Associates
  22. Assumptions & Acronyms Used
  23. Research Methodology

List of Tables

  • Table 1: Global Market Value (USD Million) Forecast by Region, 2020 to 2035
  • Table 2: Global Market Value (USD Million) Forecast by Solution , 2020 to 2035
  • Table 3: Global Market Value (USD Million) Forecast by Service, 2020 to 2035
  • Table 4: Global Market Value (USD Million) Forecast by Enterprise Type, 2020 to 2035
  • Table 5: Global Market Value (USD Million) Forecast by End Use Industry, 2020 to 2035
  • Table 6: Global Market Value (USD Million) Forecast by Deployment, 2020 to 2035
  • Table 7: North America Market Value (USD Million) Forecast by Country, 2020 to 2035
  • Table 8: North America Market Value (USD Million) Forecast by Solution , 2020 to 2035
  • Table 9: North America Market Value (USD Million) Forecast by Service, 2020 to 2035
  • Table 10: North America Market Value (USD Million) Forecast by Enterprise Type, 2020 to 2035
  • Table 11: North America Market Value (USD Million) Forecast by End Use Industry, 2020 to 2035
  • Table 12: North America Market Value (USD Million) Forecast by Deployment, 2020 to 2035
  • Table 13: Latin America Market Value (USD Million) Forecast by Country, 2020 to 2035
  • Table 14: Latin America Market Value (USD Million) Forecast by Solution , 2020 to 2035
  • Table 15: Latin America Market Value (USD Million) Forecast by Service, 2020 to 2035
  • Table 16: Latin America Market Value (USD Million) Forecast by Enterprise Type, 2020 to 2035
  • Table 17: Latin America Market Value (USD Million) Forecast by End Use Industry, 2020 to 2035
  • Table 18: Latin America Market Value (USD Million) Forecast by Deployment, 2020 to 2035
  • Table 19: Western Europe Market Value (USD Million) Forecast by Country, 2020 to 2035
  • Table 20: Western Europe Market Value (USD Million) Forecast by Solution , 2020 to 2035
  • Table 21: Western Europe Market Value (USD Million) Forecast by Service, 2020 to 2035
  • Table 22: Western Europe Market Value (USD Million) Forecast by Enterprise Type, 2020 to 2035
  • Table 23: Western Europe Market Value (USD Million) Forecast by End Use Industry, 2020 to 2035
  • Table 24: Western Europe Market Value (USD Million) Forecast by Deployment, 2020 to 2035
  • Table 25: Eastern Europe Market Value (USD Million) Forecast by Country, 2020 to 2035
  • Table 26: Eastern Europe Market Value (USD Million) Forecast by Solution , 2020 to 2035
  • Table 27: Eastern Europe Market Value (USD Million) Forecast by Service, 2020 to 2035
  • Table 28: Eastern Europe Market Value (USD Million) Forecast by Enterprise Type, 2020 to 2035
  • Table 29: Eastern Europe Market Value (USD Million) Forecast by End Use Industry, 2020 to 2035
  • Table 30: Eastern Europe Market Value (USD Million) Forecast by Deployment, 2020 to 2035
  • Table 31: East Asia Market Value (USD Million) Forecast by Country, 2020 to 2035
  • Table 32: East Asia Market Value (USD Million) Forecast by Solution , 2020 to 2035
  • Table 33: East Asia Market Value (USD Million) Forecast by Service, 2020 to 2035
  • Table 34: East Asia Market Value (USD Million) Forecast by Enterprise Type, 2020 to 2035
  • Table 35: East Asia Market Value (USD Million) Forecast by End Use Industry, 2020 to 2035
  • Table 36: East Asia Market Value (USD Million) Forecast by Deployment, 2020 to 2035
  • Table 37: South Asia and Pacific Market Value (USD Million) Forecast by Country, 2020 to 2035
  • Table 38: South Asia and Pacific Market Value (USD Million) Forecast by Solution , 2020 to 2035
  • Table 39: South Asia and Pacific Market Value (USD Million) Forecast by Service, 2020 to 2035
  • Table 40: South Asia and Pacific Market Value (USD Million) Forecast by Enterprise Type, 2020 to 2035
  • Table 41: South Asia and Pacific Market Value (USD Million) Forecast by End Use Industry, 2020 to 2035
  • Table 42: South Asia and Pacific Market Value (USD Million) Forecast by Deployment, 2020 to 2035
  • Table 43: Middle East & Africa Market Value (USD Million) Forecast by Country, 2020 to 2035
  • Table 44: Middle East & Africa Market Value (USD Million) Forecast by Solution , 2020 to 2035
  • Table 45: Middle East & Africa Market Value (USD Million) Forecast by Service, 2020 to 2035
  • Table 46: Middle East & Africa Market Value (USD Million) Forecast by Enterprise Type, 2020 to 2035
  • Table 47: Middle East & Africa Market Value (USD Million) Forecast by End Use Industry, 2020 to 2035
  • Table 48: Middle East & Africa Market Value (USD Million) Forecast by Deployment, 2020 to 2035

List of Figures

  • Figure 1: Global Market Pricing Analysis
  • Figure 2: Global Market Value (USD Million) Forecast 2020-2035
  • Figure 3: Global Market Value Share and BPS Analysis by Solution , 2025 and 2035
  • Figure 4: Global Market Y to o to Y Growth Comparison by Solution , 2025-2035
  • Figure 5: Global Market Attractiveness Analysis by Solution
  • Figure 6: Global Market Value Share and BPS Analysis by Service, 2025 and 2035
  • Figure 7: Global Market Y to o to Y Growth Comparison by Service, 2025-2035
  • Figure 8: Global Market Attractiveness Analysis by Service
  • Figure 9: Global Market Value Share and BPS Analysis by Enterprise Type, 2025 and 2035
  • Figure 10: Global Market Y to o to Y Growth Comparison by Enterprise Type, 2025-2035
  • Figure 11: Global Market Attractiveness Analysis by Enterprise Type
  • Figure 12: Global Market Value Share and BPS Analysis by End Use Industry, 2025 and 2035
  • Figure 13: Global Market Y to o to Y Growth Comparison by End Use Industry, 2025-2035
  • Figure 14: Global Market Attractiveness Analysis by End Use Industry
  • Figure 15: Global Market Value Share and BPS Analysis by Deployment, 2025 and 2035
  • Figure 16: Global Market Y to o to Y Growth Comparison by Deployment, 2025-2035
  • Figure 17: Global Market Attractiveness Analysis by Deployment
  • Figure 18: Global Market Value (USD Million) Share and BPS Analysis by Region, 2025 and 2035
  • Figure 19: Global Market Y to o to Y Growth Comparison by Region, 2025-2035
  • Figure 20: Global Market Attractiveness Analysis by Region
  • Figure 21: North America Market Incremental Dollar Opportunity, 2025-2035
  • Figure 22: Latin America Market Incremental Dollar Opportunity, 2025-2035
  • Figure 23: Western Europe Market Incremental Dollar Opportunity, 2025-2035
  • Figure 24: Eastern Europe Market Incremental Dollar Opportunity, 2025-2035
  • Figure 25: East Asia Market Incremental Dollar Opportunity, 2025-2035
  • Figure 26: South Asia and Pacific Market Incremental Dollar Opportunity, 2025-2035
  • Figure 27: Middle East & Africa Market Incremental Dollar Opportunity, 2025-2035
  • Figure 28: North America Market Value Share and BPS Analysis by Country, 2025 and 2035
  • Figure 29: North America Market Value Share and BPS Analysis by Solution , 2025 and 2035
  • Figure 30: North America Market Y to o to Y Growth Comparison by Solution , 2025-2035
  • Figure 31: North America Market Attractiveness Analysis by Solution
  • Figure 32: North America Market Value Share and BPS Analysis by Service, 2025 and 2035
  • Figure 33: North America Market Y to o to Y Growth Comparison by Service, 2025-2035
  • Figure 34: North America Market Attractiveness Analysis by Service
  • Figure 35: North America Market Value Share and BPS Analysis by Enterprise Type, 2025 and 2035
  • Figure 36: North America Market Y to o to Y Growth Comparison by Enterprise Type, 2025-2035
  • Figure 37: North America Market Attractiveness Analysis by Enterprise Type
  • Figure 38: North America Market Value Share and BPS Analysis by End Use Industry, 2025 and 2035
  • Figure 39: North America Market Y to o to Y Growth Comparison by End Use Industry, 2025-2035
  • Figure 40: North America Market Attractiveness Analysis by End Use Industry
  • Figure 41: North America Market Value Share and BPS Analysis by Deployment, 2025 and 2035
  • Figure 42: North America Market Y to o to Y Growth Comparison by Deployment, 2025-2035
  • Figure 43: North America Market Attractiveness Analysis by Deployment
  • Figure 44: Latin America Market Value Share and BPS Analysis by Country, 2025 and 2035
  • Figure 45: Latin America Market Value Share and BPS Analysis by Solution , 2025 and 2035
  • Figure 46: Latin America Market Y to o to Y Growth Comparison by Solution , 2025-2035
  • Figure 47: Latin America Market Attractiveness Analysis by Solution
  • Figure 48: Latin America Market Value Share and BPS Analysis by Service, 2025 and 2035
  • Figure 49: Latin America Market Y to o to Y Growth Comparison by Service, 2025-2035
  • Figure 50: Latin America Market Attractiveness Analysis by Service
  • Figure 51: Latin America Market Value Share and BPS Analysis by Enterprise Type, 2025 and 2035
  • Figure 52: Latin America Market Y to o to Y Growth Comparison by Enterprise Type, 2025-2035
  • Figure 53: Latin America Market Attractiveness Analysis by Enterprise Type
  • Figure 54: Latin America Market Value Share and BPS Analysis by End Use Industry, 2025 and 2035
  • Figure 55: Latin America Market Y to o to Y Growth Comparison by End Use Industry, 2025-2035
  • Figure 56: Latin America Market Attractiveness Analysis by End Use Industry
  • Figure 57: Latin America Market Value Share and BPS Analysis by Deployment, 2025 and 2035
  • Figure 58: Latin America Market Y to o to Y Growth Comparison by Deployment, 2025-2035
  • Figure 59: Latin America Market Attractiveness Analysis by Deployment
  • Figure 60: Western Europe Market Value Share and BPS Analysis by Country, 2025 and 2035
  • Figure 61: Western Europe Market Value Share and BPS Analysis by Solution , 2025 and 2035
  • Figure 62: Western Europe Market Y to o to Y Growth Comparison by Solution , 2025-2035
  • Figure 63: Western Europe Market Attractiveness Analysis by Solution
  • Figure 64: Western Europe Market Value Share and BPS Analysis by Service, 2025 and 2035
  • Figure 65: Western Europe Market Y to o to Y Growth Comparison by Service, 2025-2035
  • Figure 66: Western Europe Market Attractiveness Analysis by Service
  • Figure 67: Western Europe Market Value Share and BPS Analysis by Enterprise Type, 2025 and 2035
  • Figure 68: Western Europe Market Y to o to Y Growth Comparison by Enterprise Type, 2025-2035
  • Figure 69: Western Europe Market Attractiveness Analysis by Enterprise Type
  • Figure 70: Western Europe Market Value Share and BPS Analysis by End Use Industry, 2025 and 2035
  • Figure 71: Western Europe Market Y to o to Y Growth Comparison by End Use Industry, 2025-2035
  • Figure 72: Western Europe Market Attractiveness Analysis by End Use Industry
  • Figure 73: Western Europe Market Value Share and BPS Analysis by Deployment, 2025 and 2035
  • Figure 74: Western Europe Market Y to o to Y Growth Comparison by Deployment, 2025-2035
  • Figure 75: Western Europe Market Attractiveness Analysis by Deployment
  • Figure 76: Eastern Europe Market Value Share and BPS Analysis by Country, 2025 and 2035
  • Figure 77: Eastern Europe Market Value Share and BPS Analysis by Solution , 2025 and 2035
  • Figure 78: Eastern Europe Market Y to o to Y Growth Comparison by Solution , 2025-2035
  • Figure 79: Eastern Europe Market Attractiveness Analysis by Solution
  • Figure 80: Eastern Europe Market Value Share and BPS Analysis by Service, 2025 and 2035
  • Figure 81: Eastern Europe Market Y to o to Y Growth Comparison by Service, 2025-2035
  • Figure 82: Eastern Europe Market Attractiveness Analysis by Service
  • Figure 83: Eastern Europe Market Value Share and BPS Analysis by Enterprise Type, 2025 and 2035
  • Figure 84: Eastern Europe Market Y to o to Y Growth Comparison by Enterprise Type, 2025-2035
  • Figure 85: Eastern Europe Market Attractiveness Analysis by Enterprise Type
  • Figure 86: Eastern Europe Market Value Share and BPS Analysis by End Use Industry, 2025 and 2035
  • Figure 87: Eastern Europe Market Y to o to Y Growth Comparison by End Use Industry, 2025-2035
  • Figure 88: Eastern Europe Market Attractiveness Analysis by End Use Industry
  • Figure 89: Eastern Europe Market Value Share and BPS Analysis by Deployment, 2025 and 2035
  • Figure 90: Eastern Europe Market Y to o to Y Growth Comparison by Deployment, 2025-2035
  • Figure 91: Eastern Europe Market Attractiveness Analysis by Deployment
  • Figure 92: East Asia Market Value Share and BPS Analysis by Country, 2025 and 2035
  • Figure 93: East Asia Market Value Share and BPS Analysis by Solution , 2025 and 2035
  • Figure 94: East Asia Market Y to o to Y Growth Comparison by Solution , 2025-2035
  • Figure 95: East Asia Market Attractiveness Analysis by Solution
  • Figure 96: East Asia Market Value Share and BPS Analysis by Service, 2025 and 2035
  • Figure 97: East Asia Market Y to o to Y Growth Comparison by Service, 2025-2035
  • Figure 98: East Asia Market Attractiveness Analysis by Service
  • Figure 99: East Asia Market Value Share and BPS Analysis by Enterprise Type, 2025 and 2035
  • Figure 100: East Asia Market Y to o to Y Growth Comparison by Enterprise Type, 2025-2035
  • Figure 101: East Asia Market Attractiveness Analysis by Enterprise Type
  • Figure 102: East Asia Market Value Share and BPS Analysis by End Use Industry, 2025 and 2035
  • Figure 103: East Asia Market Y to o to Y Growth Comparison by End Use Industry, 2025-2035
  • Figure 104: East Asia Market Attractiveness Analysis by End Use Industry
  • Figure 105: East Asia Market Value Share and BPS Analysis by Deployment, 2025 and 2035
  • Figure 106: East Asia Market Y to o to Y Growth Comparison by Deployment, 2025-2035
  • Figure 107: East Asia Market Attractiveness Analysis by Deployment
  • Figure 108: South Asia and Pacific Market Value Share and BPS Analysis by Country, 2025 and 2035
  • Figure 109: South Asia and Pacific Market Value Share and BPS Analysis by Solution , 2025 and 2035
  • Figure 110: South Asia and Pacific Market Y to o to Y Growth Comparison by Solution , 2025-2035
  • Figure 111: South Asia and Pacific Market Attractiveness Analysis by Solution
  • Figure 112: South Asia and Pacific Market Value Share and BPS Analysis by Service, 2025 and 2035
  • Figure 113: South Asia and Pacific Market Y to o to Y Growth Comparison by Service, 2025-2035
  • Figure 114: South Asia and Pacific Market Attractiveness Analysis by Service
  • Figure 115: South Asia and Pacific Market Value Share and BPS Analysis by Enterprise Type, 2025 and 2035
  • Figure 116: South Asia and Pacific Market Y to o to Y Growth Comparison by Enterprise Type, 2025-2035
  • Figure 117: South Asia and Pacific Market Attractiveness Analysis by Enterprise Type
  • Figure 118: South Asia and Pacific Market Value Share and BPS Analysis by End Use Industry, 2025 and 2035
  • Figure 119: South Asia and Pacific Market Y to o to Y Growth Comparison by End Use Industry, 2025-2035
  • Figure 120: South Asia and Pacific Market Attractiveness Analysis by End Use Industry
  • Figure 121: South Asia and Pacific Market Value Share and BPS Analysis by Deployment, 2025 and 2035
  • Figure 122: South Asia and Pacific Market Y to o to Y Growth Comparison by Deployment, 2025-2035
  • Figure 123: South Asia and Pacific Market Attractiveness Analysis by Deployment
  • Figure 124: Middle East & Africa Market Value Share and BPS Analysis by Country, 2025 and 2035
  • Figure 125: Middle East & Africa Market Value Share and BPS Analysis by Solution , 2025 and 2035
  • Figure 126: Middle East & Africa Market Y to o to Y Growth Comparison by Solution , 2025-2035
  • Figure 127: Middle East & Africa Market Attractiveness Analysis by Solution
  • Figure 128: Middle East & Africa Market Value Share and BPS Analysis by Service, 2025 and 2035
  • Figure 129: Middle East & Africa Market Y to o to Y Growth Comparison by Service, 2025-2035
  • Figure 130: Middle East & Africa Market Attractiveness Analysis by Service
  • Figure 131: Middle East & Africa Market Value Share and BPS Analysis by Enterprise Type, 2025 and 2035
  • Figure 132: Middle East & Africa Market Y to o to Y Growth Comparison by Enterprise Type, 2025-2035
  • Figure 133: Middle East & Africa Market Attractiveness Analysis by Enterprise Type
  • Figure 134: Middle East & Africa Market Value Share and BPS Analysis by End Use Industry, 2025 and 2035
  • Figure 135: Middle East & Africa Market Y to o to Y Growth Comparison by End Use Industry, 2025-2035
  • Figure 136: Middle East & Africa Market Attractiveness Analysis by End Use Industry
  • Figure 137: Middle East & Africa Market Value Share and BPS Analysis by Deployment, 2025 and 2035
  • Figure 138: Middle East & Africa Market Y to o to Y Growth Comparison by Deployment, 2025-2035
  • Figure 139: Middle East & Africa Market Attractiveness Analysis by Deployment
  • Figure 140: Global Market - Tier Structure Analysis
  • Figure 141: Global Market - Company Share Analysis
Dashboard
Dashboard
Dashboard
Dashboard
Dashboard
Dashboard

Full Research Suite comprises of:

Market outlook & trends analysis

Market outlook & trends analysis

Interviews & case studies

Interviews & case studies

Strategic recommendations

Strategic recommendations

Vendor profiles & capabilities analysis

Vendor profiles & capabilities analysis

5-year forecasts

5-year forecasts

8 regions and 60+ country-level data splits

8 regions and 60+ country-level data splits

Market segment data splits

Market segment data splits

12 months of continuous data updates

12 months of continuous data updates

DELIVERED AS:

PDF EXCEL ONLINE

Full Research Suite


$5000

$7500

$10000

Buy Report Now
Similar Industry Reports

Similar Industry Reports

Supply Chain Management Market

Supply Chain Management Market Size and Share Forecast Outlook 2025 to 2035

Supply Chain Visibility Software Market

Supply Chain Visibility Software Market Size and Share Forecast Outlook 2025 to 2035

Supply Chain Management BPO Market

Supply Chain Management BPO Market Analysis 2025 to 2035 by Outsourcing Model, Application, Service Type, Enterprise Size & Region

Power Supply Equipment for Data Center Market

Power Supply Equipment for Data Center Market Size and Share Forecast Outlook 2025 to 2035

Power Supply Isolation Equipment Market

Power Supply Isolation Equipment Market Size and Share Forecast Outlook 2025 to 2035

Office Supply Market

Office Supply Market Forecast and Outlook 2025 to 2035

 IoT in Supply Chain Market
IoT in Supply Chain Market

IoT in Supply Chain Market Insights – Trends, Growth & Forecast 2023-2033

Shipping Supply Market

Shipping Supply Market Size and Share Forecast Outlook 2025 to 2035

DC Power Supply Module Market

DC Power Supply Module Market – Powering IoT & Electronics

Packaging Supply Market

Packaging Supply Market Insights - Growth & Forecast 2024 to 2034

Cognitive Supply Chain Market

Cognitive Supply Chain Market Forecast Outlook 2025 to 2035

Commodity Supply Chain Management Solution Market

Commodity Supply Chain Management Solution Market Size and Share Forecast Outlook 2025 to 2035

Aviation Power Supply Market

Aviation Power Supply Market Size and Share Forecast Outlook 2025 to 2035

Industrial Power Supply Market

Industrial Power Supply Market Size and Share Forecast Outlook 2025 to 2035

Ammonium Sulphate Supply Market

Ammonium Sulphate Supply Market-Trends & Forecast 2025 to 2035

Switching Mode Power Supply Market

Switching Mode Power Supply Market - Growth & Forecast 2025 to 2035

Digital Transformation in Supply Chain Market

Digital Transformation in Supply Chain Market

SBOM Management and Software Supply Chain Compliance Market

SBOM Management and Software Supply Chain Compliance Market Analysis - Size, Share, and Forecast Outlook 2025 to 2035

PVC-M High Impact Resistant Water Supply Pipe Market

PVC-M High Impact Resistant Water Supply Pipe Market Size and Share Forecast Outlook 2025 to 2035

High Voltage Direct Current Power Supply Market

High Voltage Direct Current Power Supply Market Size and Share Forecast Outlook 2025 to 2035

Future Market Insights

Supply Chain Analytics Market

Chat With MaRIA

Chat With

MaRIA

Hi There, I am MaRIA, Your Market Research Intelligence Assistant. How may I help you?