The Cognitive Supply Chain market is experiencing significant growth driven by the increasing adoption of intelligent and AI-enabled solutions across manufacturing, logistics, and retail sectors. The future outlook is shaped by the growing need for real-time data analysis, predictive insights, and enhanced decision-making capabilities in supply chain operations. Organizations are increasingly leveraging cognitive technologies to optimize inventory management, forecast demand accurately, and improve operational efficiency.
Investments in digital transformation initiatives and automation are further fueling market expansion, as enterprises aim to reduce costs, minimize disruptions, and enhance resilience. The adoption of cloud and on-premises solutions enables seamless integration with existing enterprise systems, facilitating scalable and flexible operations.
Additionally, large enterprises are prioritizing advanced supply chain solutions to maintain competitive advantage and support global operations As supply chains become more complex, the demand for cognitive capabilities, including machine learning, natural language processing, and advanced analytics, is expected to grow, positioning the market for sustained long-term growth across industries.
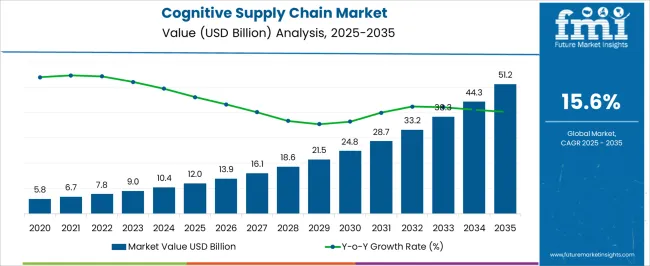
| Metric | Value |
|---|---|
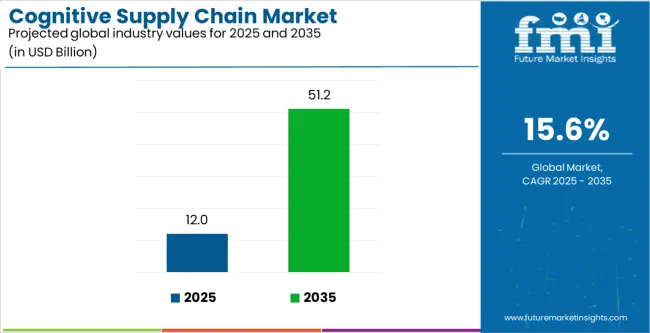
| Cognitive Supply Chain Market Estimated Value in (2025 E) | USD 12.0 billion |
| Cognitive Supply Chain Market Forecast Value in (2035 F) | USD 51.2 billion |
| Forecast CAGR (2025 to 2035) | 15.6% |
The market is segmented by Offering, Deployment, Enterprise Size, and End User and region. By Offering, the market is divided into Solutions, Services, and Others. In terms of Deployment, the market is classified into On-Premises and Cloud Based. Based on Enterprise Size, the market is segmented into Large Enterprise and SMEs. By End User, the market is divided into Manufacturing, Automotive, Retail & E-Commerce, Logistics & Transportation, Healthcare, Food & Beverages, and Others. Regionally, the market is classified into North America, Latin America, Western Europe, Eastern Europe, Balkan & Baltic Countries, Russia & Belarus, Central Asia, East Asia, South Asia & Pacific, and the Middle East & Africa.
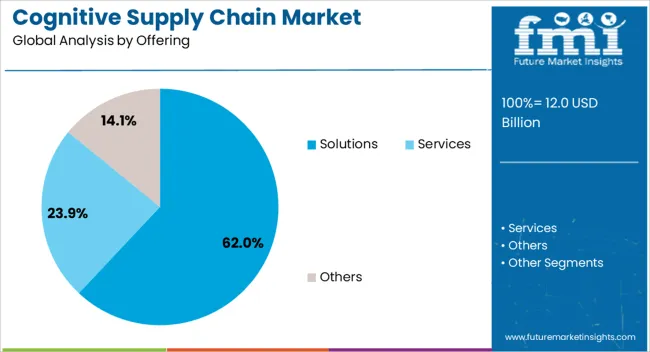
The solutions offering segment is projected to hold 62.0% of the Cognitive Supply Chain market revenue share in 2025, establishing it as the leading offering type. This segment has been driven by the comprehensive capabilities that solutions provide, enabling organizations to implement end-to-end supply chain intelligence.
Solutions allow for predictive analytics, demand forecasting, and real-time monitoring, which support strategic decision-making and operational efficiency. The scalability and adaptability of these solutions make them suitable for enterprises with complex supply chain networks.
Additionally, the integration of AI and machine learning into solutions enhances accuracy in inventory management and logistics planning, leading to cost savings and improved resource utilization The robust adoption of solutions is further reinforced by the growing emphasis on digital transformation initiatives, resilience planning, and optimization of global operations, making this segment the primary revenue contributor in the market.
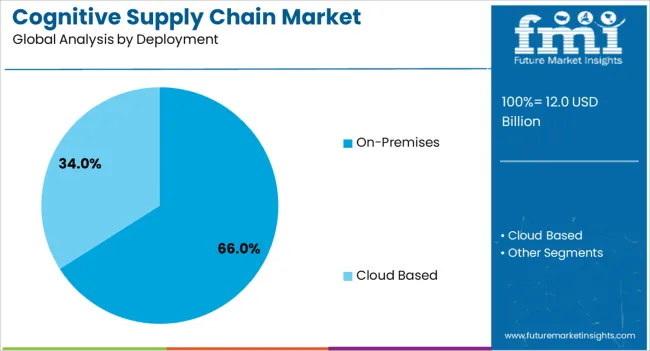
The on-premises deployment segment is expected to capture 66.0% of the Cognitive Supply Chain market revenue share in 2025, positioning it as the leading deployment model. This growth is influenced by the preference of organizations to maintain control over their critical supply chain data and systems while ensuring compliance with internal security policies.
On-premises deployments provide high customization capabilities, enabling enterprises to tailor solutions to their specific operational requirements. The segment’s prominence is further supported by large-scale implementations in industries with sensitive or proprietary data, where cloud deployment may pose perceived risks.
Enterprises benefit from direct integration with existing IT infrastructure, streamlined processes, and improved reliability, which strengthen operational efficiency The ability to manage resources internally while leveraging cognitive capabilities has driven the adoption of on-premises solutions, making this deployment model the primary choice for organizations seeking secure and scalable supply chain intelligence.

The large enterprise segment is anticipated to account for 65.0% of the Cognitive Supply Chain market revenue in 2025, establishing it as the leading end-user category. This dominance is attributed to the complex and expansive supply chain networks managed by large organizations, which necessitate advanced cognitive capabilities for efficient operations.
Large enterprises are investing heavily in AI-driven analytics, real-time monitoring, and predictive insights to optimize procurement, inventory, and logistics processes. The availability of extensive resources and strategic focus on digital transformation enables these enterprises to deploy comprehensive solutions and ensure seamless integration across multiple departments and regions.
Additionally, the need to mitigate risks, improve supply chain resilience, and maintain competitive advantage reinforces the adoption of cognitive supply chain technologies among large organizations The segment’s growth is further supported by the increasing emphasis on data-driven decision-making, operational efficiency, and global scalability, positioning large enterprises as the primary revenue contributors in the market.
Companies in the market provide their offerings through solutions, services, and other means. Among these, the solutions segment is anticipated to hold the largest market share of 62% as of 2025.
| Attributes | Details |
|---|---|
| Offerings | Solutions |
| Market Share (2025) | 62.00% |
The demand for cognitive supply chain solutions has touched the skies. This is because they offer sophisticated and advanced predictive analytics, demand forecasting, and risk management recommendations to businesses. Using this, organizations proactively address challenges and capitalize on opportunities in their supply chain operations.
These solutions can also leverage data from Internet of Things (IoT) devices and big data analytics, to gain deeper insights into supply chain operations which improves the overall decision-making across the supply chain.
Cognitive supply chain solutions are mainly deployed in two main ways, cloud-based and on-premise. Among these, the on-premise deployment takes the majority share, 66.0% of the overall market as estimated for 2025.
| Attributes | Details |
|---|---|
| Deployment | On-premise |
| Market Share (2025) | 66.0% |
The main reason why companies involved in highly regulated industries like healthcare and finance prefer on-premise deployment over cloud-based is their concern for security and privacy. On-premise deployment provides greater security and compliance as compared to the alternative.
On-premise deployment also provides organizations with greater customization options and control over their SCM software. This has also increased their adoption rates in the past few years.
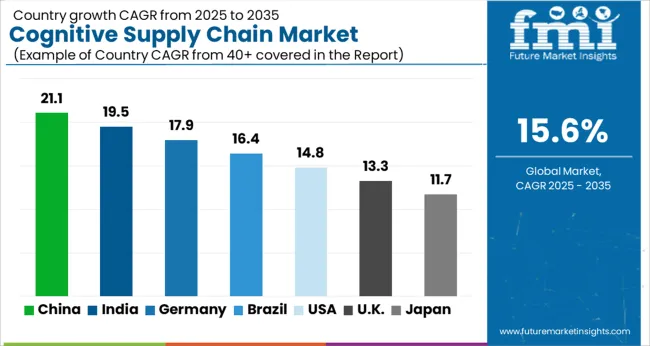

South Korea is one of the leading markets in the world when it comes to cognitive supply chains. The South Korean market is estimated to grow at a CAGR of 18.00% through 2035.
South Korea is well known for its technological innovation and advanced manufacturing capabilities. The country, in the last few years, has been increasingly investing in Industry 4.0 technologies, including AI and machine learning to optimize their supply chain operations and gain a competitive edge.
This has surged the prominence of cognitive supply chain solutions in the country. Besides this, South Korean reliance on these solutions for the international trade of electronics and automotive parts has also positively affected the market.
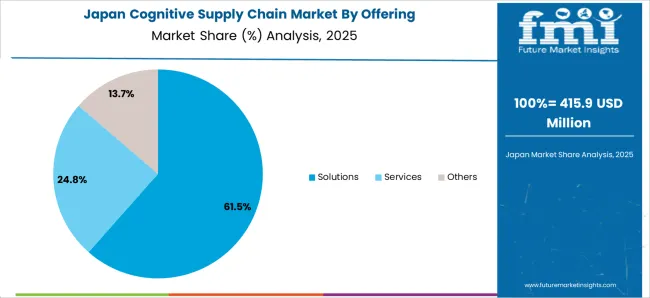
The Japanese market is also a lucrative one. It is anticipated to expand at a CAGR of 17.40% through 2035.
Japan, as of 2025, is facing the problem of a growing aging population. One in every three Japanese adult persons is above the age of sixty-five. This has resulted in acute shortages of labor in the country. The manufacturing sector has to thus rely on cognitive supply chain solutions for their day-to-day operations.
These applications and platforms efficiently streamline processes by automating tasks such as inventory management, production scheduling, and logistics optimization. Apart from this, the pandemic also brought before the world, the importance of resilient supply chain networks. Japanese companies are thus investing heavily in these solutions to strengthen their supply chain capabilities.
The market in the United Kingdom is also predicted to flourish in the coming future. It is in line to progress at a CAGR of 17.00% for the forecast period in the United Kingdom.
Over the past few years, thanks to the rising disposable incomes and the preference for comfort and convenience among the middle class, the United Kingdom’s e-commerce sector has experienced significant growth. This has put tremendous pressure on companies involved in supply chain management to provide efficient and reliable solutions.
Logistics companies in the United Kingdom are also generating huge demand for cognitive supply chain solutions. They help optimize inventory management, order fulfillment, and last-mile delivery processes to meet the demands of online shoppers effectively and compete in the fast-paced e-commerce market.
China is one of the prominent countries in this market. The market is slated to progress at an outstanding CAGR of 16.50% through 2035.
China is considered a notable manufacturing economy. The country also hosts a vast network of suppliers, manufacturers, and logistics providers. This has created a conducive environment for cognitive supply chain solutions.
They enable Chinese companies to optimize production processes, improve supply chain visibility, and enhance operational efficiency to maintain their competitive edge in markets.
Besides this, the country is also going through a phase of digital transformation across industries and these solutions play a crucial role in this transformation.

The United States market is also a promising one. It is anticipated to progress at a CAGR of 16.00% through 2035.
The United States is blessed with a multitude of tech companies and start-ups that are well-versed in artificial intelligence and machine learning algorithms.
This environment has benefitted the companies present in the logistics sector as they leverage cognitive supply chain solutions to enhance their operations and gain a competitive edge. Also, the market is gaining traction in the United States due to the country’s tendency to harness the potential of advanced and sophisticated technologies in its industrial operations.
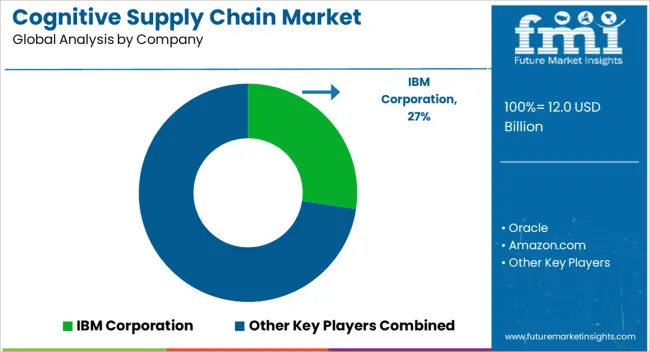
The market is still in its nascent stages as there is still a lot of room for improvement. The market is still dominated by a few tech giants, making entry of new start-ups seem very difficult. These companies already have a well-established consumer base due to their prolonged presence in the industry. These players are tapping the markets in emerging economies to effectively expand their consumer base.
Recent Developments
The global cognitive supply chain market is estimated to be valued at USD 12.0 billion in 2025.
The market size for the cognitive supply chain market is projected to reach USD 51.2 billion by 2035.
The cognitive supply chain market is expected to grow at a 15.6% CAGR between 2025 and 2035.
The key product types in cognitive supply chain market are solutions, _forecasting, _analytics, _inventory management, _risk management, services and others.
In terms of deployment, on-premises segment to command 66.0% share in the cognitive supply chain market in 2025.


Our Research Products

The "Full Research Suite" delivers actionable market intel, deep dives on markets or technologies, so clients act faster, cut risk, and unlock growth.

The Leaderboard benchmarks and ranks top vendors, classifying them as Established Leaders, Leading Challengers, or Disruptors & Challengers.

Locates where complements amplify value and substitutes erode it, forecasting net impact by horizon

We deliver granular, decision-grade intel: market sizing, 5-year forecasts, pricing, adoption, usage, revenue, and operational KPIs—plus competitor tracking, regulation, and value chains—across 60 countries broadly.

Spot the shifts before they hit your P&L. We track inflection points, adoption curves, pricing moves, and ecosystem plays to show where demand is heading, why it is changing, and what to do next across high-growth markets and disruptive tech

Real-time reads of user behavior. We track shifting priorities, perceptions of today’s and next-gen services, and provider experience, then pace how fast tech moves from trial to adoption, blending buyer, consumer, and channel inputs with social signals (#WhySwitch, #UX).

Partner with our analyst team to build a custom report designed around your business priorities. From analysing market trends to assessing competitors or crafting bespoke datasets, we tailor insights to your needs.
Supplier Intelligence
Discovery & Profiling
Capacity & Footprint
Performance & Risk
Compliance & Governance
Commercial Readiness
Who Supplies Whom
Scorecards & Shortlists
Playbooks & Docs
Category Intelligence
Definition & Scope
Demand & Use Cases
Cost Drivers
Market Structure
Supply Chain Map
Trade & Policy
Operating Norms
Deliverables
Buyer Intelligence
Account Basics
Spend & Scope
Procurement Model
Vendor Requirements
Terms & Policies
Entry Strategy
Pain Points & Triggers
Outputs
Pricing Analysis
Benchmarks
Trends
Should-Cost
Indexation
Landed Cost
Commercial Terms
Deliverables
Brand Analysis
Positioning & Value Prop
Share & Presence
Customer Evidence
Go-to-Market
Digital & Reputation
Compliance & Trust
KPIs & Gaps
Outputs
Full Research Suite comprises of:
Market outlook & trends analysis
Interviews & case studies
Strategic recommendations
Vendor profiles & capabilities analysis
5-year forecasts
8 regions and 60+ country-level data splits
Market segment data splits
12 months of continuous data updates
DELIVERED AS:
PDF EXCEL ONLINE
Supply Chain Analytics Market Size and Share Forecast Outlook 2025 to 2035
Supply Chain Management Market Size and Share Forecast Outlook 2025 to 2035
Supply Chain Visibility Software Market Size and Share Forecast Outlook 2025 to 2035
Supply Chain Management BPO Market Analysis 2025 to 2035 by Outsourcing Model, Application, Service Type, Enterprise Size & Region
IoT in Supply Chain Market Insights – Trends, Growth & Forecast 2023-2033
Commodity Supply Chain Management Solution Market Size and Share Forecast Outlook 2025 to 2035
Blockchain in Agriculture and Food Supply Chain Market Size and Share Forecast Outlook 2025 to 2035
Digital Transformation in Supply Chain Market
SBOM Management and Software Supply Chain Compliance Market Analysis - Size, Share, and Forecast Outlook 2025 to 2035
Cognitive Computing Market Size and Share Forecast Outlook 2025 to 2035
Cognitive Impairment Biomarkers Market Size and Share Forecast Outlook 2025 to 2035
Cognitive Electronic Warfare Market Size and Share Forecast Outlook 2025 to 2035
Cognitive Agents Market Size and Share Forecast Outlook 2025 to 2035
Cognitive Network Market Size and Share Forecast Outlook 2025 to 2035
Cognitive Analytics Market Size and Share Forecast Outlook 2025 to 2035
Chain Conveyors Market Size and Share Forecast Outlook 2025 to 2035
Cognitive Diagnostics Market Analysis & Forecast by Diagnosis, Indication, End User and Region through 2035
Cognitive health supplements market analysis by product type, form, sales channel, functionality, and by region – Growth, trends, and Forecast from 2025 to 2035
Cognitive Neuroscience Market Overview – Trends & Research Insights 2024-2034
Cognitive Assessment and Training Market Report – Trends & Growth Forecast 2024-2034

Thank you!
You will receive an email from our Business Development Manager. Please be sure to check your SPAM/JUNK folder too.
Chat With
MaRIA