Leadership Development Program Market Size and Share Forecast Outlook 2025 to 2035

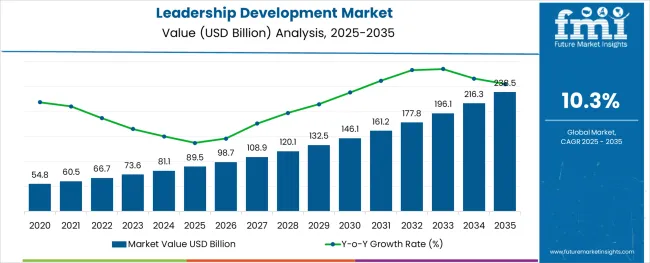
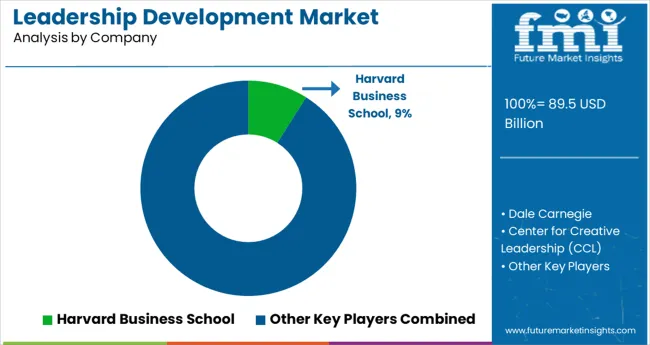
The global leadership development program market is projected to grow from USD 89.54 billion in 2025 to USD 564.46 billion by 2035, at a CAGR of 10.3%. This growth is being driven by the adoption of virtual learning technologies, AI-enabled content curation, and the increasing importance of inclusive leadership frameworks.

Personalized learning programs are being implemented across industries as hybrid and remote workforces are being supported by evolving organizational structures. Leadership training is being recognized as a strategic imperative in competitive sectors where cross-functional agility and innovation are being prioritized.

Digital transformation is being embraced to reshape leadership development strategies. Real-time simulations using AI and virtual reality are being introduced to improve engagement and learning retention. In 2025, mobile-first learning platforms are being deployed to ensure accessibility and flexibility. Adaptive content delivery is being enabled by analytics-based personalization. These innovations are being rolled out by HR departments to streamline training across global teams while aligning skill acquisition with measurable outcomes and business goals.

Diversity, equity, and well-being are being incorporated into leadership models at scale. Inclusive leadership principles are being embedded into training modules alongside cultural competence and anti-bias education. During 2025, wellness coaching and emotional resilience frameworks are being adopted to combat executive burnout and foster psychologically safe environments.

Leadership capabilities are being enhanced through emotional intelligence training, reinforcing the belief that empathy and mindfulness are critical in modern corporate ecosystems. A shift is being made toward building leaders who can manage teams with compassion and clarity.

Recent industry trends are being influenced by evolving learner expectations and technological advancements. In 2024 and 2025, gamified experiences and cohort-based digital bootcamps have been widely adopted to improve learning outcomes. AI-powered virtual leadership coaches are being piloted in several global enterprises.

A rise in microlearning has also been observed. Kishore Durg, Global Lead of Accenture LearnVantage, stated in July 2024, “As AI reshapes businesses across industries, the urgency for upskilling has never been more pronounced.” This sentiment is being reflected in solutions introduced by FranklinCovey, BTS, Korn Ferry, Deloitte, and DDI, where modular, tech-integrated leadership programs are being scaled to meet the demands of a rapidly transforming global workforce.

Attributes Key Insights
Estimated Market Size in 2025 USD 89.54 billion
Projected Market Value in 2035 USD 564.46 billion
Value-based CAGR from 2025 to 2035 10.3%

Analyzing Leadership Development Program Market by Top Investment Segments

Business Owners Segment to Be Assigned a Significant Share in the Market

In 2025, business owners are projected to be assigned a 26.7% share of the total participation in leadership development programs. This increase is being driven by the recognition of leadership capabilities as a fundamental requirement for sustaining competitive advantage and long-term organizational success.

Leadership programs are being increasingly enrolled in by entrepreneurs and business owners to strengthen strategic thinking, foster innovation, and manage growth amid market complexity. Specialized training modules for business leaders are being offered by prominent institutions such as Dale Carnegie, Harvard Business School Online, and Coursera for Business.

These programs are being designed to enhance critical competencies such as change leadership, communication, and strategic execution. As market volatility and technological disruptions are being faced more frequently, the importance of leadership development for business owners is being increasingly acknowledged. This segment is expected to remain pivotal as owners continue to invest in their own growth and the future of their enterprises.

Individual/Private Learners Segment to Be Maintained as the Market Leader

In 2025, the individual/private learners segment is projected to be maintained as the largest shareholding segment, accounting for 53.4% of the leadership development program market. Leadership training is increasingly being sought out by individuals on a self-initiated basis to improve employability, unlock career advancement, and cultivate personal growth.

Leadership skills are being perceived as essential across roles and industries, prompting more professionals to independently enroll in development programs. Programs tailored for self-paced and flexible learning are being widely offered by platforms such as LinkedIn Learning, Skillsoft, and edX. Micro-certifications, video-based modules, and interactive mentorship are being incorporated to enhance learning outcomes for individual participants.

Demand is being further fueled by the widespread adoption of remote and hybrid work models, which has elevated the need for autonomous skill development. As competition within the job market intensifies, investment in leadership by individual learners is expected to continue being prioritized.

Key Trends and Highlights

  • Integration of technology for virtual and remote leadership training.
  • Focus on diversity, equity, and inclusion (DEI) in leadership programs.
  • Rising demand for experiential learning and practical application of leadership concepts.
  • Adoption of personalized treatment plans and customized massages enhances the overall consumer experience and satisfaction.
  • Expansion of massage therapy services beyond traditional spa settings into healthcare facilities, corporate offices, and wellness centers broadens market reach.

2020 to 2024 Historical Analysis vs. 2025 to 2035 Market Forecast Projections

Between 2020 and 2024, the leadership development program market exhibited a historical CAGR of 9%. This period reflects robust growth driven by increasing awareness of the health benefits of massage therapy and a growing preference for holistic wellness practices.

Looking ahead to the forecasted period from 2025 to 2035, experts anticipate a slightly higher CAGR of 10.3%. This projection suggests continued market expansion, fueled by further recognition of massage therapy therapeutic value, technological advancements facilitating access to services, and a greater emphasis on preventive healthcare.

Historical CAGR from 2020 to 2024 9%
Forecast CAGR from 2025 to 2035 10.3%

Leadership Development Program Market Drivers

  • Evolving leadership models and styles to meet the demands of changing work dynamics and workforce demographics.
  • Integration of technology to enhance accessibility and effectiveness of leadership training initiatives.
  • Globalization and cross-cultural collaboration driving the need for culturally competent leadership.
  • Collaborations between therapists and healthcare professionals create synergies for promoting overall well-being.

Leadership Development Program Market Challenges

  • Overcoming budget constraints and resource limitations for comprehensive leadership development initiatives.
  • Mitigating the risk of leadership burnout and turnover due to the pressures of high-stakes roles.
  • Addressing diversity, equity, and inclusion (DEI) considerations in leadership development to foster inclusive practices.

Country-wise Analysis

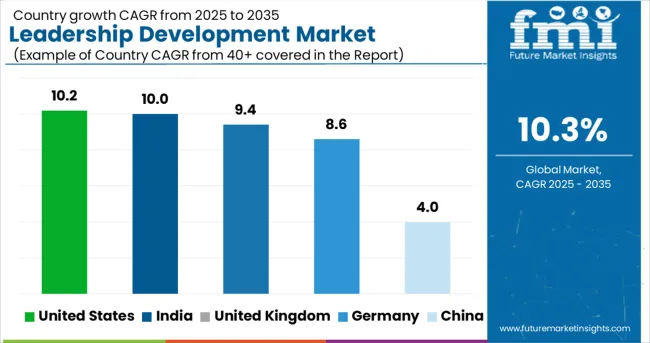
The provided table illustrates the top five countries in terms of revenue, with China leading the list.

China is considered a leader in the leadership development program market is its concerted efforts to invest in talent development and grooming future leaders to support its rapid economic growth and global ambitions. The country places significant emphasis on leadership training programs to cultivate a skilled workforce capable of driving innovation, navigating complex business environments, and fostering sustainable development.

The proactive approach to leadership development and its strategic investments in education and training initiatives position it as a frontrunner in nurturing leadership talent and fostering organizational success.

Countries Forecast CAGRs from 2025 to 2035
United States 5.3%
Canada 8.5%
France 6.9%
China 11%
Australia 8.4%

Competitive Business Landscape Drives the United States Market

In the United States, leadership development programs are extensively utilized due to the highly competitive business landscape and the constant need for effective leadership to drive innovation and growth.

These programs are crucial for developing the next generation of leaders who can navigate complex challenges, foster organizational success, and maintain a competitive edge in the global market.

Diverse Workforce Needs Booms the Market Growth in Canada

Canada emphasizes leadership development programs to address the evolving needs of its diverse workforce and industries. With a focus on promoting talent retention and succession planning, these programs play a vital role in grooming leaders who can effectively lead teams, drive organizational change, and adapt to shifting market dynamics while upholding diversity, equity, and inclusion values.

Cultural Nuances and Values Boost the Market in France

In France, leadership development programs are essential for nurturing leaders who can navigate the dynamic business environment and cultural nuances.

The programs focus on developing leadership competencies that align with collaboration, innovation, and sustainability values, fostering a leadership pipeline that drives organizational success while respecting societal and environmental responsibilities.

Economic Growth and Global Ambitions Surges the China Market

China strongly emphasizes leadership development programs to support its rapid economic growth, technological advancements, and global expansion ambitions.

The programs are instrumental in cultivating leaders who can lead with agility, foster innovation, and navigate complex business landscapes, enabling Chinese organizations to maintain competitiveness and drive sustainable growth in domestic and international markets.

Resilience in Diverse Industries Boosts Market Growth in Australia

Australia prioritizes leadership development programs to address the unique challenges and opportunities its diverse industries and geographical landscape presents.

The programs focus on developing leaders who can drive resilience, adaptability, and innovation while addressing key issues such as environmental sustainability, workforce diversity, and digital transformation, positioning Australian organizations for long-term success in a rapidly changing world.

Competitive Landscape

In the competitive landscape of the leadership development program market, numerous providers vie for market share. Established players offer comprehensive programs tailored to diverse industries and organizational needs, leveraging their expertise and reputation to attract clients.

Boutique firms and independent consultants cater to niche markets with specialized offerings, emphasizing personalized approaches and innovative solutions. New entrants, including online platforms and technology-enabled providers, disrupt the market by offering accessible, scalable, and customizable programs.

Some of the key developments are:

  • In March 2022, the Indian Institute of Management-Tiruchi unveiled a new strategic leadership development program tailored for senior executives, including chief general managers, department heads, and group heads of NLC India Limited, a government-owned enterprise.
  • In January 2022, Jaro Education, an Indian EdTech company, introduced a comprehensive leadership development program for employees. Encompassing areas such as leadership style, strategic planning, and team management, the program aims to cultivate leadership capabilities across all levels of the organization, fostering a culture of innovation and excellence.

Key Coverage of Leadership Development Program Market Report

  • Adjacent Study on Leadership Development Program Market, Custom Leadership Program Market
  • Leadership Development Market Size, Current Insights and Demographic Trends
  • Leadership Development Program Market Revenue & Trends
  • Reasons for Expanding Leadership Development Program Market
  • Government’s Role Behind the Flourishing Corporate Leadership Training Market in the United States

Report Scope Table - Leadership Development Program Market

Report Attributes Details
Current Total Market Size (2025) USD 89.54 billion
Projected Market Size (2035) USD 564.46 billion
CAGR (2025 to 2035) 10.3%
Base Year for Estimation 2024
Historical Period 2020 to 2024
Forecast Period 2025 to 2035
Quantitative Units USD billion for value
Learner Types Analyzed (Segment 1) Group/Small Team Learners, Individual/Private Learners
Program Participants Analyzed (Segment 2) Business Owners, Junior/Entry-Level Employees, Managers, Mid-Level Employees, Senior Executives, Students
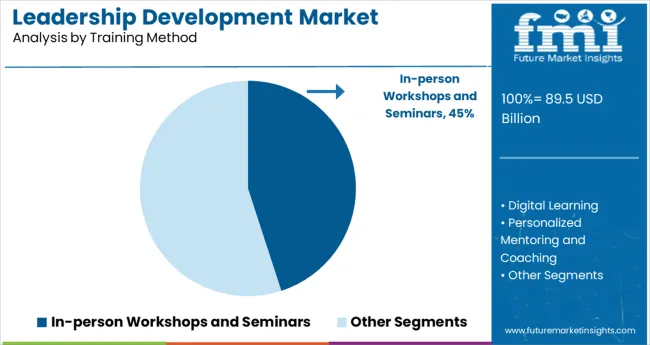
Learning Modes Covered (Segment 3) Online Learning, In-Person Learning
Program Duration Segments (Segment 4) Less Than 1 Week, 1 Week to 1 Month, More Than 1 Month
Regions Covered North America; Europe; Asia-Pacific; Latin America; Middle East & Africa
Countries Covered USA, China, Canada, France, Australia, India
Key Players Influencing the Market Articulate Global Inc., City & Guilds Group, D2L Corp., Franklin Covey Co., GP Strategies Corp., Interaction Associates Inc., Learning Technologies Group Plc, Miller Heiman Group Inc., Jaro Education, Skillsoft Ltd., Wilson Learning Worldwide Inc.
Additional Attributes Revenue growth by learner type, regional market penetration, demand by program duration and participant role
Customization and Pricing Customization and Pricing Available on Request

Leadership Development Program Market - Key Segments

By Learner Type:

  • Group/ Small Team Learners
  • Individual/ Private Learners

By Program Participants:

  • Business-Owners
  • Junior/ Entry-Level Employees
  • Managers
  • Mid-Level Employees
  • Senior Executives
  • Students

By Mode of Learning:

  • Online Learning
  • In-Person Learning

By Duration:

  • Less Than 1 Week
  • 1 Week To 1 Month
  • More Than 1 Month

By Region:

  • North America
  • Latin America
  • Western Europe
  • Eastern Europe
  • South Asia and Pacific
  • East Asia
  • Middle East and Africa

Table of Content

  • 1. Executive Summary
  • 2. Market Overview
  • 3. Market Background
  • 4. Global Market Analysis 2020 to 2024 and Forecast, 2025 to 2035
  • 5. Global Market Analysis 2020 to 2024 and Forecast 2025 to 2035, By Learner Type
    • 5.1. Group/ Small Team Learners
    • 5.2. Individual/ Private Learners
  • 6. Global Market Analysis 2020 to 2024 and Forecast 2025 to 2035, By Program Participants
    • 6.1. Business-Owners
    • 6.2. Junior/ Entry-Level Employees
    • 6.3. Managers
    • 6.4. Mid-Level Employees
    • 6.5. Senior Executives
    • 6.6. Students
  • 7. Global Market Analysis 2020 to 2024 and Forecast 2025 to 2035, By Mode of Learning
    • 7.1. Online Learning
    • 7.2. In-Person Learning
  • 8. Global Market Analysis 2020 to 2024 and Forecast 2025 to 2035, By Duration
    • 8.1. Less Than 1 Week
    • 8.2. 1 Week To 1 Month
    • 8.3. More Than 1 Month
  • 9. Global Market Analysis 2020 to 2024 and Forecast 2025 to 2035, By Region
    • 9.1. North America
    • 9.2. Latin America
    • 9.3. Western Europe
    • 9.4. Eastern Europe
    • 9.5. South Asia and Pacific
    • 9.6. East Asia
    • 9.7. Middle East and Africa
  • 10. North America Market Analysis 2020 to 2024 and Forecast 2025 to 2035, By Country
  • 11. Latin America Market Analysis 2020 to 2024 and Forecast 2025 to 2035, By Country
  • 12. Western Europe Market Analysis 2020 to 2024 and Forecast 2025 to 2035, By Country
  • 13. Eastern Europe Market Analysis 2020 to 2024 and Forecast 2025 to 2035, By Country
  • 14. South Asia and Pacific Market Analysis 2020 to 2024 and Forecast 2025 to 2035, By Country
  • 15. East Asia Market Analysis 2020 to 2024 and Forecast 2025 to 2035, By Country
  • 16. Middle East and Africa Market Analysis 2020 to 2024 and Forecast 2025 to 2035, By Country
  • 17. Key Countries Market Analysis
  • 18. Market Structure Analysis
  • 19. Competition Analysis
    • 19.1. Articulate Global Inc.
    • 19.2. City & Guilds Group
    • 19.3. D2L Corp.
    • 19.4. Franklin Covey Co.
    • 19.5. GP Strategies Corp.
    • 19.6. Interaction Associates Inc.
    • 19.7. Learning Technologies Group Plc
    • 19.8. Miller Heiman Group Inc.
    • 19.9. Jaro Education
    • 19.10. Skillsoft Ltd.
    • 19.11. Wilson Learning Worldwide Inc.
  • 20. Assumptions & Acronyms Used
  • 21. Research Methodology

List of Tables

Table 1: Global Market Value (US$ Million) Forecast by Region, 2019 to 2034

Table 2: Global Market Value (US$ Million) Forecast by Learner Type, 2019 to 2034

Table 3: Global Market Value (US$ Million) Forecast by Program Participants, 2019 to 2034

Table 4: Global Market Value (US$ Million) Forecast by Mode of Learning, 2019 to 2034

Table 5: Global Market Value (US$ Million) Forecast by Duration, 2019 to 2034

Table 6: North America Market Value (US$ Million) Forecast by Country, 2019 to 2034

Table 7: North America Market Value (US$ Million) Forecast by Learner Type, 2019 to 2034

Table 8: North America Market Value (US$ Million) Forecast by Program Participants, 2019 to 2034

Table 9: North America Market Value (US$ Million) Forecast by Mode of Learning, 2019 to 2034

Table 10: North America Market Value (US$ Million) Forecast by Duration, 2019 to 2034

Table 11: Latin America Market Value (US$ Million) Forecast by Country, 2019 to 2034

Table 12: Latin America Market Value (US$ Million) Forecast by Learner Type, 2019 to 2034

Table 13: Latin America Market Value (US$ Million) Forecast by Program Participants, 2019 to 2034

Table 14: Latin America Market Value (US$ Million) Forecast by Mode of Learning, 2019 to 2034

Table 15: Latin America Market Value (US$ Million) Forecast by Duration, 2019 to 2034

Table 16: Western Europe Market Value (US$ Million) Forecast by Country, 2019 to 2034

Table 17: Western Europe Market Value (US$ Million) Forecast by Learner Type, 2019 to 2034

Table 18: Western Europe Market Value (US$ Million) Forecast by Program Participants, 2019 to 2034

Table 19: Western Europe Market Value (US$ Million) Forecast by Mode of Learning, 2019 to 2034

Table 20: Western Europe Market Value (US$ Million) Forecast by Duration, 2019 to 2034

Table 21: Eastern Europe Market Value (US$ Million) Forecast by Country, 2019 to 2034

Table 22: Eastern Europe Market Value (US$ Million) Forecast by Learner Type, 2019 to 2034

Table 23: Eastern Europe Market Value (US$ Million) Forecast by Program Participants, 2019 to 2034

Table 24: Eastern Europe Market Value (US$ Million) Forecast by Mode of Learning, 2019 to 2034

Table 25: Eastern Europe Market Value (US$ Million) Forecast by Duration, 2019 to 2034

Table 26: South Asia and Pacific Market Value (US$ Million) Forecast by Country, 2019 to 2034

Table 27: South Asia and Pacific Market Value (US$ Million) Forecast by Learner Type, 2019 to 2034

Table 28: South Asia and Pacific Market Value (US$ Million) Forecast by Program Participants, 2019 to 2034

Table 29: South Asia and Pacific Market Value (US$ Million) Forecast by Mode of Learning, 2019 to 2034

Table 30: South Asia and Pacific Market Value (US$ Million) Forecast by Duration, 2019 to 2034

Table 31: East Asia Market Value (US$ Million) Forecast by Country, 2019 to 2034

Table 32: East Asia Market Value (US$ Million) Forecast by Learner Type, 2019 to 2034

Table 33: East Asia Market Value (US$ Million) Forecast by Program Participants, 2019 to 2034

Table 34: East Asia Market Value (US$ Million) Forecast by Mode of Learning, 2019 to 2034

Table 35: East Asia Market Value (US$ Million) Forecast by Duration, 2019 to 2034

Table 36: Middle East and Africa Market Value (US$ Million) Forecast by Country, 2019 to 2034

Table 37: Middle East and Africa Market Value (US$ Million) Forecast by Learner Type, 2019 to 2034

Table 38: Middle East and Africa Market Value (US$ Million) Forecast by Program Participants, 2019 to 2034

Table 39: Middle East and Africa Market Value (US$ Million) Forecast by Mode of Learning, 2019 to 2034

Table 40: Middle East and Africa Market Value (US$ Million) Forecast by Duration, 2019 to 2034

List of Figures

Figure 1: Global Market Value (US$ Million) by Learner Type, 2024 to 2034

Figure 2: Global Market Value (US$ Million) by Program Participants, 2024 to 2034

Figure 3: Global Market Value (US$ Million) by Mode of Learning, 2024 to 2034

Figure 4: Global Market Value (US$ Million) by Duration, 2024 to 2034

Figure 5: Global Market Value (US$ Million) by Region, 2024 to 2034

Figure 6: Global Market Value (US$ Million) Analysis by Region, 2019 to 2034

Figure 7: Global Market Value Share (%) and BPS Analysis by Region, 2024 to 2034

Figure 8: Global Market Y-o-Y Growth (%) Projections by Region, 2024 to 2034

Figure 9: Global Market Value (US$ Million) Analysis by Learner Type, 2019 to 2034

Figure 10: Global Market Value Share (%) and BPS Analysis by Learner Type, 2024 to 2034

Figure 11: Global Market Y-o-Y Growth (%) Projections by Learner Type, 2024 to 2034

Figure 12: Global Market Value (US$ Million) Analysis by Program Participants, 2019 to 2034

Figure 13: Global Market Value Share (%) and BPS Analysis by Program Participants, 2024 to 2034

Figure 14: Global Market Y-o-Y Growth (%) Projections by Program Participants, 2024 to 2034

Figure 15: Global Market Value (US$ Million) Analysis by Mode of Learning, 2019 to 2034

Figure 16: Global Market Value Share (%) and BPS Analysis by Mode of Learning, 2024 to 2034

Figure 17: Global Market Y-o-Y Growth (%) Projections by Mode of Learning, 2024 to 2034

Figure 18: Global Market Value (US$ Million) Analysis by Duration, 2019 to 2034

Figure 19: Global Market Value Share (%) and BPS Analysis by Duration, 2024 to 2034

Figure 20: Global Market Y-o-Y Growth (%) Projections by Duration, 2024 to 2034

Figure 21: Global Market Attractiveness by Learner Type, 2024 to 2034

Figure 22: Global Market Attractiveness by Program Participants, 2024 to 2034

Figure 23: Global Market Attractiveness by Mode of Learning, 2024 to 2034

Figure 24: Global Market Attractiveness by Duration, 2024 to 2034

Figure 25: Global Market Attractiveness by Region, 2024 to 2034

Figure 26: North America Market Value (US$ Million) by Learner Type, 2024 to 2034

Figure 27: North America Market Value (US$ Million) by Program Participants, 2024 to 2034

Figure 28: North America Market Value (US$ Million) by Mode of Learning, 2024 to 2034

Figure 29: North America Market Value (US$ Million) by Duration, 2024 to 2034

Figure 30: North America Market Value (US$ Million) by Country, 2024 to 2034

Figure 31: North America Market Value (US$ Million) Analysis by Country, 2019 to 2034

Figure 32: North America Market Value Share (%) and BPS Analysis by Country, 2024 to 2034

Figure 33: North America Market Y-o-Y Growth (%) Projections by Country, 2024 to 2034

Figure 34: North America Market Value (US$ Million) Analysis by Learner Type, 2019 to 2034

Figure 35: North America Market Value Share (%) and BPS Analysis by Learner Type, 2024 to 2034

Figure 36: North America Market Y-o-Y Growth (%) Projections by Learner Type, 2024 to 2034

Figure 37: North America Market Value (US$ Million) Analysis by Program Participants, 2019 to 2034

Figure 38: North America Market Value Share (%) and BPS Analysis by Program Participants, 2024 to 2034

Figure 39: North America Market Y-o-Y Growth (%) Projections by Program Participants, 2024 to 2034

Figure 40: North America Market Value (US$ Million) Analysis by Mode of Learning, 2019 to 2034

Figure 41: North America Market Value Share (%) and BPS Analysis by Mode of Learning, 2024 to 2034

Figure 42: North America Market Y-o-Y Growth (%) Projections by Mode of Learning, 2024 to 2034

Figure 43: North America Market Value (US$ Million) Analysis by Duration, 2019 to 2034

Figure 44: North America Market Value Share (%) and BPS Analysis by Duration, 2024 to 2034

Figure 45: North America Market Y-o-Y Growth (%) Projections by Duration, 2024 to 2034

Figure 46: North America Market Attractiveness by Learner Type, 2024 to 2034

Figure 47: North America Market Attractiveness by Program Participants, 2024 to 2034

Figure 48: North America Market Attractiveness by Mode of Learning, 2024 to 2034

Figure 49: North America Market Attractiveness by Duration, 2024 to 2034

Figure 50: North America Market Attractiveness by Country, 2024 to 2034

Figure 51: Latin America Market Value (US$ Million) by Learner Type, 2024 to 2034

Figure 52: Latin America Market Value (US$ Million) by Program Participants, 2024 to 2034

Figure 53: Latin America Market Value (US$ Million) by Mode of Learning, 2024 to 2034

Figure 54: Latin America Market Value (US$ Million) by Duration, 2024 to 2034

Figure 55: Latin America Market Value (US$ Million) by Country, 2024 to 2034

Figure 56: Latin America Market Value (US$ Million) Analysis by Country, 2019 to 2034

Figure 57: Latin America Market Value Share (%) and BPS Analysis by Country, 2024 to 2034

Figure 58: Latin America Market Y-o-Y Growth (%) Projections by Country, 2024 to 2034

Figure 59: Latin America Market Value (US$ Million) Analysis by Learner Type, 2019 to 2034

Figure 60: Latin America Market Value Share (%) and BPS Analysis by Learner Type, 2024 to 2034

Figure 61: Latin America Market Y-o-Y Growth (%) Projections by Learner Type, 2024 to 2034

Figure 62: Latin America Market Value (US$ Million) Analysis by Program Participants, 2019 to 2034

Figure 63: Latin America Market Value Share (%) and BPS Analysis by Program Participants, 2024 to 2034

Figure 64: Latin America Market Y-o-Y Growth (%) Projections by Program Participants, 2024 to 2034

Figure 65: Latin America Market Value (US$ Million) Analysis by Mode of Learning, 2019 to 2034

Figure 66: Latin America Market Value Share (%) and BPS Analysis by Mode of Learning, 2024 to 2034

Figure 67: Latin America Market Y-o-Y Growth (%) Projections by Mode of Learning, 2024 to 2034

Figure 68: Latin America Market Value (US$ Million) Analysis by Duration, 2019 to 2034

Figure 69: Latin America Market Value Share (%) and BPS Analysis by Duration, 2024 to 2034

Figure 70: Latin America Market Y-o-Y Growth (%) Projections by Duration, 2024 to 2034

Figure 71: Latin America Market Attractiveness by Learner Type, 2024 to 2034

Figure 72: Latin America Market Attractiveness by Program Participants, 2024 to 2034

Figure 73: Latin America Market Attractiveness by Mode of Learning, 2024 to 2034

Figure 74: Latin America Market Attractiveness by Duration, 2024 to 2034

Figure 75: Latin America Market Attractiveness by Country, 2024 to 2034

Figure 76: Western Europe Market Value (US$ Million) by Learner Type, 2024 to 2034

Figure 77: Western Europe Market Value (US$ Million) by Program Participants, 2024 to 2034

Figure 78: Western Europe Market Value (US$ Million) by Mode of Learning, 2024 to 2034

Figure 79: Western Europe Market Value (US$ Million) by Duration, 2024 to 2034

Figure 80: Western Europe Market Value (US$ Million) by Country, 2024 to 2034

Figure 81: Western Europe Market Value (US$ Million) Analysis by Country, 2019 to 2034

Figure 82: Western Europe Market Value Share (%) and BPS Analysis by Country, 2024 to 2034

Figure 83: Western Europe Market Y-o-Y Growth (%) Projections by Country, 2024 to 2034

Figure 84: Western Europe Market Value (US$ Million) Analysis by Learner Type, 2019 to 2034

Figure 85: Western Europe Market Value Share (%) and BPS Analysis by Learner Type, 2024 to 2034

Figure 86: Western Europe Market Y-o-Y Growth (%) Projections by Learner Type, 2024 to 2034

Figure 87: Western Europe Market Value (US$ Million) Analysis by Program Participants, 2019 to 2034

Figure 88: Western Europe Market Value Share (%) and BPS Analysis by Program Participants, 2024 to 2034

Figure 89: Western Europe Market Y-o-Y Growth (%) Projections by Program Participants, 2024 to 2034

Figure 90: Western Europe Market Value (US$ Million) Analysis by Mode of Learning, 2019 to 2034

Figure 91: Western Europe Market Value Share (%) and BPS Analysis by Mode of Learning, 2024 to 2034

Figure 92: Western Europe Market Y-o-Y Growth (%) Projections by Mode of Learning, 2024 to 2034

Figure 93: Western Europe Market Value (US$ Million) Analysis by Duration, 2019 to 2034

Figure 94: Western Europe Market Value Share (%) and BPS Analysis by Duration, 2024 to 2034

Figure 95: Western Europe Market Y-o-Y Growth (%) Projections by Duration, 2024 to 2034

Figure 96: Western Europe Market Attractiveness by Learner Type, 2024 to 2034

Figure 97: Western Europe Market Attractiveness by Program Participants, 2024 to 2034

Figure 98: Western Europe Market Attractiveness by Mode of Learning, 2024 to 2034

Figure 99: Western Europe Market Attractiveness by Duration, 2024 to 2034

Figure 100: Western Europe Market Attractiveness by Country, 2024 to 2034

Figure 101: Eastern Europe Market Value (US$ Million) by Learner Type, 2024 to 2034

Figure 102: Eastern Europe Market Value (US$ Million) by Program Participants, 2024 to 2034

Figure 103: Eastern Europe Market Value (US$ Million) by Mode of Learning, 2024 to 2034

Figure 104: Eastern Europe Market Value (US$ Million) by Duration, 2024 to 2034

Figure 105: Eastern Europe Market Value (US$ Million) by Country, 2024 to 2034

Figure 106: Eastern Europe Market Value (US$ Million) Analysis by Country, 2019 to 2034

Figure 107: Eastern Europe Market Value Share (%) and BPS Analysis by Country, 2024 to 2034

Figure 108: Eastern Europe Market Y-o-Y Growth (%) Projections by Country, 2024 to 2034

Figure 109: Eastern Europe Market Value (US$ Million) Analysis by Learner Type, 2019 to 2034

Figure 110: Eastern Europe Market Value Share (%) and BPS Analysis by Learner Type, 2024 to 2034

Figure 111: Eastern Europe Market Y-o-Y Growth (%) Projections by Learner Type, 2024 to 2034

Figure 112: Eastern Europe Market Value (US$ Million) Analysis by Program Participants, 2019 to 2034

Figure 113: Eastern Europe Market Value Share (%) and BPS Analysis by Program Participants, 2024 to 2034

Figure 114: Eastern Europe Market Y-o-Y Growth (%) Projections by Program Participants, 2024 to 2034

Figure 115: Eastern Europe Market Value (US$ Million) Analysis by Mode of Learning, 2019 to 2034

Figure 116: Eastern Europe Market Value Share (%) and BPS Analysis by Mode of Learning, 2024 to 2034

Figure 117: Eastern Europe Market Y-o-Y Growth (%) Projections by Mode of Learning, 2024 to 2034

Figure 118: Eastern Europe Market Value (US$ Million) Analysis by Duration, 2019 to 2034

Figure 119: Eastern Europe Market Value Share (%) and BPS Analysis by Duration, 2024 to 2034

Figure 120: Eastern Europe Market Y-o-Y Growth (%) Projections by Duration, 2024 to 2034

Figure 121: Eastern Europe Market Attractiveness by Learner Type, 2024 to 2034

Figure 122: Eastern Europe Market Attractiveness by Program Participants, 2024 to 2034

Figure 123: Eastern Europe Market Attractiveness by Mode of Learning, 2024 to 2034

Figure 124: Eastern Europe Market Attractiveness by Duration, 2024 to 2034

Figure 125: Eastern Europe Market Attractiveness by Country, 2024 to 2034

Figure 126: South Asia and Pacific Market Value (US$ Million) by Learner Type, 2024 to 2034

Figure 127: South Asia and Pacific Market Value (US$ Million) by Program Participants, 2024 to 2034

Figure 128: South Asia and Pacific Market Value (US$ Million) by Mode of Learning, 2024 to 2034

Figure 129: South Asia and Pacific Market Value (US$ Million) by Duration, 2024 to 2034

Figure 130: South Asia and Pacific Market Value (US$ Million) by Country, 2024 to 2034

Figure 131: South Asia and Pacific Market Value (US$ Million) Analysis by Country, 2019 to 2034

Figure 132: South Asia and Pacific Market Value Share (%) and BPS Analysis by Country, 2024 to 2034

Figure 133: South Asia and Pacific Market Y-o-Y Growth (%) Projections by Country, 2024 to 2034

Figure 134: South Asia and Pacific Market Value (US$ Million) Analysis by Learner Type, 2019 to 2034

Figure 135: South Asia and Pacific Market Value Share (%) and BPS Analysis by Learner Type, 2024 to 2034

Figure 136: South Asia and Pacific Market Y-o-Y Growth (%) Projections by Learner Type, 2024 to 2034

Figure 137: South Asia and Pacific Market Value (US$ Million) Analysis by Program Participants, 2019 to 2034

Figure 138: South Asia and Pacific Market Value Share (%) and BPS Analysis by Program Participants, 2024 to 2034

Figure 139: South Asia and Pacific Market Y-o-Y Growth (%) Projections by Program Participants, 2024 to 2034

Figure 140: South Asia and Pacific Market Value (US$ Million) Analysis by Mode of Learning, 2019 to 2034

Figure 141: South Asia and Pacific Market Value Share (%) and BPS Analysis by Mode of Learning, 2024 to 2034

Figure 142: South Asia and Pacific Market Y-o-Y Growth (%) Projections by Mode of Learning, 2024 to 2034

Figure 143: South Asia and Pacific Market Value (US$ Million) Analysis by Duration, 2019 to 2034

Figure 144: South Asia and Pacific Market Value Share (%) and BPS Analysis by Duration, 2024 to 2034

Figure 145: South Asia and Pacific Market Y-o-Y Growth (%) Projections by Duration, 2024 to 2034

Figure 146: South Asia and Pacific Market Attractiveness by Learner Type, 2024 to 2034

Figure 147: South Asia and Pacific Market Attractiveness by Program Participants, 2024 to 2034

Figure 148: South Asia and Pacific Market Attractiveness by Mode of Learning, 2024 to 2034

Figure 149: South Asia and Pacific Market Attractiveness by Duration, 2024 to 2034

Figure 150: South Asia and Pacific Market Attractiveness by Country, 2024 to 2034

Figure 151: East Asia Market Value (US$ Million) by Learner Type, 2024 to 2034

Figure 152: East Asia Market Value (US$ Million) by Program Participants, 2024 to 2034

Figure 153: East Asia Market Value (US$ Million) by Mode of Learning, 2024 to 2034

Figure 154: East Asia Market Value (US$ Million) by Duration, 2024 to 2034

Figure 155: East Asia Market Value (US$ Million) by Country, 2024 to 2034

Figure 156: East Asia Market Value (US$ Million) Analysis by Country, 2019 to 2034

Figure 157: East Asia Market Value Share (%) and BPS Analysis by Country, 2024 to 2034

Figure 158: East Asia Market Y-o-Y Growth (%) Projections by Country, 2024 to 2034

Figure 159: East Asia Market Value (US$ Million) Analysis by Learner Type, 2019 to 2034

Figure 160: East Asia Market Value Share (%) and BPS Analysis by Learner Type, 2024 to 2034

Figure 161: East Asia Market Y-o-Y Growth (%) Projections by Learner Type, 2024 to 2034

Figure 162: East Asia Market Value (US$ Million) Analysis by Program Participants, 2019 to 2034

Figure 163: East Asia Market Value Share (%) and BPS Analysis by Program Participants, 2024 to 2034

Figure 164: East Asia Market Y-o-Y Growth (%) Projections by Program Participants, 2024 to 2034

Figure 165: East Asia Market Value (US$ Million) Analysis by Mode of Learning, 2019 to 2034

Figure 166: East Asia Market Value Share (%) and BPS Analysis by Mode of Learning, 2024 to 2034

Figure 167: East Asia Market Y-o-Y Growth (%) Projections by Mode of Learning, 2024 to 2034

Figure 168: East Asia Market Value (US$ Million) Analysis by Duration, 2019 to 2034

Figure 169: East Asia Market Value Share (%) and BPS Analysis by Duration, 2024 to 2034

Figure 170: East Asia Market Y-o-Y Growth (%) Projections by Duration, 2024 to 2034

Figure 171: East Asia Market Attractiveness by Learner Type, 2024 to 2034

Figure 172: East Asia Market Attractiveness by Program Participants, 2024 to 2034

Figure 173: East Asia Market Attractiveness by Mode of Learning, 2024 to 2034

Figure 174: East Asia Market Attractiveness by Duration, 2024 to 2034

Figure 175: East Asia Market Attractiveness by Country, 2024 to 2034

Figure 176: Middle East and Africa Market Value (US$ Million) by Learner Type, 2024 to 2034

Figure 177: Middle East and Africa Market Value (US$ Million) by Program Participants, 2024 to 2034

Figure 178: Middle East and Africa Market Value (US$ Million) by Mode of Learning, 2024 to 2034

Figure 179: Middle East and Africa Market Value (US$ Million) by Duration, 2024 to 2034

Figure 180: Middle East and Africa Market Value (US$ Million) by Country, 2024 to 2034

Figure 181: Middle East and Africa Market Value (US$ Million) Analysis by Country, 2019 to 2034

Figure 182: Middle East and Africa Market Value Share (%) and BPS Analysis by Country, 2024 to 2034

Figure 183: Middle East and Africa Market Y-o-Y Growth (%) Projections by Country, 2024 to 2034

Figure 184: Middle East and Africa Market Value (US$ Million) Analysis by Learner Type, 2019 to 2034

Figure 185: Middle East and Africa Market Value Share (%) and BPS Analysis by Learner Type, 2024 to 2034

Figure 186: Middle East and Africa Market Y-o-Y Growth (%) Projections by Learner Type, 2024 to 2034

Figure 187: Middle East and Africa Market Value (US$ Million) Analysis by Program Participants, 2019 to 2034

Figure 188: Middle East and Africa Market Value Share (%) and BPS Analysis by Program Participants, 2024 to 2034

Figure 189: Middle East and Africa Market Y-o-Y Growth (%) Projections by Program Participants, 2024 to 2034

Figure 190: Middle East and Africa Market Value (US$ Million) Analysis by Mode of Learning, 2019 to 2034

Figure 191: Middle East and Africa Market Value Share (%) and BPS Analysis by Mode of Learning, 2024 to 2034

Figure 192: Middle East and Africa Market Y-o-Y Growth (%) Projections by Mode of Learning, 2024 to 2034

Figure 193: Middle East and Africa Market Value (US$ Million) Analysis by Duration, 2019 to 2034

Figure 194: Middle East and Africa Market Value Share (%) and BPS Analysis by Duration, 2024 to 2034

Figure 195: Middle East and Africa Market Y-o-Y Growth (%) Projections by Duration, 2024 to 2034

Figure 196: Middle East and Africa Market Attractiveness by Learner Type, 2024 to 2034

Figure 197: Middle East and Africa Market Attractiveness by Program Participants, 2024 to 2034

Figure 198: Middle East and Africa Market Attractiveness by Mode of Learning, 2024 to 2034

Figure 199: Middle East and Africa Market Attractiveness by Duration, 2024 to 2034

Figure 200: Middle East and Africa Market Attractiveness by Country, 2024 to 2034

Frequently Asked Questions

What is the expected worth of the leadership development program market in 2025?

As of 2025, the market for leadership development programs is expected to be valued at USD 89.54 billion.

What is the anticipated market value for the leadership development program in 2035?

By 2035, the market value of the leadership development program is expected to reach USD 564.46 billion.

What is the projected forecast CAGR for the leadership development program market from 2025 to 2035?

From 2025 to 2035, the leadership development program market is expected to flourish at a CAGR of 10.3%

Based on learner type, which segment dominates the leadership development program market?

The individual/private learners segment is accounted to hold a market share of 52% in 2024.

Which country is likely to dominate the leadership development program market?

China is likely the top-performing market, with a CAGR of 11%.

Explore Similar Insights

Future Market Insights

Leadership Development Program Market