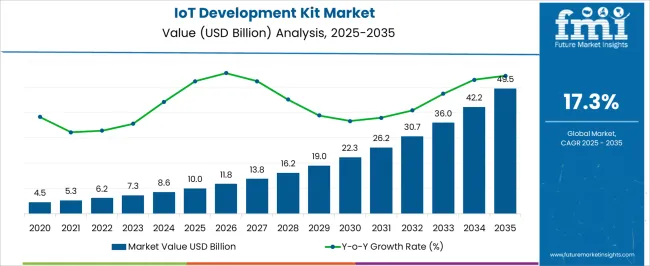
The IoT Development Kit Market is estimated to be valued at USD 10.0 billion in 2025 and is projected to reach USD 49.5 billion by 2035, registering a compound annual growth rate (CAGR) of 17.3% over the forecast period.

| Metric | Value |
|---|---|
| IoT Development Kit Market Estimated Value in (2025 E) | USD 10.0 billion |
| IoT Development Kit Market Forecast Value in (2035 F) | USD 49.5 billion |
| Forecast CAGR (2025 to 2035) | 17.3% |
The IoT development kit market is expanding rapidly due to the growing need for scalable, connected solutions across industrial, consumer, and municipal sectors. As digital transformation strategies become foundational across industries, IoT development kits are enabling faster prototyping, device integration, and real-time data processing at the edge.
Increasing adoption of microcontroller-based architectures, paired with enhanced wireless communication modules and low-power sensors, is creating new possibilities for product engineers and solution developers. The rise of open-source platforms, combined with support from semiconductor manufacturers through toolchains and SDKs, has led to faster development cycles and lower barriers to entry.
Additionally, global efforts to deploy smart infrastructure, from utilities to urban surveillance, are driving the integration of development kits into field-ready solutions Over the forecast period, the market is expected to benefit from enhanced focus on secure firmware, interoperable protocols, and AI-on-chip capabilities that align with the evolving standards of industrial automation, smart mobility, and urban resilience initiatives.
The market is segmented by Component and Application and region. By Component, the market is divided into Hardware and Software. In terms of Application, the market is classified into Smart Cities, Healthcare IT, Building Automation, and Others. Regionally, the market is classified into North America, Latin America, Western Europe, Eastern Europe, Balkan & Baltic Countries, Russia & Belarus, Central Asia, East Asia, South Asia & Pacific, and the Middle East & Africa.

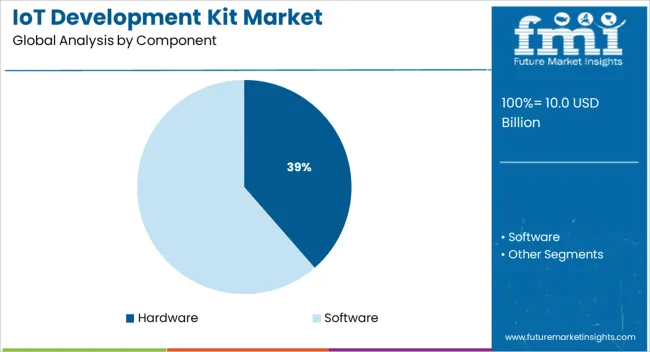
The hardware component segment is projected to account for 38.6% of the overall IoT development kit market revenue in 2025, driven by increased demand for reliable prototyping platforms that support rapid hardware iteration and field testing. The growing complexity of embedded systems, combined with requirements for real-time performance and energy efficiency, has fueled adoption of development boards, processors, communication modules, and integrated sensor kits.
Hardware platforms that support wireless standards such as LoRa, Zigbee, WiFi, and 5G have enabled seamless connectivity across diverse IoT environments. In addition, the scalability of modular hardware systems has allowed developers to tailor devices for specific use cases in sectors like smart homes, industrial control, and agriculture.
Strong support from semiconductor OEMs through reference designs and pre-certified components has further reduced design friction, accelerating time-to-market The shift toward edge intelligence and on-device processing has also increased the relevance of AI-ready hardware kits, allowing the deployment of smarter, more autonomous IoT solutions.

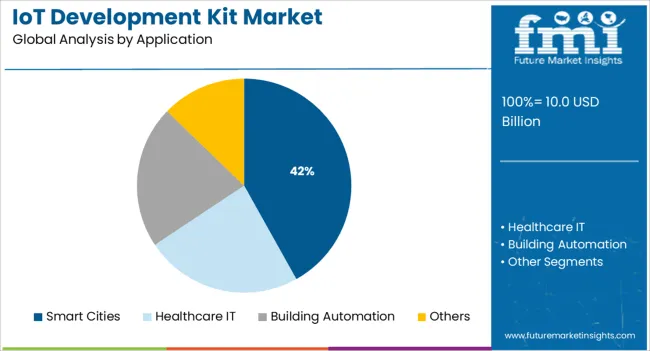
The smart cities application segment is expected to contribute 41.9% of the total revenue share in the IoT development kit market in 2025, underscoring its dominance in the deployment landscape. Urban infrastructure modernization initiatives have been the key catalyst behind the segment’s growth, with development kits being used to create solutions for traffic management, public safety, waste monitoring, and energy optimization.
As municipalities seek scalable and cost-effective tools to implement smart grid systems and real-time surveillance, IoT development kits have enabled experimentation and rapid deployment of connected solutions. These kits support integration with cloud platforms and edge gateways, facilitating remote diagnostics and dynamic updates, which are essential for mission-critical urban operations.
The increasing availability of multi-protocol kits with environmental sensors, camera interfaces, and GPS modules has enhanced flexibility in designing smart urban networks Furthermore, ongoing government investments in smart city infrastructure and pilot programs are expected to reinforce demand for development kits as foundational tools for innovation in public sector digitization.
The IoT development kits market is expanding as a result of the growing need for IoT remote monitoring systems for predictive maintenance and reducing operational costs. In addition, it is anticipated that in the upcoming years, the demand for IoT development kits would be affected by the expanding usage of connected devices, the development of wireless technologies, the increasing use of IoT devices, and the modernization of infrastructure. Systems for control and automation that are IoT-enabled aid service delivery for enterprises, remote employees, and manufacturing.
The use of IoT development kits, on the other hand, is growing in telemedicine to support healthcare professionals in monitoring their patients, accessing the data, and providing therapy from a distance utilizing smart devices.
The IoT sensors keep an eye on a number of building-related factors, environmental conditions, and system energy usage. As a result of the IoT sensors' numerous benefits, there is a growing market for IoT remote monitoring systems, which is boosting the expansion of the IoT development kit industry.
Many IoT development kits have cloud connectivity, either to a general-purpose cloud platform from Microsoft, Google, Amazon, or IBM or to an IoT-specific cloud platform like Medium One or Particle. When data is stored and processed locally, on a storage device nearby an IoT device, or at the network's edge, cloud infrastructure is becoming increasingly often used in IoT design.
The data are delivered to the cloud after being sorted and processed on edge, which lowers network strain and enables quicker operation of an IoT device. Many of these cloud services provide free or inexpensive solutions to connect a few devices.
Currently, North America is the market leader, expected to hold almost 35.6% of the market in 2025. The consumer electronics sector of this region is booming, which is fueling the need for IoT development kits. Due to the presence of several prominent players, North America is anticipated to maintain its lead in the IoT development kit market over the forecast period.
The North American IoT development kit market has expanded as a result of rising internet usage in countries with developing technology as well as the expanding use of wireless sensors and networks in key end-use industries like healthcare, retail, consumer electronics, industrial, automotive, and transportation.
The market is also expanding as a result of increased research and development (R&D) in the IoT space for new and enhanced technologies, as well as an increase in consumer demand for better lifestyle options.
With roughly 24.1% of the market, Europe is the second-largest market share holder. Since IoT devices are being used more widely there, the region is predicted to develop rapidly throughout the projection period.
Additionally, the market is likely to expand in the area as more IoT sensors are being adopted by sectors including automotive, food and beverage, transportation, and others for monitoring. Together with important stakeholders, the European Commission has been working hard to create the ideal European IoT ecosystem and has started a dedicated cluster of R&D initiatives to address security and privacy concerns and promote confidence in IoT solutions.
To manage the zettabytes of data generated by tiny, omnipresent IoT devices, cloud connection is becoming an increasingly essential component of the IoT. Using sensors, analogue and electrical devices, and connection modules, startups are producing IoT development kits that offer a whole solution for cloud connectivity.
Example:
IoT solutions for infrastructure, applications, and security provide new experiences and drive better operations using data gathered at the Intelligent Edge. Large corporations are focusing on developers that wish to create Internet of Things devices. In addition to the industry-standard hardware components needed to swiftly prototype a wireless IoT system from scratch, this kit also contains the software frameworks, network stacks, and cloud connectivity capabilities necessary to safely connect and authenticate devices to the cloud.
Example:
| Report Attribute | Details |
|---|---|
| Growth Rate | CAGR of 17.3% from 2025 to 2035 |
| Base Year for Estimation | 2024 |
| Historical Data | 2020 to 2024 |
| Forecast Period | 2025 to 2035 |
| Quantitative Units | Revenue in USD Billion and CAGR from 2025 to 2035 |
| Report Coverage | Revenue Forecast, Volume Forecast, Company Ranking, Competitive Landscape, Growth Factors, Trends, and Pricing Analysis |
| Segments Covered | Component, Application, Region |
| Regions Covered | North America; Latin America; The Asia Pacific; Middle East and Africa; Europe |
| Key Countries Profiled | The USA, Canada, Brazil, Argentina, Germany, The United Kingdom, France, Spain, Italy, Nordics, BENELUX, Australia & New Zealand, China, India, ASIAN, GCC, South Africa |
| Key Companies Profiled | Google; Amazon AWS; Microsoft Azure; ARM; Broadcom; Gemalto; Intel; Others. |
| Customization | Available Upon Request |
The global IoT development kit market is estimated to be valued at USD 10.0 billion in 2025.
The market size for the IoT development kit market is projected to reach USD 49.5 billion by 2035.
The IoT development kit market is expected to grow at a 17.3% CAGR between 2025 and 2035.
The key product types in IoT development kit market are hardware, _sensors, _actuators, _power supplies, _expansion board, _others and software.
In terms of application, smart cities segment to command 41.9% share in the IoT development kit market in 2025.


Full Research Suite comprises of:
Market outlook & trends analysis
Interviews & case studies
Strategic recommendations
Vendor profiles & capabilities analysis
5-year forecasts
8 regions and 60+ country-level data splits
Market segment data splits
12 months of continuous data updates
DELIVERED AS:
PDF EXCEL ONLINE
IoT Network Management Market Size and Share Forecast Outlook 2025 to 2035
IoT Spend by Logistics Market Size and Share Forecast Outlook 2025 to 2035
IoT Chip Market Size and Share Forecast Outlook 2025 to 2035
IoT Device Management Market Size and Share Forecast Outlook 2025 to 2035
IoT Application Enablement Market Size and Share Forecast Outlook 2025 to 2035
IoT In Aviation Market Size and Share Forecast Outlook 2025 to 2035
IoT Processor Market Size and Share Forecast Outlook 2025 to 2035
IoT in Manufacturing Market Size and Share Forecast Outlook 2025 to 2035
IoT For Cold Chain Monitoring Market Size and Share Forecast Outlook 2025 to 2035
IoT Connectivity Management Platform Market Size and Share Forecast Outlook 2025 to 2035
IoT-based Asset Tracking and Monitoring Market Size and Share Forecast Outlook 2025 to 2035
IoT In Construction Market Size and Share Forecast Outlook 2025 to 2035
IoT Device Management Platform Market Size and Share Forecast Outlook 2025 to 2035
IoT Testing Equipment Market Size and Share Forecast Outlook 2025 to 2035
IoT in Utilities Market Size and Share Forecast Outlook 2025 to 2035
IoT Communication Protocol Market - Insights & Industry Trends 2025 to 2035
IoT in Healthcare Market Insights - Trends & Forecast 2025 to 2035
IoT for Public Safety Market
IoT Data Governance Market
IoT in Product Development Market Analysis - Growth & Forecast 2025 to 2035

Thank you!
You will receive an email from our Business Development Manager. Please be sure to check your SPAM/JUNK folder too.
Chat With
MaRIA