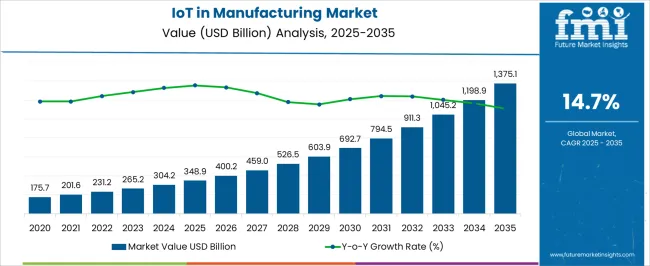
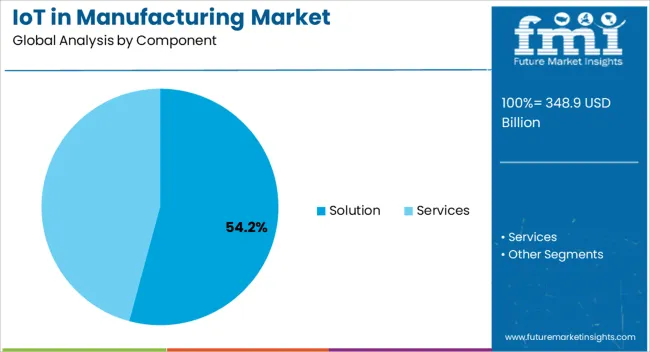
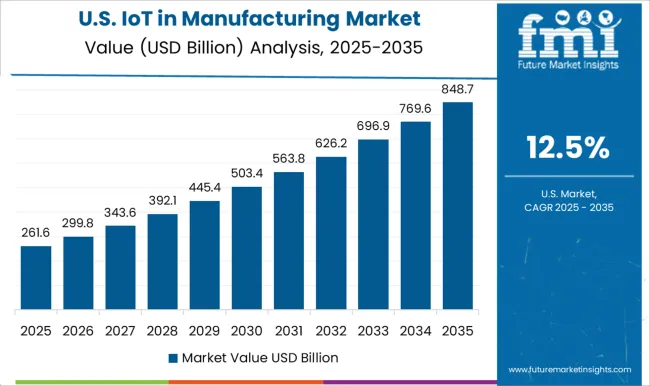
The IoT in manufacturing market is expected to expand its roots at a steady CAGR of 14.7% during the forecast period. The market is likely to hold a revenue of USD 265.2 billion in 2023 while it is anticipated to cross a value of USD 948.6 billion by 2033.
The research report on the IoT in manufacturing market states that the higher penetration of IoT, AI, cloud computing, and ML in industrial spaces is garnering market growth. Furthermore, the ease and higher productivity delivered by the rapid automation of the manufacturing units are pushing competitors to adopt the recent technology.
The concept of AIoT which stands for artificial intelligence of things is likely to close the gap in data performance and utilization. Thus, the AI and IoT convergence in manufacturing is creating new opportunities for the product manufacturing landscape. The enhanced security layering has also become the backbone of increased cyber resiliency, making IoT integration safer than ever. The restoration of production and manufacturing facilities post-pandemic is backed by extended research and development programs. This has resulted in the addition of sensor technology advancements, sensing temperature, weight, state, etc. The power of cyber-physical systems and other internet technologies is projected to improve the production process and supply chain.
IoT in manufacturing market analysis explains that the dynamic of connected products eases manufacturing procedures while cutting costs of labor. The IoT in manufacturing spaces is transforming how industries utilize, communicate, and operate data. The other elements of the fifth industrial revolution and its cooperation with leading companies and SMEs are anticipated to fuel market growth.
Attributes | Details |
---|---|
IoT in Manufacturing Market CAGR (2023 to 2033) | 14.7% |
IoT in Manufacturing Market Size (2023) | USD 265.2 billion |
IoT in Manufacturing Market Size (2033) | USD 948.6 billion |
Short-term Growth (2023 to 2026): IoT and cyber-physical systems are the need of the hour. With highly productive systems and smooth supply chains, manufacturers look for 100% errorless proficiency. Furthermore, the new-age products and their production involving new technological additions are also flourishing the market growth. With these wide ranges of applications, the market is expected to hold USD 265.2 billion in 2023 while it is anticipated to reach USD 400.19 billion by 2026.
Mid-term Growth (2026 to 2029): The higher penetration of sustainability in manufacturing along with the integration of IoT and AI, adds value to the market trajectory. Higher production value along with the cost-cutting benefits delivered by it is fuelling the demand for IoT in manufacturing. This takes a market value from USD 400.19 billion in 2026 to a value of USD 603.89 billion in 2029.
Long-term Growth (2029 to 2033): This period is expected to witness the manufacturing units working along with AI, cloud computing, and IoT. This is anticipated to happen due to the improved network bandwidths and high-speed internet. Thus, the market is anticipated to thrive at a strong CAGR of 14.7% between 2023 and 2033.
Industrial expansion is witnessing the addition of advanced software and hardware while it becomes the center-point of transformation for other experiments. The addition of IoT in manufacturing is likely to add a new chapter to the history of production. There is a rising demand for agile production and operational efficiency along with the importance of intelligent machine applications. Alongside this, an increase in regulatory compliance around the globe is anticipated to boost the IoT in the manufacturing market. The IoT-integrated manufacturing devices accelerate predictive maintenance, track data, and deliver real-time insights.
Some key restraints for the market are lack of infrastructure, awareness, and capital. The brands that have lost their business during the pandemic period. Hence, surviving on limited capital sources is the only option that these businesses have. Furthermore, the semi-automatic alternatives with affordable pricing are also limiting the market growth. Another factor that limits the market growth is the integration of these standards in a way that Machine-to-Machine (M2M) communication. As it becomes more user-friendly and versatile.
Region/Country | United States |
---|---|
Revenue Share % (2022) | 20.5% |
Region/Country | Germany |
---|---|
Revenue Share % (2022) | 12.1% |
Region/Country | Japan |
---|---|
Revenue Share % (2022) | 8.6% |
Region/Country | Australia |
---|---|
Revenue Share % (2022) | 2.3% |
Region/Country | North America |
---|---|
Revenue Share % (2022) | 38.5% |
Region/Country | Europe |
---|---|
Revenue Share % (2022) | 24.3% |
Higher Industrial Automation, Availability of Infrastructure, and Increased Application of Robotics in Industrial Spaces Fuel the Regional Growth
The United States IoT in manufacturing market leads in terms of market share in the North American region. The region held a market share of 20.5% in 2022. North America has dominance in the IoT in the manufacturing market as it held a 38.5% global share in 2022. The developed economies in this region, such as the United States and Canada, are continuously investing in industrial research and development. Adding new technological layers to their manufacturing systems.
Manufacturers use IoT and analytics to operate and enhance their businesses to stay competitive. The application of smart sensors is also helping the producers in utilizing data, better communication, and enhanced productivity.
Restoration of Automotive Manufacturing, Error-less Manufacturing, and Integration of AI are garnering the Regional Growth
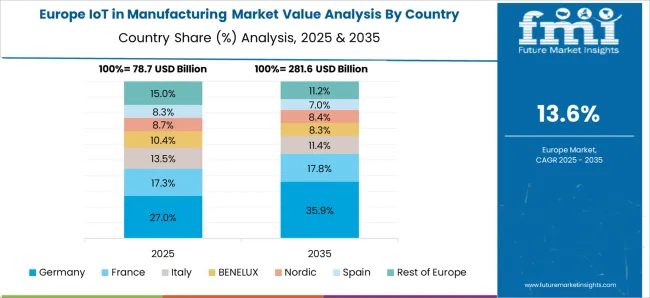
The German IoT in Manufacturing market held a market share of 12.1% in 2022 while the European Union held a market share of 24.3%. The growth is attributed to the existing automotive industry with large-scale parts manufacturing facilities. These firms have started automating and integrating them with advanced technology. Furthermore, these manufacturing facilities and their data processing has been made easy through the integration of IoT and artificial intelligence. The increased cross-border trade and investment are expected to improve the supply chain through the application of IoT.
Category | By Vertical |
---|---|
Leading Segment | Discrete Manufacturing |
Market Share (2022) | 57.6% |
Category | By Application |
---|---|
Leading Segment | Automation Control and Management |
Market Share (2022) | 19.3% |
Based on vertical type, discrete manufacturing leads as it held a substantial market share of 57.6% in 2022. The growth of this segment is due to the transforming IT and OT systems. The shift towards software-defined infrastructure and machines is also making the segment successful. Lastly, data-driven innovations are expected to decrease the barriers to IoT in manufacturing.
Based on application, the automation control and management segment lead as it held a market share of 19.3% in 2022. The growth is attributed to the IoT’s integration with computer automation controls. This further helps in streamlining the industrial systems, and tracking their performance while removing errors and inefficiencies.
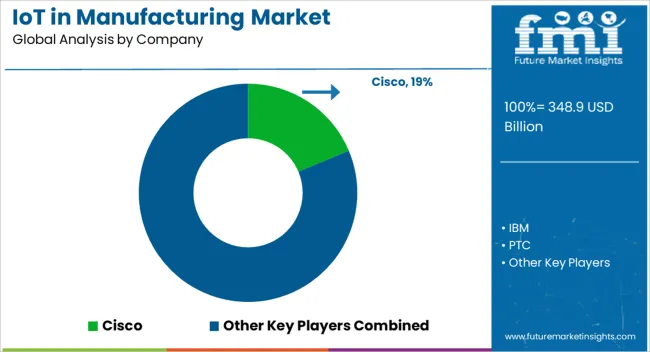
The key players in the market focus on delivering better integration options. The IoT hardware and software launched by vendors are updated with the ongoing functions and should be customizable. Furthermore, Industry 4.0’s other elements like artificial intelligence, and cloud computing are also being integrated with IoT deployments.
How can IoT in Manufacturing Vendors Providers Scale their Businesses in the Market?
Market players in the market are working on three key strategies.
Market Developments
Table 1: Global Market Value (US$ Million) Forecast by Region, 2018 to 2033
Table 2: Global Market Value (US$ Million) Forecast by Component, 2018 to 2033
Table 3: Global Market Value (US$ Million) Forecast by Solution, 2018 to 2033
Table 4: Global Market Value (US$ Million) Forecast by Services , 2018 to 2033
Table 5: Global Market Value (US$ Million) Forecast by Organisation Size, 2018 to 2033
Table 6: Global Market Value (US$ Million) Forecast by Deployment Mode, 2018 to 2033
Table 7: Global Market Value (US$ Million) Forecast by Application, 2018 to 2033
Table 8: Global Market Value (US$ Million) Forecast by Vertical, 2018 to 2033
Table 9: North America Market Value (US$ Million) Forecast by Country, 2018 to 2033
Table 10: North America Market Value (US$ Million) Forecast by Component, 2018 to 2033
Table 11: North America Market Value (US$ Million) Forecast by Solution, 2018 to 2033
Table 12: North America Market Value (US$ Million) Forecast by Services , 2018 to 2033
Table 13: North America Market Value (US$ Million) Forecast by Organisation Size, 2018 to 2033
Table 14: North America Market Value (US$ Million) Forecast by Deployment Mode, 2018 to 2033
Table 15: North America Market Value (US$ Million) Forecast by Application, 2018 to 2033
Table 16: North America Market Value (US$ Million) Forecast by Vertical, 2018 to 2033
Table 17: Latin America Market Value (US$ Million) Forecast by Country, 2018 to 2033
Table 18: Latin America Market Value (US$ Million) Forecast by Component, 2018 to 2033
Table 19: Latin America Market Value (US$ Million) Forecast by Solution, 2018 to 2033
Table 20: Latin America Market Value (US$ Million) Forecast by Services , 2018 to 2033
Table 21: Latin America Market Value (US$ Million) Forecast by Organisation Size, 2018 to 2033
Table 22: Latin America Market Value (US$ Million) Forecast by Deployment Mode, 2018 to 2033
Table 23: Latin America Market Value (US$ Million) Forecast by Application, 2018 to 2033
Table 24: Latin America Market Value (US$ Million) Forecast by Vertical, 2018 to 2033
Table 25: Europe Market Value (US$ Million) Forecast by Country, 2018 to 2033
Table 26: Europe Market Value (US$ Million) Forecast by Component, 2018 to 2033
Table 27: Europe Market Value (US$ Million) Forecast by Solution, 2018 to 2033
Table 28: Europe Market Value (US$ Million) Forecast by Services , 2018 to 2033
Table 29: Europe Market Value (US$ Million) Forecast by Organisation Size, 2018 to 2033
Table 30: Europe Market Value (US$ Million) Forecast by Deployment Mode, 2018 to 2033
Table 31: Europe Market Value (US$ Million) Forecast by Application, 2018 to 2033
Table 32: Europe Market Value (US$ Million) Forecast by Vertical, 2018 to 2033
Table 33: South Asia Market Value (US$ Million) Forecast by Country, 2018 to 2033
Table 34: South Asia Market Value (US$ Million) Forecast by Component, 2018 to 2033
Table 35: South Asia Market Value (US$ Million) Forecast by Solution, 2018 to 2033
Table 36: South Asia Market Value (US$ Million) Forecast by Services , 2018 to 2033
Table 37: South Asia Market Value (US$ Million) Forecast by Organisation Size, 2018 to 2033
Table 38: South Asia Market Value (US$ Million) Forecast by Deployment Mode, 2018 to 2033
Table 39: South Asia Market Value (US$ Million) Forecast by Application, 2018 to 2033
Table 40: South Asia Market Value (US$ Million) Forecast by Vertical, 2018 to 2033
Table 41: East Asia Market Value (US$ Million) Forecast by Country, 2018 to 2033
Table 42: East Asia Market Value (US$ Million) Forecast by Component, 2018 to 2033
Table 43: East Asia Market Value (US$ Million) Forecast by Solution, 2018 to 2033
Table 44: East Asia Market Value (US$ Million) Forecast by Services , 2018 to 2033
Table 45: East Asia Market Value (US$ Million) Forecast by Organisation Size, 2018 to 2033
Table 46: East Asia Market Value (US$ Million) Forecast by Deployment Mode, 2018 to 2033
Table 47: East Asia Market Value (US$ Million) Forecast by Application, 2018 to 2033
Table 48: East Asia Market Value (US$ Million) Forecast by Vertical, 2018 to 2033
Table 49: Oceania Market Value (US$ Million) Forecast by Country, 2018 to 2033
Table 50: Oceania Market Value (US$ Million) Forecast by Component, 2018 to 2033
Table 51: Oceania Market Value (US$ Million) Forecast by Solution, 2018 to 2033
Table 52: Oceania Market Value (US$ Million) Forecast by Services , 2018 to 2033
Table 53: Oceania Market Value (US$ Million) Forecast by Organisation Size, 2018 to 2033
Table 54: Oceania Market Value (US$ Million) Forecast by Deployment Mode, 2018 to 2033
Table 55: Oceania Market Value (US$ Million) Forecast by Application, 2018 to 2033
Table 56: Oceania Market Value (US$ Million) Forecast by Vertical, 2018 to 2033
Table 57: MEA Market Value (US$ Million) Forecast by Country, 2018 to 2033
Table 58: MEA Market Value (US$ Million) Forecast by Component, 2018 to 2033
Table 59: MEA Market Value (US$ Million) Forecast by Solution, 2018 to 2033
Table 60: MEA Market Value (US$ Million) Forecast by Services , 2018 to 2033
Table 61: MEA Market Value (US$ Million) Forecast by Organisation Size, 2018 to 2033
Table 62: MEA Market Value (US$ Million) Forecast by Deployment Mode, 2018 to 2033
Table 63: MEA Market Value (US$ Million) Forecast by Application, 2018 to 2033
Table 64: MEA Market Value (US$ Million) Forecast by Vertical, 2018 to 2033
Figure 1: Global Market Value (US$ Million) by Component, 2023 to 2033
Figure 2: Global Market Value (US$ Million) by Solution, 2023 to 2033
Figure 3: Global Market Value (US$ Million) by Services , 2023 to 2033
Figure 4: Global Market Value (US$ Million) by Organisation Size, 2023 to 2033
Figure 5: Global Market Value (US$ Million) by Deployment Mode, 2023 to 2033
Figure 6: Global Market Value (US$ Million) by Application, 2023 to 2033
Figure 7: Global Market Value (US$ Million) by Vertical, 2023 to 2033
Figure 8: Global Market Value (US$ Million) by Region, 2023 to 2033
Figure 9: Global Market Value (US$ Million) Analysis by Region, 2018 to 2033
Figure 10: Global Market Value Share (%) and BPS Analysis by Region, 2023 to 2033
Figure 11: Global Market Y-o-Y Growth (%) Projections by Region, 2023 to 2033
Figure 12: Global Market Value (US$ Million) Analysis by Component, 2018 to 2033
Figure 13: Global Market Value Share (%) and BPS Analysis by Component, 2023 to 2033
Figure 14: Global Market Y-o-Y Growth (%) Projections by Component, 2023 to 2033
Figure 15: Global Market Value (US$ Million) Analysis by Solution, 2018 to 2033
Figure 16: Global Market Value Share (%) and BPS Analysis by Solution, 2023 to 2033
Figure 17: Global Market Y-o-Y Growth (%) Projections by Solution, 2023 to 2033
Figure 18: Global Market Value (US$ Million) Analysis by Services , 2018 to 2033
Figure 19: Global Market Value Share (%) and BPS Analysis by Services , 2023 to 2033
Figure 20: Global Market Y-o-Y Growth (%) Projections by Services , 2023 to 2033
Figure 21: Global Market Value (US$ Million) Analysis by Organisation Size, 2018 to 2033
Figure 22: Global Market Value Share (%) and BPS Analysis by Organisation Size, 2023 to 2033
Figure 23: Global Market Y-o-Y Growth (%) Projections by Organisation Size, 2023 to 2033
Figure 24: Global Market Value (US$ Million) Analysis by Deployment Mode, 2018 to 2033
Figure 25: Global Market Value Share (%) and BPS Analysis by Deployment Mode, 2023 to 2033
Figure 26: Global Market Y-o-Y Growth (%) Projections by Deployment Mode, 2023 to 2033
Figure 27: Global Market Value (US$ Million) Analysis by Application, 2018 to 2033
Figure 28: Global Market Value Share (%) and BPS Analysis by Application, 2023 to 2033
Figure 29: Global Market Y-o-Y Growth (%) Projections by Application, 2023 to 2033
Figure 30: Global Market Value (US$ Million) Analysis by Vertical, 2018 to 2033
Figure 31: Global Market Value Share (%) and BPS Analysis by Vertical, 2023 to 2033
Figure 32: Global Market Y-o-Y Growth (%) Projections by Vertical, 2023 to 2033
Figure 33: Global Market Attractiveness by Component, 2023 to 2033
Figure 34: Global Market Attractiveness by Solution, 2023 to 2033
Figure 35: Global Market Attractiveness by Services , 2023 to 2033
Figure 36: Global Market Attractiveness by Organisation Size, 2023 to 2033
Figure 37: Global Market Attractiveness by Deployment Mode, 2023 to 2033
Figure 38: Global Market Attractiveness by Application, 2023 to 2033
Figure 39: Global Market Attractiveness by Vertical, 2023 to 2033
Figure 40: Global Market Attractiveness by Region, 2023 to 2033
Figure 41: North America Market Value (US$ Million) by Component, 2023 to 2033
Figure 42: North America Market Value (US$ Million) by Solution, 2023 to 2033
Figure 43: North America Market Value (US$ Million) by Services , 2023 to 2033
Figure 44: North America Market Value (US$ Million) by Organisation Size, 2023 to 2033
Figure 45: North America Market Value (US$ Million) by Deployment Mode, 2023 to 2033
Figure 46: North America Market Value (US$ Million) by Application, 2023 to 2033
Figure 47: North America Market Value (US$ Million) by Vertical, 2023 to 2033
Figure 48: North America Market Value (US$ Million) by Country, 2023 to 2033
Figure 49: North America Market Value (US$ Million) Analysis by Country, 2018 to 2033
Figure 50: North America Market Value Share (%) and BPS Analysis by Country, 2023 to 2033
Figure 51: North America Market Y-o-Y Growth (%) Projections by Country, 2023 to 2033
Figure 52: North America Market Value (US$ Million) Analysis by Component, 2018 to 2033
Figure 53: North America Market Value Share (%) and BPS Analysis by Component, 2023 to 2033
Figure 54: North America Market Y-o-Y Growth (%) Projections by Component, 2023 to 2033
Figure 55: North America Market Value (US$ Million) Analysis by Solution, 2018 to 2033
Figure 56: North America Market Value Share (%) and BPS Analysis by Solution, 2023 to 2033
Figure 57: North America Market Y-o-Y Growth (%) Projections by Solution, 2023 to 2033
Figure 58: North America Market Value (US$ Million) Analysis by Services , 2018 to 2033
Figure 59: North America Market Value Share (%) and BPS Analysis by Services , 2023 to 2033
Figure 60: North America Market Y-o-Y Growth (%) Projections by Services , 2023 to 2033
Figure 61: North America Market Value (US$ Million) Analysis by Organisation Size, 2018 to 2033
Figure 62: North America Market Value Share (%) and BPS Analysis by Organisation Size, 2023 to 2033
Figure 63: North America Market Y-o-Y Growth (%) Projections by Organisation Size, 2023 to 2033
Figure 64: North America Market Value (US$ Million) Analysis by Deployment Mode, 2018 to 2033
Figure 65: North America Market Value Share (%) and BPS Analysis by Deployment Mode, 2023 to 2033
Figure 66: North America Market Y-o-Y Growth (%) Projections by Deployment Mode, 2023 to 2033
Figure 67: North America Market Value (US$ Million) Analysis by Application, 2018 to 2033
Figure 68: North America Market Value Share (%) and BPS Analysis by Application, 2023 to 2033
Figure 69: North America Market Y-o-Y Growth (%) Projections by Application, 2023 to 2033
Figure 70: North America Market Value (US$ Million) Analysis by Vertical, 2018 to 2033
Figure 71: North America Market Value Share (%) and BPS Analysis by Vertical, 2023 to 2033
Figure 72: North America Market Y-o-Y Growth (%) Projections by Vertical, 2023 to 2033
Figure 73: North America Market Attractiveness by Component, 2023 to 2033
Figure 74: North America Market Attractiveness by Solution, 2023 to 2033
Figure 75: North America Market Attractiveness by Services , 2023 to 2033
Figure 76: North America Market Attractiveness by Organisation Size, 2023 to 2033
Figure 77: North America Market Attractiveness by Deployment Mode, 2023 to 2033
Figure 78: North America Market Attractiveness by Application, 2023 to 2033
Figure 79: North America Market Attractiveness by Vertical, 2023 to 2033
Figure 80: North America Market Attractiveness by Country, 2023 to 2033
Figure 81: Latin America Market Value (US$ Million) by Component, 2023 to 2033
Figure 82: Latin America Market Value (US$ Million) by Solution, 2023 to 2033
Figure 83: Latin America Market Value (US$ Million) by Services , 2023 to 2033
Figure 84: Latin America Market Value (US$ Million) by Organisation Size, 2023 to 2033
Figure 85: Latin America Market Value (US$ Million) by Deployment Mode, 2023 to 2033
Figure 86: Latin America Market Value (US$ Million) by Application, 2023 to 2033
Figure 87: Latin America Market Value (US$ Million) by Vertical, 2023 to 2033
Figure 88: Latin America Market Value (US$ Million) by Country, 2023 to 2033
Figure 89: Latin America Market Value (US$ Million) Analysis by Country, 2018 to 2033
Figure 90: Latin America Market Value Share (%) and BPS Analysis by Country, 2023 to 2033
Figure 91: Latin America Market Y-o-Y Growth (%) Projections by Country, 2023 to 2033
Figure 92: Latin America Market Value (US$ Million) Analysis by Component, 2018 to 2033
Figure 93: Latin America Market Value Share (%) and BPS Analysis by Component, 2023 to 2033
Figure 94: Latin America Market Y-o-Y Growth (%) Projections by Component, 2023 to 2033
Figure 95: Latin America Market Value (US$ Million) Analysis by Solution, 2018 to 2033
Figure 96: Latin America Market Value Share (%) and BPS Analysis by Solution, 2023 to 2033
Figure 97: Latin America Market Y-o-Y Growth (%) Projections by Solution, 2023 to 2033
Figure 98: Latin America Market Value (US$ Million) Analysis by Services , 2018 to 2033
Figure 99: Latin America Market Value Share (%) and BPS Analysis by Services , 2023 to 2033
Figure 100: Latin America Market Y-o-Y Growth (%) Projections by Services , 2023 to 2033
Figure 101: Latin America Market Value (US$ Million) Analysis by Organisation Size, 2018 to 2033
Figure 102: Latin America Market Value Share (%) and BPS Analysis by Organisation Size, 2023 to 2033
Figure 103: Latin America Market Y-o-Y Growth (%) Projections by Organisation Size, 2023 to 2033
Figure 104: Latin America Market Value (US$ Million) Analysis by Deployment Mode, 2018 to 2033
Figure 105: Latin America Market Value Share (%) and BPS Analysis by Deployment Mode, 2023 to 2033
Figure 106: Latin America Market Y-o-Y Growth (%) Projections by Deployment Mode, 2023 to 2033
Figure 107: Latin America Market Value (US$ Million) Analysis by Application, 2018 to 2033
Figure 108: Latin America Market Value Share (%) and BPS Analysis by Application, 2023 to 2033
Figure 109: Latin America Market Y-o-Y Growth (%) Projections by Application, 2023 to 2033
Figure 110: Latin America Market Value (US$ Million) Analysis by Vertical, 2018 to 2033
Figure 111: Latin America Market Value Share (%) and BPS Analysis by Vertical, 2023 to 2033
Figure 112: Latin America Market Y-o-Y Growth (%) Projections by Vertical, 2023 to 2033
Figure 113: Latin America Market Attractiveness by Component, 2023 to 2033
Figure 114: Latin America Market Attractiveness by Solution, 2023 to 2033
Figure 115: Latin America Market Attractiveness by Services , 2023 to 2033
Figure 116: Latin America Market Attractiveness by Organisation Size, 2023 to 2033
Figure 117: Latin America Market Attractiveness by Deployment Mode, 2023 to 2033
Figure 118: Latin America Market Attractiveness by Application, 2023 to 2033
Figure 119: Latin America Market Attractiveness by Vertical, 2023 to 2033
Figure 120: Latin America Market Attractiveness by Country, 2023 to 2033
Figure 121: Europe Market Value (US$ Million) by Component, 2023 to 2033
Figure 122: Europe Market Value (US$ Million) by Solution, 2023 to 2033
Figure 123: Europe Market Value (US$ Million) by Services , 2023 to 2033
Figure 124: Europe Market Value (US$ Million) by Organisation Size, 2023 to 2033
Figure 125: Europe Market Value (US$ Million) by Deployment Mode, 2023 to 2033
Figure 126: Europe Market Value (US$ Million) by Application, 2023 to 2033
Figure 127: Europe Market Value (US$ Million) by Vertical, 2023 to 2033
Figure 128: Europe Market Value (US$ Million) by Country, 2023 to 2033
Figure 129: Europe Market Value (US$ Million) Analysis by Country, 2018 to 2033
Figure 130: Europe Market Value Share (%) and BPS Analysis by Country, 2023 to 2033
Figure 131: Europe Market Y-o-Y Growth (%) Projections by Country, 2023 to 2033
Figure 132: Europe Market Value (US$ Million) Analysis by Component, 2018 to 2033
Figure 133: Europe Market Value Share (%) and BPS Analysis by Component, 2023 to 2033
Figure 134: Europe Market Y-o-Y Growth (%) Projections by Component, 2023 to 2033
Figure 135: Europe Market Value (US$ Million) Analysis by Solution, 2018 to 2033
Figure 136: Europe Market Value Share (%) and BPS Analysis by Solution, 2023 to 2033
Figure 137: Europe Market Y-o-Y Growth (%) Projections by Solution, 2023 to 2033
Figure 138: Europe Market Value (US$ Million) Analysis by Services , 2018 to 2033
Figure 139: Europe Market Value Share (%) and BPS Analysis by Services , 2023 to 2033
Figure 140: Europe Market Y-o-Y Growth (%) Projections by Services , 2023 to 2033
Figure 141: Europe Market Value (US$ Million) Analysis by Organisation Size, 2018 to 2033
Figure 142: Europe Market Value Share (%) and BPS Analysis by Organisation Size, 2023 to 2033
Figure 143: Europe Market Y-o-Y Growth (%) Projections by Organisation Size, 2023 to 2033
Figure 144: Europe Market Value (US$ Million) Analysis by Deployment Mode, 2018 to 2033
Figure 145: Europe Market Value Share (%) and BPS Analysis by Deployment Mode, 2023 to 2033
Figure 146: Europe Market Y-o-Y Growth (%) Projections by Deployment Mode, 2023 to 2033
Figure 147: Europe Market Value (US$ Million) Analysis by Application, 2018 to 2033
Figure 148: Europe Market Value Share (%) and BPS Analysis by Application, 2023 to 2033
Figure 149: Europe Market Y-o-Y Growth (%) Projections by Application, 2023 to 2033
Figure 150: Europe Market Value (US$ Million) Analysis by Vertical, 2018 to 2033
Figure 151: Europe Market Value Share (%) and BPS Analysis by Vertical, 2023 to 2033
Figure 152: Europe Market Y-o-Y Growth (%) Projections by Vertical, 2023 to 2033
Figure 153: Europe Market Attractiveness by Component, 2023 to 2033
Figure 154: Europe Market Attractiveness by Solution, 2023 to 2033
Figure 155: Europe Market Attractiveness by Services , 2023 to 2033
Figure 156: Europe Market Attractiveness by Organisation Size, 2023 to 2033
Figure 157: Europe Market Attractiveness by Deployment Mode, 2023 to 2033
Figure 158: Europe Market Attractiveness by Application, 2023 to 2033
Figure 159: Europe Market Attractiveness by Vertical, 2023 to 2033
Figure 160: Europe Market Attractiveness by Country, 2023 to 2033
Figure 161: South Asia Market Value (US$ Million) by Component, 2023 to 2033
Figure 162: South Asia Market Value (US$ Million) by Solution, 2023 to 2033
Figure 163: South Asia Market Value (US$ Million) by Services , 2023 to 2033
Figure 164: South Asia Market Value (US$ Million) by Organisation Size, 2023 to 2033
Figure 165: South Asia Market Value (US$ Million) by Deployment Mode, 2023 to 2033
Figure 166: South Asia Market Value (US$ Million) by Application, 2023 to 2033
Figure 167: South Asia Market Value (US$ Million) by Vertical, 2023 to 2033
Figure 168: South Asia Market Value (US$ Million) by Country, 2023 to 2033
Figure 169: South Asia Market Value (US$ Million) Analysis by Country, 2018 to 2033
Figure 170: South Asia Market Value Share (%) and BPS Analysis by Country, 2023 to 2033
Figure 171: South Asia Market Y-o-Y Growth (%) Projections by Country, 2023 to 2033
Figure 172: South Asia Market Value (US$ Million) Analysis by Component, 2018 to 2033
Figure 173: South Asia Market Value Share (%) and BPS Analysis by Component, 2023 to 2033
Figure 174: South Asia Market Y-o-Y Growth (%) Projections by Component, 2023 to 2033
Figure 175: South Asia Market Value (US$ Million) Analysis by Solution, 2018 to 2033
Figure 176: South Asia Market Value Share (%) and BPS Analysis by Solution, 2023 to 2033
Figure 177: South Asia Market Y-o-Y Growth (%) Projections by Solution, 2023 to 2033
Figure 178: South Asia Market Value (US$ Million) Analysis by Services , 2018 to 2033
Figure 179: South Asia Market Value Share (%) and BPS Analysis by Services , 2023 to 2033
Figure 180: South Asia Market Y-o-Y Growth (%) Projections by Services , 2023 to 2033
Figure 181: South Asia Market Value (US$ Million) Analysis by Organisation Size, 2018 to 2033
Figure 182: South Asia Market Value Share (%) and BPS Analysis by Organisation Size, 2023 to 2033
Figure 183: South Asia Market Y-o-Y Growth (%) Projections by Organisation Size, 2023 to 2033
Figure 184: South Asia Market Value (US$ Million) Analysis by Deployment Mode, 2018 to 2033
Figure 185: South Asia Market Value Share (%) and BPS Analysis by Deployment Mode, 2023 to 2033
Figure 186: South Asia Market Y-o-Y Growth (%) Projections by Deployment Mode, 2023 to 2033
Figure 187: South Asia Market Value (US$ Million) Analysis by Application, 2018 to 2033
Figure 188: South Asia Market Value Share (%) and BPS Analysis by Application, 2023 to 2033
Figure 189: South Asia Market Y-o-Y Growth (%) Projections by Application, 2023 to 2033
Figure 190: South Asia Market Value (US$ Million) Analysis by Vertical, 2018 to 2033
Figure 191: South Asia Market Value Share (%) and BPS Analysis by Vertical, 2023 to 2033
Figure 192: South Asia Market Y-o-Y Growth (%) Projections by Vertical, 2023 to 2033
Figure 193: South Asia Market Attractiveness by Component, 2023 to 2033
Figure 194: South Asia Market Attractiveness by Solution, 2023 to 2033
Figure 195: South Asia Market Attractiveness by Services , 2023 to 2033
Figure 196: South Asia Market Attractiveness by Organisation Size, 2023 to 2033
Figure 197: South Asia Market Attractiveness by Deployment Mode, 2023 to 2033
Figure 198: South Asia Market Attractiveness by Application, 2023 to 2033
Figure 199: South Asia Market Attractiveness by Vertical, 2023 to 2033
Figure 200: South Asia Market Attractiveness by Country, 2023 to 2033
Figure 201: East Asia Market Value (US$ Million) by Component, 2023 to 2033
Figure 202: East Asia Market Value (US$ Million) by Solution, 2023 to 2033
Figure 203: East Asia Market Value (US$ Million) by Services , 2023 to 2033
Figure 204: East Asia Market Value (US$ Million) by Organisation Size, 2023 to 2033
Figure 205: East Asia Market Value (US$ Million) by Deployment Mode, 2023 to 2033
Figure 206: East Asia Market Value (US$ Million) by Application, 2023 to 2033
Figure 207: East Asia Market Value (US$ Million) by Vertical, 2023 to 2033
Figure 208: East Asia Market Value (US$ Million) by Country, 2023 to 2033
Figure 209: East Asia Market Value (US$ Million) Analysis by Country, 2018 to 2033
Figure 210: East Asia Market Value Share (%) and BPS Analysis by Country, 2023 to 2033
Figure 211: East Asia Market Y-o-Y Growth (%) Projections by Country, 2023 to 2033
Figure 212: East Asia Market Value (US$ Million) Analysis by Component, 2018 to 2033
Figure 213: East Asia Market Value Share (%) and BPS Analysis by Component, 2023 to 2033
Figure 214: East Asia Market Y-o-Y Growth (%) Projections by Component, 2023 to 2033
Figure 215: East Asia Market Value (US$ Million) Analysis by Solution, 2018 to 2033
Figure 216: East Asia Market Value Share (%) and BPS Analysis by Solution, 2023 to 2033
Figure 217: East Asia Market Y-o-Y Growth (%) Projections by Solution, 2023 to 2033
Figure 218: East Asia Market Value (US$ Million) Analysis by Services , 2018 to 2033
Figure 219: East Asia Market Value Share (%) and BPS Analysis by Services , 2023 to 2033
Figure 220: East Asia Market Y-o-Y Growth (%) Projections by Services , 2023 to 2033
Figure 221: East Asia Market Value (US$ Million) Analysis by Organisation Size, 2018 to 2033
Figure 222: East Asia Market Value Share (%) and BPS Analysis by Organisation Size, 2023 to 2033
Figure 223: East Asia Market Y-o-Y Growth (%) Projections by Organisation Size, 2023 to 2033
Figure 224: East Asia Market Value (US$ Million) Analysis by Deployment Mode, 2018 to 2033
Figure 225: East Asia Market Value Share (%) and BPS Analysis by Deployment Mode, 2023 to 2033
Figure 226: East Asia Market Y-o-Y Growth (%) Projections by Deployment Mode, 2023 to 2033
Figure 227: East Asia Market Value (US$ Million) Analysis by Application, 2018 to 2033
Figure 228: East Asia Market Value Share (%) and BPS Analysis by Application, 2023 to 2033
Figure 229: East Asia Market Y-o-Y Growth (%) Projections by Application, 2023 to 2033
Figure 230: East Asia Market Value (US$ Million) Analysis by Vertical, 2018 to 2033
Figure 231: East Asia Market Value Share (%) and BPS Analysis by Vertical, 2023 to 2033
Figure 232: East Asia Market Y-o-Y Growth (%) Projections by Vertical, 2023 to 2033
Figure 233: East Asia Market Attractiveness by Component, 2023 to 2033
Figure 234: East Asia Market Attractiveness by Solution, 2023 to 2033
Figure 235: East Asia Market Attractiveness by Services , 2023 to 2033
Figure 236: East Asia Market Attractiveness by Organisation Size, 2023 to 2033
Figure 237: East Asia Market Attractiveness by Deployment Mode, 2023 to 2033
Figure 238: East Asia Market Attractiveness by Application, 2023 to 2033
Figure 239: East Asia Market Attractiveness by Vertical, 2023 to 2033
Figure 240: East Asia Market Attractiveness by Country, 2023 to 2033
Figure 241: Oceania Market Value (US$ Million) by Component, 2023 to 2033
Figure 242: Oceania Market Value (US$ Million) by Solution, 2023 to 2033
Figure 243: Oceania Market Value (US$ Million) by Services , 2023 to 2033
Figure 244: Oceania Market Value (US$ Million) by Organisation Size, 2023 to 2033
Figure 245: Oceania Market Value (US$ Million) by Deployment Mode, 2023 to 2033
Figure 246: Oceania Market Value (US$ Million) by Application, 2023 to 2033
Figure 247: Oceania Market Value (US$ Million) by Vertical, 2023 to 2033
Figure 248: Oceania Market Value (US$ Million) by Country, 2023 to 2033
Figure 249: Oceania Market Value (US$ Million) Analysis by Country, 2018 to 2033
Figure 250: Oceania Market Value Share (%) and BPS Analysis by Country, 2023 to 2033
Figure 251: Oceania Market Y-o-Y Growth (%) Projections by Country, 2023 to 2033
Figure 252: Oceania Market Value (US$ Million) Analysis by Component, 2018 to 2033
Figure 253: Oceania Market Value Share (%) and BPS Analysis by Component, 2023 to 2033
Figure 254: Oceania Market Y-o-Y Growth (%) Projections by Component, 2023 to 2033
Figure 255: Oceania Market Value (US$ Million) Analysis by Solution, 2018 to 2033
Figure 256: Oceania Market Value Share (%) and BPS Analysis by Solution, 2023 to 2033
Figure 257: Oceania Market Y-o-Y Growth (%) Projections by Solution, 2023 to 2033
Figure 258: Oceania Market Value (US$ Million) Analysis by Services , 2018 to 2033
Figure 259: Oceania Market Value Share (%) and BPS Analysis by Services , 2023 to 2033
Figure 260: Oceania Market Y-o-Y Growth (%) Projections by Services , 2023 to 2033
Figure 261: Oceania Market Value (US$ Million) Analysis by Organisation Size, 2018 to 2033
Figure 262: Oceania Market Value Share (%) and BPS Analysis by Organisation Size, 2023 to 2033
Figure 263: Oceania Market Y-o-Y Growth (%) Projections by Organisation Size, 2023 to 2033
Figure 264: Oceania Market Value (US$ Million) Analysis by Deployment Mode, 2018 to 2033
Figure 265: Oceania Market Value Share (%) and BPS Analysis by Deployment Mode, 2023 to 2033
Figure 266: Oceania Market Y-o-Y Growth (%) Projections by Deployment Mode, 2023 to 2033
Figure 267: Oceania Market Value (US$ Million) Analysis by Application, 2018 to 2033
Figure 268: Oceania Market Value Share (%) and BPS Analysis by Application, 2023 to 2033
Figure 269: Oceania Market Y-o-Y Growth (%) Projections by Application, 2023 to 2033
Figure 270: Oceania Market Value (US$ Million) Analysis by Vertical, 2018 to 2033
Figure 271: Oceania Market Value Share (%) and BPS Analysis by Vertical, 2023 to 2033
Figure 272: Oceania Market Y-o-Y Growth (%) Projections by Vertical, 2023 to 2033
Figure 273: Oceania Market Attractiveness by Component, 2023 to 2033
Figure 274: Oceania Market Attractiveness by Solution, 2023 to 2033
Figure 275: Oceania Market Attractiveness by Services , 2023 to 2033
Figure 276: Oceania Market Attractiveness by Organisation Size, 2023 to 2033
Figure 277: Oceania Market Attractiveness by Deployment Mode, 2023 to 2033
Figure 278: Oceania Market Attractiveness by Application, 2023 to 2033
Figure 279: Oceania Market Attractiveness by Vertical, 2023 to 2033
Figure 280: Oceania Market Attractiveness by Country, 2023 to 2033
Figure 281: MEA Market Value (US$ Million) by Component, 2023 to 2033
Figure 282: MEA Market Value (US$ Million) by Solution, 2023 to 2033
Figure 283: MEA Market Value (US$ Million) by Services , 2023 to 2033
Figure 284: MEA Market Value (US$ Million) by Organisation Size, 2023 to 2033
Figure 285: MEA Market Value (US$ Million) by Deployment Mode, 2023 to 2033
Figure 286: MEA Market Value (US$ Million) by Application, 2023 to 2033
Figure 287: MEA Market Value (US$ Million) by Vertical, 2023 to 2033
Figure 288: MEA Market Value (US$ Million) by Country, 2023 to 2033
Figure 289: MEA Market Value (US$ Million) Analysis by Country, 2018 to 2033
Figure 290: MEA Market Value Share (%) and BPS Analysis by Country, 2023 to 2033
Figure 291: MEA Market Y-o-Y Growth (%) Projections by Country, 2023 to 2033
Figure 292: MEA Market Value (US$ Million) Analysis by Component, 2018 to 2033
Figure 293: MEA Market Value Share (%) and BPS Analysis by Component, 2023 to 2033
Figure 294: MEA Market Y-o-Y Growth (%) Projections by Component, 2023 to 2033
Figure 295: MEA Market Value (US$ Million) Analysis by Solution, 2018 to 2033
Figure 296: MEA Market Value Share (%) and BPS Analysis by Solution, 2023 to 2033
Figure 297: MEA Market Y-o-Y Growth (%) Projections by Solution, 2023 to 2033
Figure 298: MEA Market Value (US$ Million) Analysis by Services , 2018 to 2033
Figure 299: MEA Market Value Share (%) and BPS Analysis by Services , 2023 to 2033
Figure 300: MEA Market Y-o-Y Growth (%) Projections by Services , 2023 to 2033
Figure 301: MEA Market Value (US$ Million) Analysis by Organisation Size, 2018 to 2033
Figure 302: MEA Market Value Share (%) and BPS Analysis by Organisation Size, 2023 to 2033
Figure 303: MEA Market Y-o-Y Growth (%) Projections by Organisation Size, 2023 to 2033
Figure 304: MEA Market Value (US$ Million) Analysis by Deployment Mode, 2018 to 2033
Figure 305: MEA Market Value Share (%) and BPS Analysis by Deployment Mode, 2023 to 2033
Figure 306: MEA Market Y-o-Y Growth (%) Projections by Deployment Mode, 2023 to 2033
Figure 307: MEA Market Value (US$ Million) Analysis by Application, 2018 to 2033
Figure 308: MEA Market Value Share (%) and BPS Analysis by Application, 2023 to 2033
Figure 309: MEA Market Y-o-Y Growth (%) Projections by Application, 2023 to 2033
Figure 310: MEA Market Value (US$ Million) Analysis by Vertical, 2018 to 2033
Figure 311: MEA Market Value Share (%) and BPS Analysis by Vertical, 2023 to 2033
Figure 312: MEA Market Y-o-Y Growth (%) Projections by Vertical, 2023 to 2033
Figure 313: MEA Market Attractiveness by Component, 2023 to 2033
Figure 314: MEA Market Attractiveness by Solution, 2023 to 2033
Figure 315: MEA Market Attractiveness by Services , 2023 to 2033
Figure 316: MEA Market Attractiveness by Organisation Size, 2023 to 2033
Figure 317: MEA Market Attractiveness by Deployment Mode, 2023 to 2033
Figure 318: MEA Market Attractiveness by Application, 2023 to 2033
Figure 319: MEA Market Attractiveness by Vertical, 2023 to 2033
Figure 320: MEA Market Attractiveness by Country, 2023 to 2033
The United States, Germany, and China dominate the global IoT manufacturing market.
The market is forecast to register a CAGR of 14.2% through 2033.
During 2018 to 2022, the market grew at a CAGR of 10.5%.
The increasing adoption of Industry 4.0 is disrupting the current market trends.
The global market size to reach USD 948.6 billion by 2033.
Explore Digital Transformation Insights
Thank you!
You will receive an email from our Business Development Manager. Please be sure to check your SPAM/JUNK folder too.