IoT Chip Market Outlook (2023 to 2033)

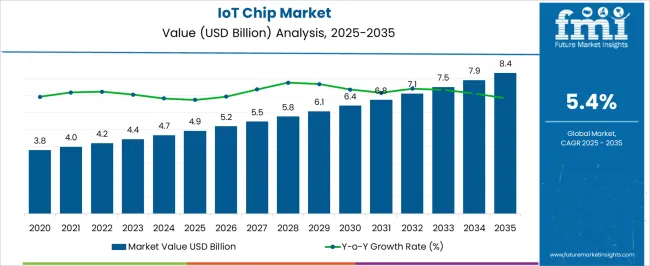
The global IoT chip market is poised to surpass US$ 4.4 billion by 2023, surging at a remarkable CAGR of 5.7% through 2033 to reach US$ 7.69 billion.

The rise in internet connection in technologically advanced nations, as well as the emergence of low-cost smart wireless sensor networks, are projected to facilitate the growth of the IoT chip industry significantly.

The implementation of IPv6, which gives additional IP address space, and technologies such as AI boosting IoT adoption are likely to drive the market for IoT chips even further.

Attributes Details
IoT Chip Market CAGR (2023 to 2033) 5.7%
IoT Chip Market Size (2023) US$ 4.4 billion
IoT Chip Market Size (2033) US$ 7.69 billion

The IoT chip market has witnessed significant growth, fueled by the proliferation of IoT devices and advancements in connectivity technologies.

Rising demand for edge computing and increased focus on data security further contribute to the market size expansion.

Don't pay for what you don't need

Customize your report by selecting specific countries or regions and save 30%!

What are the Trends in the IoT Chip Market?

  • Rising digitalization is driving the growth of the IoT chip market.
  • The increasing need for automated operations in various sectors is fueling the demand for IoT chips.
  • The growth of the vehicle industry has led to a significant increase in the usage of IoT technologies, contributing to the expansion of the market.
  • Cross-domain partnerships and government financing for technology are additional factors supporting market growth.
  • The rising population, accompanied by increased internet usage, particularly in developing nations, indirectly contributes to the expansion of market size.
  • Rapid advancements in wireless connectivity technologies, such as 5G and LPWAN, are driving the adoption of IoT chips and fueling the market growth.
  • The increasing deployment of smart cities and smart infrastructure projects globally is creating a significant demand for IoT chips to enable connectivity and intelligent monitoring.
  • The emergence of edge computing and the need for real-time data processing at the edge of the network are boosting the demand for IoT chips with enhanced processing capabilities.
  • The growing awareness and implementation of energy-efficient solutions in industries like energy management and smart grid systems are contributing to the growth of the market.
  • Technological advancements in IoT chip designs, including miniaturization, improved power efficiency, and integration of AI capabilities, are expanding the range of applications and driving market growth.

What Restraints the IoT Chip Market?

  • Security concerns and vulnerabilities associated with IoT devices pose a significant restraint to the IoT chip industry’s growth.
  • The complexity and interoperability challenges in integrating diverse IoT devices and platforms hinder seamless adoption and limit market expansion.
  • High implementation costs, particularly for small and medium-sized enterprises, can act as a barrier to entry and dwindle the market expansion.
  • Privacy issues and regulations surrounding data collection, storage, and usage present challenges to IoT chip manufacturers and limit market potential.
  • Limited standardization and a fragmented ecosystem can impede interoperability and hinder the widespread adoption of IoT chips.
  • Concerns about the sustainability and environmental impact of IoT devices, including electronic waste generation, can affect market growth.
  • Lack of awareness and technical skills among end-users, particularly in developing regions, may limit the market's reach and adoption of IoT chips.
Sudip Saha
Sudip Saha

Principal Consultant

Talk to Analyst

Find your sweet spots for generating winning opportunities in this market.

Country-wise Insights

Which Region Offers High Growth Opportunities in the Coming Years?

Due to the existence of well-established economies in this region, the North American region was predicted to hold the dominant share of 32.5% in 2022 in the global market. This allows them to invest much in research and development.

The growing acceptance of various smart connected devices and rapid digitalization throughout the IoT industry's verticals, and advancements in technological sectors have boosted the IoT industry's growing demand in the North American region.

As per FMI, the market for IoT chips in the United States garnered a 20.3% value share in 2022 on a global level, driven by the widespread adoption of IoT devices across various industries.

The country is home to several prominent players in the semiconductor industry, which fuels technological advancements and innovation in IoT chip design and manufacturing. The United States of America's strong focus on research and development further propels the growth of the IoT chip market.
What is the Growth Outlook for Europe IoT Chip Industry?

European countries have been actively promoting IoT adoption through supportive policies and initiatives. Government investments in research and development, along with funding programs and collaborations with industry stakeholders, are fostering the growth of the IoT chip industry in Europe.

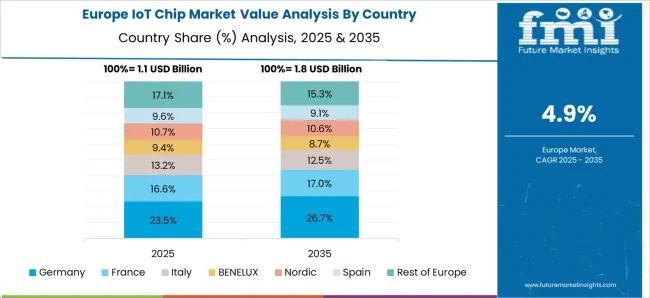
Following the FMI study, the market for IoT chips in Europe was projected to amass a revenue of 23.4% in 2022.

The United Kingdom is likely to secure the prominent CAGR of 5.9% from 2023 to 2033 owing to the rapid developments of IOTs in this country, auguring well for the European regions, and is expected to witness significant growth.

The region's growing population, rising research and development investments, and international and domestic IT businesses increased focus on the growth of big data analytics and cloud-based services may boost the market's growth.

Countries Value CAGR (2023 to 2033)
United Kingdom 5.9%
China 6.2%
India 6.5%

Category-wise Insights

Which is the Leading Segment in the IoT Chip Industry by Hardware?

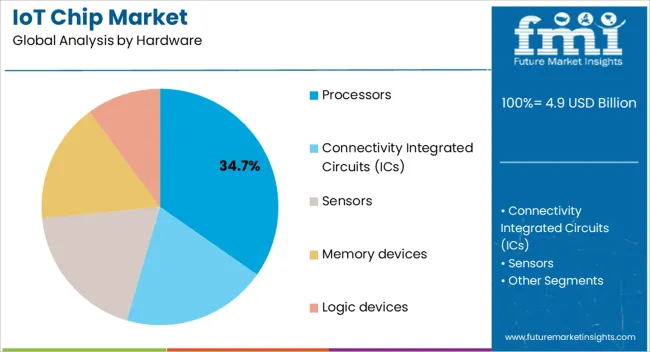
Sensors are the leading segment in the market by hardware due to their crucial role in data collection and sensing capabilities. They enable the IoT ecosystem to gather real-time information from the physical world, making them integral to various IoT applications.

The versatility of sensors is another key factor driving their prominence in the IoT chip industry. They find applications across diverse industries and use cases, contributing to the sub-segments' value share of 39.2% in 2022.

In healthcare, sensors are used for remote patient monitoring, wearable devices, and health tracking. In manufacturing, sensors enable predictive maintenance, quality control, and process optimization.

The wide-ranging applications of sensors make them indispensable components in the IoT ecosystem, leading to their status as the leading segment in the market of IoT chips by hardware.

What is the Primary Segment Driving the IoT Chip Market in Terms of End-use Applications?

The manufacturing industry extensively utilizes IoT technologies to enable automation and optimize operational processes. IoT chips play a vital role in connecting and controlling various devices and machines in manufacturing environments.

IoT chips facilitate the integration and connectivity of devices along the supply chain, enabling better visibility, tracking, and management of inventory, logistics, and distribution processes. This connectivity helps manufacturers streamline operations, improve inventory management, reduce delays, and enhance overall supply chain efficiency.

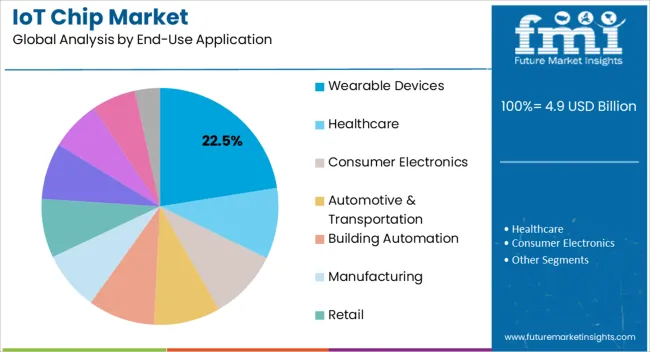
Owing to the above-mentioned factors, manufacturing was predicted to capture a value share of 14.8% in 2022 on a global level.

Get the data you need at a Fraction of the cost

Personalize your report by choosing insights you need
and save 40%!

How does Competition Influences the Market for IoT Chip?

Numerous companies, ranging from established semiconductor giants to specialized IoT chip manufacturers, compete to gain market share and establish their presence in this rapidly evolving industry.

The market is characterized by continuous advancements in technology, increasing demand for diverse IoT applications, and evolving customer requirements. These factors drive intense competition as companies strive to develop cutting-edge IoT chip solutions that offer improved performance, power efficiency, connectivity, and security features.

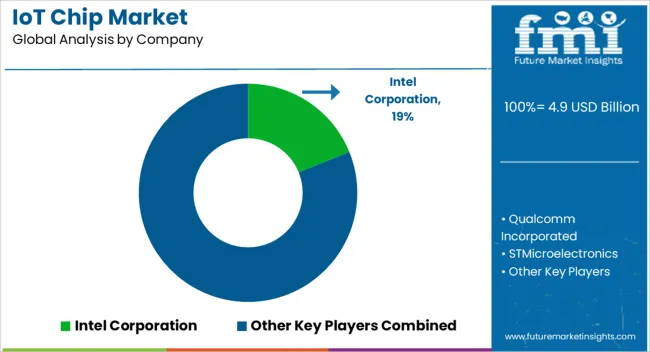
The global market was led by Intel Corporation. The corporation is perfectly positioned to power the cloud as well as various smart and connected computing devices. Intel provides computing, networking, and communication platforms to a diverse range of clients, including OEMs, ODMs, cloud and communication service providers, and makers of industrial, communications, and automotive equipment.

Client Computing Group (CCG), Data Center Group (DCG), Non-volatile Memory Solutions Group (NVMS), Internet of Things Group (IoTG), Programmable Solutions, and others are the company's six operational segments.

The IoTG business sector creates high-performance computing (HPC) solutions for certain verticals and embedded markets. It focuses on industries such as retail, manufacturing, and smart cities/infrastructure.

Recent Developments:

  • Marvell Technology Group released the third-generation ARM server processor ThunderX3 with 96 cores and 384 threads in March 2020. The ThunderX series is one of the company's server CPU offerings, and the first generation ThunderX2 was the first ARM server silicon that was declared feasible and competitive versus Intel and AMD products.
  • The microchip extended its silicon carbide (SiC) family of power electronics in March 2020 to enable system-level gains in efficiency, compactness, and reliability. The commercially certified Schottky Barrier Diode (SBD)-based power modules in 700, 1200, and 1700 V variations are part of Microchip's SiC series. The new power module family comprises topologies such as Dual Diode, Full Bridge, Phase Leg, Dual Common Cathode, and 3-Phase Bridge, as well as multiple current and packaging choices.
  • Impinj Inc. announced the release of three new RAIN RFID reader chips in June 2021, allowing IoT device manufacturers to fulfill the increased need for item connection in retail, supply chain, and logistics applications consumer electronics, among other areas.
  • Nordic Semiconductor announced the release of a power management integrated circuit (IC) in May 2021. (PMIC). In a 2.075 x 2.075mm wafer-level chip scale package, the nPM1100 features a USB-compatible input regulator with overvoltage protection, a 400mA battery charger, and a 150mA DC/DC step-down voltage regulator.
  • Qualcomm released seven new chipsets for IoT applications across many sectors in June 2021. IoT chips have activities-supporting characteristics such as integrated connection (IC), sensor fusion, personal identity and detection, object detection, edge detection, activity analysis, and personalization. IoT chips are intended to aid with warehouse management.
  • July 2021 - Intel released Intel Xeon W-3300 processors to its system integrator partners. In a single-socket system, Intel Xeon W-3300 processors deliver unrivaled performance, increased platform capabilities, and enterprise-grade security and dependability.

Key Players

  • Intel Corporation
  • Texas Instruments Incorporated
  • Qualcomm Incorporated
  • NXP Semiconductors N.V.
  • Marvell Technology Group Ltd.

Key Segments

By Hardware:

  • Processors
  • Connectivity Integrated Circuits (ICs)
  • Sensors
  • Memory devices
  • Logic devices

By Power Consumption:

  • Less than 1 W
  • 1-3 W
  • 3-5 W
  • 5-10 W
  • More than 10 W

By End-use Application:

  • Wearable Devices
  • Healthcare
  • Consumer Electronics
  • Automotive & Transportation
  • Building Automation
  • Manufacturing
  • Retail
  • BFSI
  • Oil & Gas
  • Agriculture
  • Aerospace & Defense

Key Region:

  • North America
  • Latin America
  • Asia Pacific
  • Europe
  • The Middle East and Africa

Frequently Asked Questions

How the IoT Chip Industry May Expand in 2023?

The worldwide IoT Chip industry to reach US$ 4.4 billion in 2023.

Who are the Key Players in the IoT Chip Market?

Intel Corporation, Texas Instruments Incorporated, and Qualcomm Incorporated are the leading market players.

What is the Anticipated Value of the Market by the end of 2033?

The worldwide-IoT Chip industry is likely to reach US$ 7.69 billion by 2033.

What Factors are Driving the Sales of the IoT Chip Market?

Rise of affordable intelligent wireless sensor networks will drive industry sales.

Which is the Key Segment by End-use Applications in the Industry?

The manufacturing segment is expected to remain preferred through 2033.

Table of Content
1. Executive Summary
    1.1. Global Market Outlook
    1.2. Demand-side Trends
    1.3. Supply-side Trends
    1.4. Technology Roadmap Analysis
    1.5. Analysis and Recommendations
2. Market Overview
    2.1. Market Coverage / Taxonomy
    2.2. Market Definition / Scope / Limitations
3. Market Background
    3.1. Market Dynamics
        3.1.1. Drivers
        3.1.2. Restraints
        3.1.3. Opportunity
        3.1.4. Trends
    3.2. Scenario Forecast
        3.2.1. Demand in Optimistic Scenario
        3.2.2. Demand in Likely Scenario
        3.2.3. Demand in Conservative Scenario
    3.3. Opportunity Map Analysis
    3.4. Product Life Cycle Analysis
    3.5. Supply Chain Analysis
        3.5.1. Supply Side Participants and their Roles
            3.5.1.1. Producers
            3.5.1.2. Mid-Level Participants (Traders/ Agents/ Brokers)
            3.5.1.3. Wholesalers and Distributors
        3.5.2. Value Added and Value Created at Node in the Supply Chain
        3.5.3. List of Raw Material Suppliers
        3.5.4. List of Existing and Potential Buyer’s
    3.6. Investment Feasibility Matrix
    3.7. Value Chain Analysis
        3.7.1. Profit Margin Analysis
        3.7.2. Wholesalers and Distributors
        3.7.3. Retailers
    3.8. PESTLE and Porter’s Analysis
    3.9. Regulatory Landscape
        3.9.1. By Key Regions
        3.9.2. By Key Countries
    3.10. Regional Parent Market Outlook
    3.11. Production and Consumption Statistics
    3.12. Import and Export Statistics
4. Global Market Analysis 2018 to 2022 and Forecast, 2023 to 2033
    4.1. Historical Market Size Value (US$ Million) & Volume (Units) Analysis, 2018 to 2022
    4.2. Current and Future Market Size Value (US$ Million) & Volume (Units) Projections, 2023 to 2033
        4.2.1. Y-o-Y Growth Trend Analysis
        4.2.2. Absolute $ Opportunity Analysis
5. Global Market Analysis 2018 to 2022 and Forecast 2023 to 2033, By Hardware
    5.1. Introduction / Key Findings
    5.2. Historical Market Size Value (US$ Million) & Volume (Units) Analysis By Hardware, 2018 to 2022
    5.3. Current and Future Market Size Value (US$ Million) & Volume (Units) Analysis and Forecast By Hardware, 2023 to 2033
        5.3.1. Processors
        5.3.2. Connectivity Integrated Circuits (ICs)
        5.3.3. Sensors
        5.3.4. Memory devices
        5.3.5. Logic devices
    5.4. Y-o-Y Growth Trend Analysis By Hardware, 2018 to 2022
    5.5. Absolute $ Opportunity Analysis By Hardware, 2023 to 2033
6. Global Market Analysis 2018 to 2022 and Forecast 2023 to 2033, By Power Consumption
    6.1. Introduction / Key Findings
    6.2. Historical Market Size Value (US$ Million) & Volume (Units) Analysis By Power Consumption, 2018 to 2022
    6.3. Current and Future Market Size Value (US$ Million) & Volume (Units) Analysis and Forecast By Power Consumption, 2023 to 2033
        6.3.1. Less than 1 W
        6.3.2. 1-3 W
        6.3.3. 3-5 W
        6.3.4. 5-10 W
        6.3.5. More than 10 W
    6.4. Y-o-Y Growth Trend Analysis By Power Consumption, 2018 to 2022
    6.5. Absolute $ Opportunity Analysis By Power Consumption, 2023 to 2033
7. Global Market Analysis 2018 to 2022 and Forecast 2023 to 2033, By End-use Application
    7.1. Introduction / Key Findings
    7.2. Historical Market Size Value (US$ Million) & Volume (Units) Analysis By End-use Application, 2018 to 2022
    7.3. Current and Future Market Size Value (US$ Million) & Volume (Units) Analysis and Forecast By End-use Application, 2023 to 2033
        7.3.1. Wearable Devices
        7.3.2. Healthcare
        7.3.3. Consumer Electronics
        7.3.4. Automotive & Transportation
        7.3.5. Building Automation
        7.3.6. Manufacturing
        7.3.7. Retail
        7.3.8. BFSI
        7.3.9. Oil & Gas
        7.3.10. Agriculture
        7.3.11. Aerospace & Defense
    7.4. Y-o-Y Growth Trend Analysis By End-use Application, 2018 to 2022
    7.5. Absolute $ Opportunity Analysis By End-use Application, 2023 to 2033
8. Global Market Analysis 2018 to 2022 and Forecast 2023 to 2033, By Region
    8.1. Introduction
    8.2. Historical Market Size Value (US$ Million) & Volume (Units) Analysis By Region, 2018 to 2022
    8.3. Current Market Size Value (US$ Million) & Volume (Units) Analysis and Forecast By Region, 2023 to 2033
        8.3.1. North America
        8.3.2. Latin America
        8.3.3. Europe
        8.3.4. Asia Pacific
        8.3.5. MEA
    8.4. Market Attractiveness Analysis By Region
9. North America Market Analysis 2018 to 2022 and Forecast 2023 to 2033, By Country
    9.1. Historical Market Size Value (US$ Million) & Volume (Units) Trend Analysis By Market Taxonomy, 2018 to 2022
    9.2. Market Size Value (US$ Million) & Volume (Units) Forecast By Market Taxonomy, 2023 to 2033
        9.2.1. By Country
            9.2.1.1. The USA
            9.2.1.2. Canada
        9.2.2. By Hardware
        9.2.3. By Power Consumption
        9.2.4. By End-use Application
    9.3. Market Attractiveness Analysis
        9.3.1. By Country
        9.3.2. By Hardware
        9.3.3. By Power Consumption
        9.3.4. By End-use Application
    9.4. Key Takeaways
10. Latin America Market Analysis 2018 to 2022 and Forecast 2023 to 2033, By Country
    10.1. Historical Market Size Value (US$ Million) & Volume (Units) Trend Analysis By Market Taxonomy, 2018 to 2022
    10.2. Market Size Value (US$ Million) & Volume (Units) Forecast By Market Taxonomy, 2023 to 2033
        10.2.1. By Country
            10.2.1.1. Brazil
            10.2.1.2. Mexico
            10.2.1.3. Rest of Latin America
        10.2.2. By Hardware
        10.2.3. By Power Consumption
        10.2.4. By End-use Application
    10.3. Market Attractiveness Analysis
        10.3.1. By Country
        10.3.2. By Hardware
        10.3.3. By Power Consumption
        10.3.4. By End-use Application
    10.4. Key Takeaways
11. Europe Market Analysis 2018 to 2022 and Forecast 2023 to 2033, By Country
    11.1. Historical Market Size Value (US$ Million) & Volume (Units) Trend Analysis By Market Taxonomy, 2018 to 2022
    11.2. Market Size Value (US$ Million) & Volume (Units) Forecast By Market Taxonomy, 2023 to 2033
        11.2.1. By Country
            11.2.1.1. Germany
            11.2.1.2. United Kingdom
            11.2.1.3. France
            11.2.1.4. Spain
            11.2.1.5. Italy
            11.2.1.6. Rest of Europe
        11.2.2. By Hardware
        11.2.3. By Power Consumption
        11.2.4. By End-use Application
    11.3. Market Attractiveness Analysis
        11.3.1. By Country
        11.3.2. By Hardware
        11.3.3. By Power Consumption
        11.3.4. By End-use Application
    11.4. Key Takeaways
12. Asia Pacific Market Analysis 2018 to 2022 and Forecast 2023 to 2033, By Country
    12.1. Historical Market Size Value (US$ Million) & Volume (Units) Trend Analysis By Market Taxonomy, 2018 to 2022
    12.2. Market Size Value (US$ Million) & Volume (Units) Forecast By Market Taxonomy, 2023 to 2033
        12.2.1. By Country
            12.2.1.1. China
            12.2.1.2. Japan
            12.2.1.3. South Korea
            12.2.1.4. Singapore
            12.2.1.5. Thailand
            12.2.1.6. Indonesia
            12.2.1.7. Australia
            12.2.1.8. New Zealand
            12.2.1.9. Rest of Asia Pacific
        12.2.2. By Hardware
        12.2.3. By Power Consumption
        12.2.4. By End-use Application
    12.3. Market Attractiveness Analysis
        12.3.1. By Country
        12.3.2. By Hardware
        12.3.3. By Power Consumption
        12.3.4. By End-use Application
    12.4. Key Takeaways
13. MEA Market Analysis 2018 to 2022 and Forecast 2023 to 2033, By Country
    13.1. Historical Market Size Value (US$ Million) & Volume (Units) Trend Analysis By Market Taxonomy, 2018 to 2022
    13.2. Market Size Value (US$ Million) & Volume (Units) Forecast By Market Taxonomy, 2023 to 2033
        13.2.1. By Country
            13.2.1.1. GCC Countries
            13.2.1.2. South Africa
            13.2.1.3. Israel
            13.2.1.4. Rest of MEA
        13.2.2. By Hardware
        13.2.3. By Power Consumption
        13.2.4. By End-use Application
    13.3. Market Attractiveness Analysis
        13.3.1. By Country
        13.3.2. By Hardware
        13.3.3. By Power Consumption
        13.3.4. By End-use Application
    13.4. Key Takeaways
14. Key Countries Market Analysis
    14.1. USA
        14.1.1. Pricing Analysis
        14.1.2. Market Share Analysis, 2022
            14.1.2.1. By Hardware
            14.1.2.2. By Power Consumption
            14.1.2.3. By End-use Application
    14.2. Canada
        14.2.1. Pricing Analysis
        14.2.2. Market Share Analysis, 2022
            14.2.2.1. By Hardware
            14.2.2.2. By Power Consumption
            14.2.2.3. By End-use Application
    14.3. Brazil
        14.3.1. Pricing Analysis
        14.3.2. Market Share Analysis, 2022
            14.3.2.1. By Hardware
            14.3.2.2. By Power Consumption
            14.3.2.3. By End-use Application
    14.4. Mexico
        14.4.1. Pricing Analysis
        14.4.2. Market Share Analysis, 2022
            14.4.2.1. By Hardware
            14.4.2.2. By Power Consumption
            14.4.2.3. By End-use Application
    14.5. Germany
        14.5.1. Pricing Analysis
        14.5.2. Market Share Analysis, 2022
            14.5.2.1. By Hardware
            14.5.2.2. By Power Consumption
            14.5.2.3. By End-use Application
    14.6. United Kingdom
        14.6.1. Pricing Analysis
        14.6.2. Market Share Analysis, 2022
            14.6.2.1. By Hardware
            14.6.2.2. By Power Consumption
            14.6.2.3. By End-use Application
    14.7. France
        14.7.1. Pricing Analysis
        14.7.2. Market Share Analysis, 2022
            14.7.2.1. By Hardware
            14.7.2.2. By Power Consumption
            14.7.2.3. By End-use Application
    14.8. Spain
        14.8.1. Pricing Analysis
        14.8.2. Market Share Analysis, 2022
            14.8.2.1. By Hardware
            14.8.2.2. By Power Consumption
            14.8.2.3. By End-use Application
    14.9. Italy
        14.9.1. Pricing Analysis
        14.9.2. Market Share Analysis, 2022
            14.9.2.1. By Hardware
            14.9.2.2. By Power Consumption
            14.9.2.3. By End-use Application
    14.10. China
        14.10.1. Pricing Analysis
        14.10.2. Market Share Analysis, 2022
            14.10.2.1. By Hardware
            14.10.2.2. By Power Consumption
            14.10.2.3. By End-use Application
    14.11. Japan
        14.11.1. Pricing Analysis
        14.11.2. Market Share Analysis, 2022
            14.11.2.1. By Hardware
            14.11.2.2. By Power Consumption
            14.11.2.3. By End-use Application
    14.12. South Korea
        14.12.1. Pricing Analysis
        14.12.2. Market Share Analysis, 2022
            14.12.2.1. By Hardware
            14.12.2.2. By Power Consumption
            14.12.2.3. By End-use Application
    14.13. Singapore
        14.13.1. Pricing Analysis
        14.13.2. Market Share Analysis, 2022
            14.13.2.1. By Hardware
            14.13.2.2. By Power Consumption
            14.13.2.3. By End-use Application
    14.14. Thailand
        14.14.1. Pricing Analysis
        14.14.2. Market Share Analysis, 2022
            14.14.2.1. By Hardware
            14.14.2.2. By Power Consumption
            14.14.2.3. By End-use Application
    14.15. Indonesia
        14.15.1. Pricing Analysis
        14.15.2. Market Share Analysis, 2022
            14.15.2.1. By Hardware
            14.15.2.2. By Power Consumption
            14.15.2.3. By End-use Application
    14.16. Australia
        14.16.1. Pricing Analysis
        14.16.2. Market Share Analysis, 2022
            14.16.2.1. By Hardware
            14.16.2.2. By Power Consumption
            14.16.2.3. By End-use Application
    14.17. New Zealand
        14.17.1. Pricing Analysis
        14.17.2. Market Share Analysis, 2022
            14.17.2.1. By Hardware
            14.17.2.2. By Power Consumption
            14.17.2.3. By End-use Application
    14.18. GCC Countries
        14.18.1. Pricing Analysis
        14.18.2. Market Share Analysis, 2022
            14.18.2.1. By Hardware
            14.18.2.2. By Power Consumption
            14.18.2.3. By End-use Application
    14.19. South Africa
        14.19.1. Pricing Analysis
        14.19.2. Market Share Analysis, 2022
            14.19.2.1. By Hardware
            14.19.2.2. By Power Consumption
            14.19.2.3. By End-use Application
    14.20. Israel
        14.20.1. Pricing Analysis
        14.20.2. Market Share Analysis, 2022
            14.20.2.1. By Hardware
            14.20.2.2. By Power Consumption
            14.20.2.3. By End-use Application
15. Market Structure Analysis
    15.1. Competition Dashboard
    15.2. Competition Benchmarking
    15.3. Market Share Analysis of Top Players
        15.3.1. By Regional
        15.3.2. By Hardware
        15.3.3. By Power Consumption
        15.3.4. By End-use Application
16. Competition Analysis
    16.1. Competition Deep Dive
        16.1.1. Intel Corporation
            16.1.1.1. Overview
            16.1.1.2. Product Portfolio
            16.1.1.3. Profitability by Market Segments
            16.1.1.4. Sales Footprint
            16.1.1.5. Strategy Overview
                16.1.1.5.1. Marketing Strategy
                16.1.1.5.2. Product Strategy
                16.1.1.5.3. Channel Strategy
        16.1.2. Qualcomm Incorporated
            16.1.2.1. Overview
            16.1.2.2. Product Portfolio
            16.1.2.3. Profitability by Market Segments
            16.1.2.4. Sales Footprint
            16.1.2.5. Strategy Overview
                16.1.2.5.1. Marketing Strategy
                16.1.2.5.2. Product Strategy
                16.1.2.5.3. Channel Strategy
        16.1.3. STMicroelectronics
            16.1.3.1. Overview
            16.1.3.2. Product Portfolio
            16.1.3.3. Profitability by Market Segments
            16.1.3.4. Sales Footprint
            16.1.3.5. Strategy Overview
                16.1.3.5.1. Marketing Strategy
                16.1.3.5.2. Product Strategy
                16.1.3.5.3. Channel Strategy
        16.1.4. Texas Instruments
            16.1.4.1. Overview
            16.1.4.2. Product Portfolio
            16.1.4.3. Profitability by Market Segments
            16.1.4.4. Sales Footprint
            16.1.4.5. Strategy Overview
                16.1.4.5.1. Marketing Strategy
                16.1.4.5.2. Product Strategy
                16.1.4.5.3. Channel Strategy
        16.1.5. MediaTek
            16.1.5.1. Overview
            16.1.5.2. Product Portfolio
            16.1.5.3. Profitability by Market Segments
            16.1.5.4. Sales Footprint
            16.1.5.5. Strategy Overview
                16.1.5.5.1. Marketing Strategy
                16.1.5.5.2. Product Strategy
                16.1.5.5.3. Channel Strategy
        16.1.6. Microchip Technology
            16.1.6.1. Overview
            16.1.6.2. Product Portfolio
            16.1.6.3. Profitability by Market Segments
            16.1.6.4. Sales Footprint
            16.1.6.5. Strategy Overview
                16.1.6.5.1. Marketing Strategy
                16.1.6.5.2. Product Strategy
                16.1.6.5.3. Channel Strategy
        16.1.7. Samsung Electronics
            16.1.7.1. Overview
            16.1.7.2. Product Portfolio
            16.1.7.3. Profitability by Market Segments
            16.1.7.4. Sales Footprint
            16.1.7.5. Strategy Overview
                16.1.7.5.1. Marketing Strategy
                16.1.7.5.2. Product Strategy
                16.1.7.5.3. Channel Strategy
        16.1.8. Silicon Laboratories
            16.1.8.1. Overview
            16.1.8.2. Product Portfolio
            16.1.8.3. Profitability by Market Segments
            16.1.8.4. Sales Footprint
            16.1.8.5. Strategy Overview
                16.1.8.5.1. Marketing Strategy
                16.1.8.5.2. Product Strategy
                16.1.8.5.3. Channel Strategy
        16.1.9. Nordic Semiconductor
            16.1.9.1. Overview
            16.1.9.2. Product Portfolio
            16.1.9.3. Profitability by Market Segments
            16.1.9.4. Sales Footprint
            16.1.9.5. Strategy Overview
                16.1.9.5.1. Marketing Strategy
                16.1.9.5.2. Product Strategy
                16.1.9.5.3. Channel Strategy
        16.1.10. NXP Semiconductors
            16.1.10.1. Overview
            16.1.10.2. Product Portfolio
            16.1.10.3. Profitability by Market Segments
            16.1.10.4. Sales Footprint
            16.1.10.5. Strategy Overview
                16.1.10.5.1. Marketing Strategy
                16.1.10.5.2. Product Strategy
                16.1.10.5.3. Channel Strategy
17. Assumptions & Acronyms Used
18. Research Methodology
Recommendations

Technology

IoT Processor Market

August 2023

REP-GB-2491

324 pages

Technology

IoT in Manufacturing Market

May 2023

REP-GB-14332

333 pages

Explore Technology Insights

View Reports
Future Market Insights

IoT Chip Market

Schedule a Call