Reports

- Global Locations -

Headquarters

Future Market Insights, Inc.

Christiana Corporate, 200
Continental Drive, Suite 401,
Newark, Delaware - 19713,
United States

T: +1-845-579-5705

Americas

Future Market Insights, Inc.

616 Corporate Way, Suite 2-9018,
Valley Cottage, NY 10989, United States

T: +1-347-918-3531

MEA

Future Market Insights

1602-6 Jumeirah Bay X2 Tower, Plot No: JLT-PH2-X2A,
Jumeirah Lakes Towers, Dubai,
United Arab Emirates

Europe

Future Market Insights

3rd Floor, 207 Regent Street,
W1B 3HH London
United Kingdom

T: + 44 (0) 20 8123 9659
D: +44 (0) 20 3287 4268

Asia Pacific

Future Market Insights

IndiaLand Global Tech Park, Unit UG-1, Behind Grand HighStreet, Phase 1, Hinjawadi, MH, Pune – 411057, India

IoT Application Enablement Market Overview (2023 to 2033)

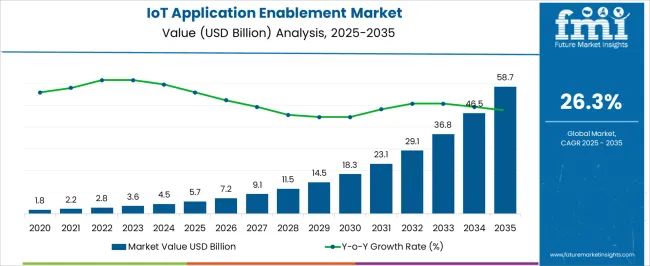
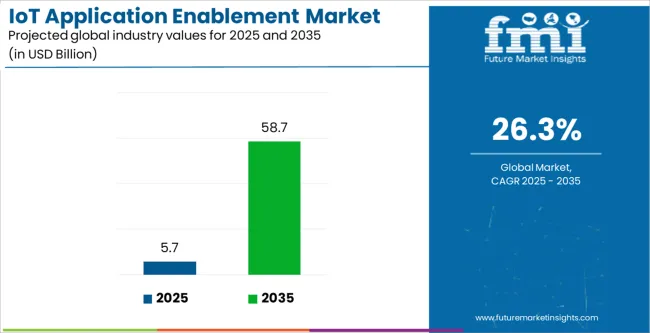
The IoT application enablement market revenue totaled US$ 2.8 billion in 2022. The IoT application enablement market is expected to reach US$ 40.5 billion by 2033, with demand growing at a CAGR of 27.5% over the forecast period.

Report Attribute Details
IoT Application Enablement Market Estimated Size (2023) US$ 3.5 billion
Projected Market Valuation (2033) US$ 40.5 billion
Value-based CAGR% (2023 to 2033) 27.5%
Top 5 Vendor Market Share Around 35%

The IoT application enablement market accounted for around 10.0% of the global IoT platform market. An application enablement platform (AEP) is a simple enterprise IoT platform that allows organizations to scale multiple devices with minimal code.

An IoT application enablement platform used in IoT applications in smart cities includes utilities (smart waste, lighting), connected traffic (smart parking, traffic management), environmental monitoring (air pollution), and public safety (video surveillance).

The growing adoption of IoT devices across various industries including manufacturing, energy, utilities, and healthcare is expected to drive the demand for IoT application enablement solutions.

Don't pay for what you don't need

Customize your report by selecting specific countries or regions and save 30%!

2018 to 2022 IoT Application Enablement Demand Outlook Compared to 2023 to 2033 Forecast

Sales in the IoT application enablement market are estimated to rise at a 27.5% CAGR between 2023 and 2033, in comparison with the 23.7% CAGR registered between 2018 to 2022. This attributes to the growing adoption of IoT applications among large as well as small and mid-sized enterprises (SMEs) across the globe.

Application Enablement Platform (AEP) or IoT application enablement platform is a form of platform-as-a-service that help businesses to develop their businesses with IoT and can help to provide a clear vision to an IoT solution.

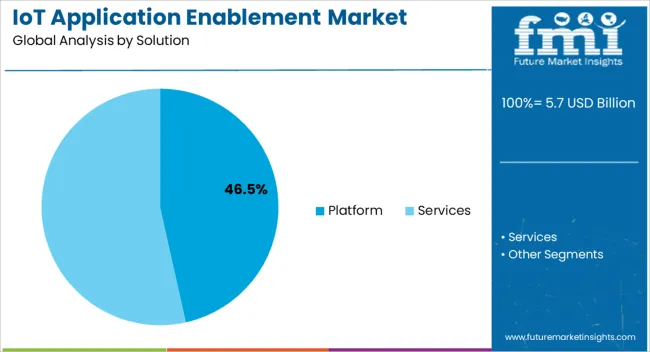
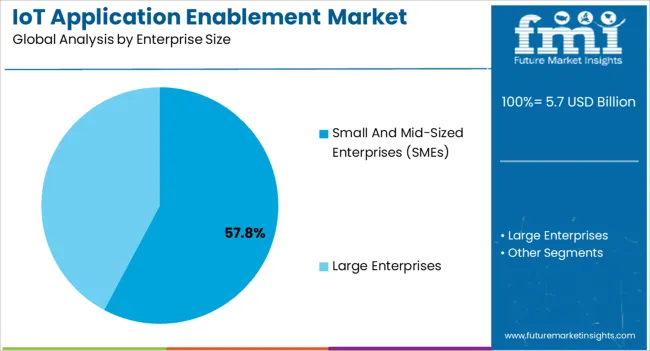
By enterprise size, demand in the SME segment is expected to grow at the highest CAGR of 29.0% during the forecast period. By solution, sales in the IoT application enablement platform segment are expected to grow at a CAGR of 27.7% over the forecast period.

How is the Growing Adoption of IoT Platforms across Organizations Fueling Growth?

IoT platforms help to streamline the functioning of IoT solutions and build IoT projects cheaper, faster, and better. The essential capabilities/features include network and connectivity management, data acquisition, device management, application enablement, processing visualization, and analysis, integration, and storage.

IoT platforms have become the backbone of professional IoT deployments, with more IoT devices, data, assets-related technologies, connectivity/network solutions, and infrastructural and architectural evolutions. Many businesses are adopting IoT platforms, and as a result of which, the demand for the IoT application enablement platform is increasing.

Sudip Saha
Sudip Saha

Principal Consultant

Talk to Analyst

Find your sweet spots for generating winning opportunities in this market.

Is Increasing Establishment of Smart Homes and Smart Cities Likely to Influence Demand?

Smart city networks use IoT technology in a variety of ways. One of the key challenges is traffic monitoring. The ability to monitor traffic using sensors located around the city allows improved control of intersections and traffic optimization. Monitoring water levels can also assist in detecting and informing communities about possible and active floods.

In smart cities and smart homes, IoT devices are used to detect and monitor weather conditions, conduct surveillance, and host public Wi-Fi. Thus, the rising adoption of IoT devices in smart homes and smart cities are poised to continue fueling sales in the market.
Country-wise Insights

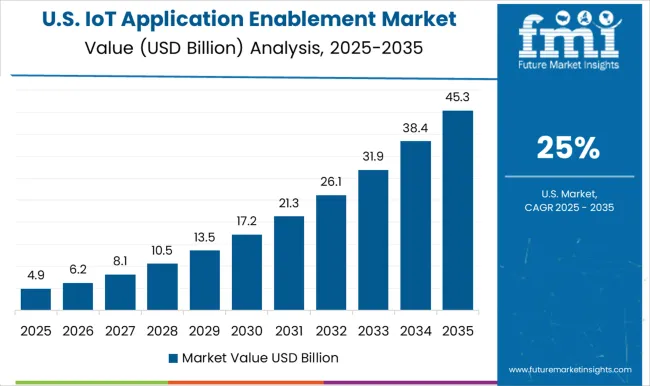
How is the United States IoT Application Enablement Market Faring?

Rising Adoption of IoT Application Enablement Services in the United States is expected to Boost Sales

Sales in the United States market are projected to increase at a CAGR of 20% over the forecast period, reaching a valuation of US$ 900 million in 2023.

The United States is one of the most developed countries considering infrastructure for advanced technologies. The presence of key application enablement platform providers including Amazon Web Services, IBM, Microsoft, and Oracle is assumed to drive product innovation in the market.

The presence of such prominent IoT application enablement solutions providers is ultimately projected to fuel the demand for IoT application enablement platforms.

What is driving the United Kingdom IoT Application Enablement Market?

Increasing Preference for IoT Application Enablement Solutions in the United Kingdom is anticipated to Fuel Growth

Demand in the United Kingdom market is anticipated to grow at a 34% CAGR over the forecast period, creating an absolute dollar opportunity of US$ 2.5 billion during the assessment period. The rising adoption of connective technologies such as artificial intelligence (AI) and machine learning (ML) is expected to fuel sales in the market.

For instance, the United Kingdom government launched a national program named IoT United Kingdom. Under this program, the United Kingdom Government has planned to invest 40 million pounds for the procurement and deployment of the Internet of Things (IoT). Thus, government initiatives and increasing adoption of innovative IoT technologies are projected to augment the growth in the market.

Why is Demand for IoT Application Enablement Platform Increasing in India?

Rapid Emergence of Startups in India is expected to Spur Demand for IoT Application Enablement Solution

India is set to emerge as a lucrative pocket in the South Asia market, with demand growing at a 32% CAGR over the assessment period. Rising government initiatives to encourage the adoption of advanced technologies such as big data, AI, the Internet of Things (IoT), and others are poised to augment sales in the market.

Initiatives such as Make in India, Digital India, IoT Centre of Excellence by NAAACOM, and many more are fueling growth in the IoT ecosystem in India, along with 5G technology development. Based on the aforementioned factors, sales in India are expected to increase at a considerable pace over the assessment period.

Get the data you need at a Fraction of the cost

Personalize your report by choosing insights you need
and save 40%!

Category-wise Insights

Which IoT Application Enablement Platform is More Preferred?

Sales of IoT Application Enablement Solutions to Remain High

Based on the solution, demand in the IoT application enablement platform segment increased by 11.5x, with sales growing at a 28% CAGR over the forecast period.

IoT application enablement platform helps enterprises unify multi-vertical operations, offer a uniform point of entry, power custom workflows, make organizational learning easy, and build flexible cores.

Why are Sales across Large Enterprises Increasing?

Adoption of IoT Application Enablement Platform Across Large Enterprises is Assumed to Gain Traction

Based on enterprise size, demand in the large enterprise segment is anticipated to increase by 9.1X, rising at a 29.5% CAGR through 2033.

IoT application enablement platform enables cost reduction, efficiency and productivity, enhanced customer experience, mobility, and agility. Therefore, large enterprises have the largest market share in 2023.

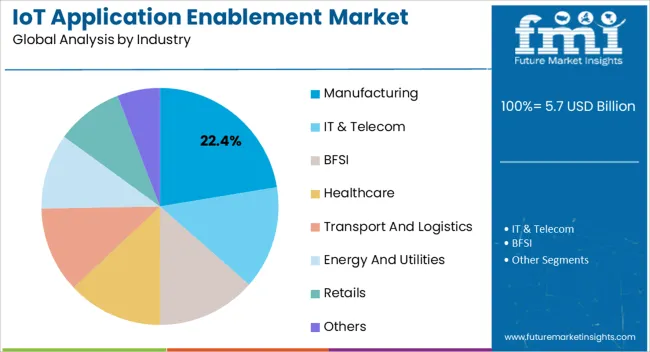
Which is the Leading Industry in the IoT Application Enablement Market?

Demand for IoT Application Enablement Solutions in the Manufacturing Sector Will is Anticipated to increase

Based on industry, the manufacturing segment will expand by 12.2x, with sales growing at a 34.5% CAGR over the forecast period.

IoT applications in the manufacturing industry include intelligent product enhancements, dynamic response to market demand, improved facility service, lower costs, waste reduction and optimized resource use, quality control, predictive maintenance, and inventory management.
Competitive Landscape

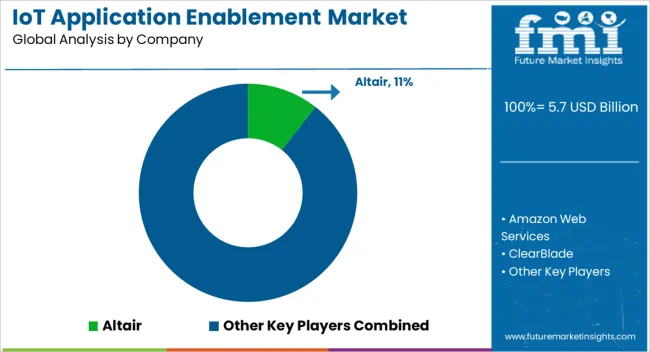
Key IoT application enablement solution providers are focusing on investing in research and development and innovation to offer various solutions for industrial applications. For instance:

  • In November 2019, AllThingsTalk announced a partnership with XinaBox. This partnership helps to provide non-expert and expert users with an easy way to explore IoT by creating IoT systems and smart devices. It helps to leverage and explore IoT technologies and big data many users face a complex landscape of software, hardware, and IoT services.
  • Litmus revealed in September 2023 that it has closed US$ 30 million in a Series B funding to conclude a year of expansion in the implementation of its Industrial IoT Edge platform. Belden led the Series B, with cooperation from other financiers, demonstrating Litmus Edge's robustness as the standard data system for Industry 4.0.
  • According to its July 2023 research, iConnect ONE's 5G and IoT solution delivers operators with the capacity needed to capitalize on some of the most promising opportunities generated by these developments for telecom operators. This comprises technical assistance, consulting services, and platform-as-a-service, which assists operators in expanding their local network while also providing novel and creative services to their clients.

Scope of Report

Attribute Details
Estimated Market Size (2023) US$ 3.5 billion
Projected Market Valuation (2033) US$ 40.5 billion
Growth Rate CAGR of 27.5% from 2023 to 2033
Forecast Period 2023 to 2033
Historical Data Available for 2018 to 2022
Report Coverage Market Forecast, Company Share Analysis, Competition Intelligence, Drivers, Restraints, Opportunities and Threats Analysis, Market Dynamics and Challenges, and Strategic Growth Initiatives
Market Analysis US$ billion for Value
Key Regions Covered
  • North America
  • Latin America
  • Western Europe
  • Eastern Europe
  • South Asia & Pacific
  • East Asia
  • Middle East & Africa
Key Countries Covered
  • United States
  • Canada
  • Brazil
  • Mexico
  • Germany
  • United Kingdom
  • France
  • Spain
  • Italy
  • Poland
  • Russia
  • Czech Republic
  • Romania
  • India
  • Bangladesh
  • Australia
  • New Zealand
  • China
  • Japan
  • South Korea
  • GCC Countries
  • South Africa
  • Israel
Key Segments Covered
  • Solution
  • Enterprise Size
  • Industry
  • Region
Key Companies Profiled
  • Altair
  • Amazon Web Services
  • ClearBlade
  • Ericsson
  • Fujitsu
  • IBM
  • Microsoft
  • Oracle Corporation
  • PTC
  • SAP
  • Siemens
  • AllThingsTalk
  • Hughes Systique Corporation
  • Software AG
Customization & Pricing Available upon Request

IoT Application Enablement Outlook by Category

By Solution:

  • Platform
    • Cloud-based
    • On-Premises
  • Services
    • Professional Service
    • Managed Services

By Enterprise Size:

  • Small and Mid-Sized Enterprises (SMEs)
  • Large Enterprises

By Industry:

  • Manufacturing
  • IT & Telecom
  • BFSI
  • Healthcare
  • Transport and Logistics
  • Energy and Utilities
  • Retails
  • Others

By Region:

  • North America
  • Latin America
  • Western Europe
  • Eastern Europe
  • South Asia & Pacific
  • East Asia
  • Middle East & Africa

Frequently Asked Questions

What is the Market's Potential for Growth?

The market may advance at a 27.5% CAGR through 2033.

What is the Market's Estimated Size by 2033?

By 2033, the market is anticipated to arrive at US$ 40.5 billion.

How Has the Market Evolved Historically?

From 2018 to 2022, the global market climbed at an HCAGR of 23.7%.

What are the Prospects for The United States Growth?

A 20% CAGR is anticipated to be maintained in the United States market.

What Is India’s Growth Outlook?

Sales are set to rise in India at a CAGR of 32% until 2033.

Which is the Leading Segment in the Market by Enterprise Size?

Demand in the large enterprise segment contributes to through 2033 at a 29.5% CAGR based on enterprise size.

Table of Content

1. Executive Summary

    1.1. Global Market Outlook

    1.2. Demand-side Trends

    1.3. Supply-side Trends

    1.4. Technology Roadmap Analysis

    1.5. Analysis and Recommendations

2. Market Overview

    2.1. Market Coverage / Taxonomy

    2.2. Market Definition / Scope / Limitations

3. Market Background

    3.1. Market Dynamics

        3.1.1. Drivers

        3.1.2. Restraints

        3.1.3. Opportunity

        3.1.4. Trends

    3.2. Scenario Forecast

        3.2.1. Demand in Optimistic Scenario

        3.2.2. Demand in Likely Scenario

        3.2.3. Demand in Conservative Scenario

    3.3. Opportunity Map Analysis

    3.4. Investment Feasibility Matrix

    3.5. PESTLE and Porter’s Analysis

    3.6. Regulatory Landscape

        3.6.1. By Key Regions

        3.6.2. By Key Countries

    3.7. Regional Parent Market Outlook

4. Global Market Analysis 2018 to 2022 and Forecast, 2023 to 2033

    4.1. Historical Market Size Value (US$ Million) Analysis, 2018 to 2022

    4.2. Current and Future Market Size Value (US$ Million) Projections, 2023 to 2033

        4.2.1. Y-o-Y Growth Trend Analysis

        4.2.2. Absolute $ Opportunity Analysis

5. Global Market Analysis 2018 to 2022 and Forecast 2023 to 2033, By Solution

    5.1. Introduction / Key Findings

    5.2. Historical Market Size Value (US$ Million) Analysis By Solution, 2018 to 2022

    5.3. Current and Future Market Size Value (US$ Million) Analysis and Forecast By Solution, 2023 to 2033

        5.3.1. Platform

            5.3.1.1. Cloud-based

            5.3.1.2. On-Premises

        5.3.2. Services

            5.3.2.1. Professional Service

            5.3.2.2. Managed Services

    5.4. Y-o-Y Growth Trend Analysis By Solution, 2018 to 2022

    5.5. Absolute $ Opportunity Analysis By Solution, 2023 to 2033

6. Global Market Analysis 2018 to 2022 and Forecast 2023 to 2033, By Enterprise Size

    6.1. Introduction / Key Findings

    6.2. Historical Market Size Value (US$ Million) Analysis By Enterprise Size, 2018 to 2022

    6.3. Current and Future Market Size Value (US$ Million) Analysis and Forecast By Enterprise Size, 2023 to 2033

        6.3.1. Small and Mid-Sized Enterprises (SMEs)

        6.3.2. Large Enterprises

    6.4. Y-o-Y Growth Trend Analysis By Enterprise Size, 2018 to 2022

    6.5. Absolute $ Opportunity Analysis By Enterprise Size, 2023 to 2033

7. Global Market Analysis 2018 to 2022 and Forecast 2023 to 2033, By Industry

    7.1. Introduction / Key Findings

    7.2. Historical Market Size Value (US$ Million) Analysis By Industry, 2018 to 2022

    7.3. Current and Future Market Size Value (US$ Million) Analysis and Forecast By Industry, 2023 to 2033

        7.3.1. Manufacturing

        7.3.2. IT & Telecom

        7.3.3. BFSI

        7.3.4. Healthcare

        7.3.5. Transport and Logistics

        7.3.6. Energy and Utilities

        7.3.7. Retails

        7.3.8. Others

    7.4. Y-o-Y Growth Trend Analysis By Industry, 2018 to 2022

    7.5. Absolute $ Opportunity Analysis By Industry, 2023 to 2033

8. Global Market Analysis 2018 to 2022 and Forecast 2023 to 2033, By Region

    8.1. Introduction

    8.2. Historical Market Size Value (US$ Million) Analysis By Region, 2018 to 2022

    8.3. Current Market Size Value (US$ Million) Analysis and Forecast By Region, 2023 to 2033

        8.3.1. North America

        8.3.2. Latin America

        8.3.3. Western Europe

        8.3.4. Eastern Europe

        8.3.5. South Asia and Pacific

        8.3.6. East Asia

        8.3.7. Middle East and Africa

    8.4. Market Attractiveness Analysis By Region

9. North America Market Analysis 2018 to 2022 and Forecast 2023 to 2033, By Country

    9.1. Historical Market Size Value (US$ Million) Trend Analysis By Market Taxonomy, 2018 to 2022

    9.2. Market Size Value (US$ Million) Forecast By Market Taxonomy, 2023 to 2033

        9.2.1. By Country

            9.2.1.1. USA

            9.2.1.2. Canada

        9.2.2. By Solution

        9.2.3. By Enterprise Size

        9.2.4. By Industry

    9.3. Market Attractiveness Analysis

        9.3.1. By Country

        9.3.2. By Solution

        9.3.3. By Enterprise Size

        9.3.4. By Industry

    9.4. Key Takeaways

10. Latin America Market Analysis 2018 to 2022 and Forecast 2023 to 2033, By Country

    10.1. Historical Market Size Value (US$ Million) Trend Analysis By Market Taxonomy, 2018 to 2022

    10.2. Market Size Value (US$ Million) Forecast By Market Taxonomy, 2023 to 2033

        10.2.1. By Country

            10.2.1.1. Brazil

            10.2.1.2. Mexico

            10.2.1.3. Rest of Latin America

        10.2.2. By Solution

        10.2.3. By Enterprise Size

        10.2.4. By Industry

    10.3. Market Attractiveness Analysis

        10.3.1. By Country

        10.3.2. By Solution

        10.3.3. By Enterprise Size

        10.3.4. By Industry

    10.4. Key Takeaways

11. Western Europe Market Analysis 2018 to 2022 and Forecast 2023 to 2033, By Country

    11.1. Historical Market Size Value (US$ Million) Trend Analysis By Market Taxonomy, 2018 to 2022

    11.2. Market Size Value (US$ Million) Forecast By Market Taxonomy, 2023 to 2033

        11.2.1. By Country

            11.2.1.1. Germany

            11.2.1.2. UK

            11.2.1.3. France

            11.2.1.4. Spain

            11.2.1.5. Italy

            11.2.1.6. Rest of Western Europe

        11.2.2. By Solution

        11.2.3. By Enterprise Size

        11.2.4. By Industry

    11.3. Market Attractiveness Analysis

        11.3.1. By Country

        11.3.2. By Solution

        11.3.3. By Enterprise Size

        11.3.4. By Industry

    11.4. Key Takeaways

12. Eastern Europe Market Analysis 2018 to 2022 and Forecast 2023 to 2033, By Country

    12.1. Historical Market Size Value (US$ Million) Trend Analysis By Market Taxonomy, 2018 to 2022

    12.2. Market Size Value (US$ Million) Forecast By Market Taxonomy, 2023 to 2033

        12.2.1. By Country

            12.2.1.1. Poland

            12.2.1.2. Russia

            12.2.1.3. Czech Republic

            12.2.1.4. Romania

            12.2.1.5. Rest of Eastern Europe

        12.2.2. By Solution

        12.2.3. By Enterprise Size

        12.2.4. By Industry

    12.3. Market Attractiveness Analysis

        12.3.1. By Country

        12.3.2. By Solution

        12.3.3. By Enterprise Size

        12.3.4. By Industry

    12.4. Key Takeaways

13. South Asia and Pacific Market Analysis 2018 to 2022 and Forecast 2023 to 2033, By Country

    13.1. Historical Market Size Value (US$ Million) Trend Analysis By Market Taxonomy, 2018 to 2022

    13.2. Market Size Value (US$ Million) Forecast By Market Taxonomy, 2023 to 2033

        13.2.1. By Country

            13.2.1.1. India

            13.2.1.2. Bangladesh

            13.2.1.3. Australia

            13.2.1.4. New Zealand

            13.2.1.5. Rest of South Asia and Pacific

        13.2.2. By Solution

        13.2.3. By Enterprise Size

        13.2.4. By Industry

    13.3. Market Attractiveness Analysis

        13.3.1. By Country

        13.3.2. By Solution

        13.3.3. By Enterprise Size

        13.3.4. By Industry

    13.4. Key Takeaways

14. East Asia Market Analysis 2018 to 2022 and Forecast 2023 to 2033, By Country

    14.1. Historical Market Size Value (US$ Million) Trend Analysis By Market Taxonomy, 2018 to 2022

    14.2. Market Size Value (US$ Million) Forecast By Market Taxonomy, 2023 to 2033

        14.2.1. By Country

            14.2.1.1. China

            14.2.1.2. Japan

            14.2.1.3. South Korea

        14.2.2. By Solution

        14.2.3. By Enterprise Size

        14.2.4. By Industry

    14.3. Market Attractiveness Analysis

        14.3.1. By Country

        14.3.2. By Solution

        14.3.3. By Enterprise Size

        14.3.4. By Industry

    14.4. Key Takeaways

15. Middle East and Africa Market Analysis 2018 to 2022 and Forecast 2023 to 2033, By Country

    15.1. Historical Market Size Value (US$ Million) Trend Analysis By Market Taxonomy, 2018 to 2022

    15.2. Market Size Value (US$ Million) Forecast By Market Taxonomy, 2023 to 2033

        15.2.1. By Country

            15.2.1.1. GCC Countries

            15.2.1.2. South Africa

            15.2.1.3. Israel

            15.2.1.4. Rest of MEA

        15.2.2. By Solution

        15.2.3. By Enterprise Size

        15.2.4. By Industry

    15.3. Market Attractiveness Analysis

        15.3.1. By Country

        15.3.2. By Solution

        15.3.3. By Enterprise Size

        15.3.4. By Industry

    15.4. Key Takeaways

16. Key Countries Market Analysis

    16.1. USA

        16.1.1. Pricing Analysis

        16.1.2. Market Share Analysis, 2022

            16.1.2.1. By Solution

            16.1.2.2. By Enterprise Size

            16.1.2.3. By Industry

    16.2. Canada

        16.2.1. Pricing Analysis

        16.2.2. Market Share Analysis, 2022

            16.2.2.1. By Solution

            16.2.2.2. By Enterprise Size

            16.2.2.3. By Industry

    16.3. Brazil

        16.3.1. Pricing Analysis

        16.3.2. Market Share Analysis, 2022

            16.3.2.1. By Solution

            16.3.2.2. By Enterprise Size

            16.3.2.3. By Industry

    16.4. Mexico

        16.4.1. Pricing Analysis

        16.4.2. Market Share Analysis, 2022

            16.4.2.1. By Solution

            16.4.2.2. By Enterprise Size

            16.4.2.3. By Industry

    16.5. Germany

        16.5.1. Pricing Analysis

        16.5.2. Market Share Analysis, 2022

            16.5.2.1. By Solution

            16.5.2.2. By Enterprise Size

            16.5.2.3. By Industry

    16.6. UK

        16.6.1. Pricing Analysis

        16.6.2. Market Share Analysis, 2022

            16.6.2.1. By Solution

            16.6.2.2. By Enterprise Size

            16.6.2.3. By Industry

    16.7. France

        16.7.1. Pricing Analysis

        16.7.2. Market Share Analysis, 2022

            16.7.2.1. By Solution

            16.7.2.2. By Enterprise Size

            16.7.2.3. By Industry

    16.8. Spain

        16.8.1. Pricing Analysis

        16.8.2. Market Share Analysis, 2022

            16.8.2.1. By Solution

            16.8.2.2. By Enterprise Size

            16.8.2.3. By Industry

    16.9. Italy

        16.9.1. Pricing Analysis

        16.9.2. Market Share Analysis, 2022

            16.9.2.1. By Solution

            16.9.2.2. By Enterprise Size

            16.9.2.3. By Industry

    16.10. Poland

        16.10.1. Pricing Analysis

        16.10.2. Market Share Analysis, 2022

            16.10.2.1. By Solution

            16.10.2.2. By Enterprise Size

            16.10.2.3. By Industry

    16.11. Russia

        16.11.1. Pricing Analysis

        16.11.2. Market Share Analysis, 2022

            16.11.2.1. By Solution

            16.11.2.2. By Enterprise Size

            16.11.2.3. By Industry

    16.12. Czech Republic

        16.12.1. Pricing Analysis

        16.12.2. Market Share Analysis, 2022

            16.12.2.1. By Solution

            16.12.2.2. By Enterprise Size

            16.12.2.3. By Industry

    16.13. Romania

        16.13.1. Pricing Analysis

        16.13.2. Market Share Analysis, 2022

            16.13.2.1. By Solution

            16.13.2.2. By Enterprise Size

            16.13.2.3. By Industry

    16.14. India

        16.14.1. Pricing Analysis

        16.14.2. Market Share Analysis, 2022

            16.14.2.1. By Solution

            16.14.2.2. By Enterprise Size

            16.14.2.3. By Industry

    16.15. Bangladesh

        16.15.1. Pricing Analysis

        16.15.2. Market Share Analysis, 2022

            16.15.2.1. By Solution

            16.15.2.2. By Enterprise Size

            16.15.2.3. By Industry

    16.16. Australia

        16.16.1. Pricing Analysis

        16.16.2. Market Share Analysis, 2022

            16.16.2.1. By Solution

            16.16.2.2. By Enterprise Size

            16.16.2.3. By Industry

    16.17. New Zealand

        16.17.1. Pricing Analysis

        16.17.2. Market Share Analysis, 2022

            16.17.2.1. By Solution

            16.17.2.2. By Enterprise Size

            16.17.2.3. By Industry

    16.18. China

        16.18.1. Pricing Analysis

        16.18.2. Market Share Analysis, 2022

            16.18.2.1. By Solution

            16.18.2.2. By Enterprise Size

            16.18.2.3. By Industry

    16.19. Japan

        16.19.1. Pricing Analysis

        16.19.2. Market Share Analysis, 2022

            16.19.2.1. By Solution

            16.19.2.2. By Enterprise Size

            16.19.2.3. By Industry

    16.20. South Korea

        16.20.1. Pricing Analysis

        16.20.2. Market Share Analysis, 2022

            16.20.2.1. By Solution

            16.20.2.2. By Enterprise Size

            16.20.2.3. By Industry

    16.21. GCC Countries

        16.21.1. Pricing Analysis

        16.21.2. Market Share Analysis, 2022

            16.21.2.1. By Solution

            16.21.2.2. By Enterprise Size

            16.21.2.3. By Industry

    16.22. South Africa

        16.22.1. Pricing Analysis

        16.22.2. Market Share Analysis, 2022

            16.22.2.1. By Solution

            16.22.2.2. By Enterprise Size

            16.22.2.3. By Industry

    16.23. Israel

        16.23.1. Pricing Analysis

        16.23.2. Market Share Analysis, 2022

            16.23.2.1. By Solution

            16.23.2.2. By Enterprise Size

            16.23.2.3. By Industry

17. Market Structure Analysis

    17.1. Competition Dashboard

    17.2. Competition Benchmarking

    17.3. Market Share Analysis of Top Players

        17.3.1. By Regional

        17.3.2. By Solution

        17.3.3. By Enterprise Size

        17.3.4. By Industry

18. Competition Analysis

    18.1. Competition Deep Dive

        18.1.1. Altair

            18.1.1.1. Overview

            18.1.1.2. Product Portfolio

            18.1.1.3. Profitability by Market Segments

            18.1.1.4. Sales Footprint

            18.1.1.5. Strategy Overview

                18.1.1.5.1. Marketing Strategy

        18.1.2. Amazon Web Services

            18.1.2.1. Overview

            18.1.2.2. Product Portfolio

            18.1.2.3. Profitability by Market Segments

            18.1.2.4. Sales Footprint

            18.1.2.5. Strategy Overview

                18.1.2.5.1. Marketing Strategy

        18.1.3. ClearBlade

            18.1.3.1. Overview

            18.1.3.2. Product Portfolio

            18.1.3.3. Profitability by Market Segments

            18.1.3.4. Sales Footprint

            18.1.3.5. Strategy Overview

                18.1.3.5.1. Marketing Strategy

        18.1.4. Ericsson

            18.1.4.1. Overview

            18.1.4.2. Product Portfolio

            18.1.4.3. Profitability by Market Segments

            18.1.4.4. Sales Footprint

            18.1.4.5. Strategy Overview

                18.1.4.5.1. Marketing Strategy

        18.1.5. Fujitsu

            18.1.5.1. Overview

            18.1.5.2. Product Portfolio

            18.1.5.3. Profitability by Market Segments

            18.1.5.4. Sales Footprint

            18.1.5.5. Strategy Overview

                18.1.5.5.1. Marketing Strategy

        18.1.6. IBM

            18.1.6.1. Overview

            18.1.6.2. Product Portfolio

            18.1.6.3. Profitability by Market Segments

            18.1.6.4. Sales Footprint

            18.1.6.5. Strategy Overview

                18.1.6.5.1. Marketing Strategy

        18.1.7. Microsoft

            18.1.7.1. Overview

            18.1.7.2. Product Portfolio

            18.1.7.3. Profitability by Market Segments

            18.1.7.4. Sales Footprint

            18.1.7.5. Strategy Overview

                18.1.7.5.1. Marketing Strategy

        18.1.8. Oracle Corporation

            18.1.8.1. Overview

            18.1.8.2. Product Portfolio

            18.1.8.3. Profitability by Market Segments

            18.1.8.4. Sales Footprint

            18.1.8.5. Strategy Overview

                18.1.8.5.1. Marketing Strategy

        18.1.9. PTC

            18.1.9.1. Overview

            18.1.9.2. Product Portfolio

            18.1.9.3. Profitability by Market Segments

            18.1.9.4. Sales Footprint

            18.1.9.5. Strategy Overview

                18.1.9.5.1. Marketing Strategy

        18.1.10. SAP

            18.1.10.1. Overview

            18.1.10.2. Product Portfolio

            18.1.10.3. Profitability by Market Segments

            18.1.10.4. Sales Footprint

            18.1.10.5. Strategy Overview

                18.1.10.5.1. Marketing Strategy

        18.1.11. Siemens

            18.1.11.1. Overview

            18.1.11.2. Product Portfolio

            18.1.11.3. Profitability by Market Segments

            18.1.11.4. Sales Footprint

            18.1.11.5. Strategy Overview

                18.1.11.5.1. Marketing Strategy

        18.1.12. AllThingsTalk

            18.1.12.1. Overview

            18.1.12.2. Product Portfolio

            18.1.12.3. Profitability by Market Segments

            18.1.12.4. Sales Footprint

            18.1.12.5. Strategy Overview

                18.1.12.5.1. Marketing Strategy

        18.1.13. Hughes Systique Corporation

            18.1.13.1. Overview

            18.1.13.2. Product Portfolio

            18.1.13.3. Profitability by Market Segments

            18.1.13.4. Sales Footprint

            18.1.13.5. Strategy Overview

                18.1.13.5.1. Marketing Strategy

        18.1.14. Software AG

            18.1.14.1. Overview

            18.1.14.2. Product Portfolio

            18.1.14.3. Profitability by Market Segments

            18.1.14.4. Sales Footprint

            18.1.14.5. Strategy Overview

                18.1.14.5.1. Marketing Strategy

19. Assumptions & Acronyms Used

20. Research Methodology

Don't pay for what you don't need

Customize your report by selecting specific countries or regions and save 30%!

List of Tables

Table 1: Global Market Value (US$ Million) Forecast by Region, 2018 to 2033

Table 2: Global Market Value (US$ Million) Forecast by Solution, 2018 to 2033

Table 3: Global Market Value (US$ Million) Forecast by Enterprise Size, 2018 to 2033

Table 4: Global Market Value (US$ Million) Forecast by Industry, 2018 to 2033

Table 5: North America Market Value (US$ Million) Forecast by Country, 2018 to 2033

Table 6: North America Market Value (US$ Million) Forecast by Solution, 2018 to 2033

Table 7: North America Market Value (US$ Million) Forecast by Enterprise Size, 2018 to 2033

Table 8: North America Market Value (US$ Million) Forecast by Industry, 2018 to 2033

Table 9: Latin America Market Value (US$ Million) Forecast by Country, 2018 to 2033

Table 10: Latin America Market Value (US$ Million) Forecast by Solution, 2018 to 2033

Table 11: Latin America Market Value (US$ Million) Forecast by Enterprise Size, 2018 to 2033

Table 12: Latin America Market Value (US$ Million) Forecast by Industry, 2018 to 2033

Table 13: Western Europe Market Value (US$ Million) Forecast by Country, 2018 to 2033

Table 14: Western Europe Market Value (US$ Million) Forecast by Solution, 2018 to 2033

Table 15: Western Europe Market Value (US$ Million) Forecast by Enterprise Size, 2018 to 2033

Table 16: Western Europe Market Value (US$ Million) Forecast by Industry, 2018 to 2033

Table 17: Eastern Europe Market Value (US$ Million) Forecast by Country, 2018 to 2033

Table 18: Eastern Europe Market Value (US$ Million) Forecast by Solution, 2018 to 2033

Table 19: Eastern Europe Market Value (US$ Million) Forecast by Enterprise Size, 2018 to 2033

Table 20: Eastern Europe Market Value (US$ Million) Forecast by Industry, 2018 to 2033

Table 21: South Asia and Pacific Market Value (US$ Million) Forecast by Country, 2018 to 2033

Table 22: South Asia and Pacific Market Value (US$ Million) Forecast by Solution, 2018 to 2033

Table 23: South Asia and Pacific Market Value (US$ Million) Forecast by Enterprise Size, 2018 to 2033

Table 24: South Asia and Pacific Market Value (US$ Million) Forecast by Industry, 2018 to 2033

Table 25: East Asia Market Value (US$ Million) Forecast by Country, 2018 to 2033

Table 26: East Asia Market Value (US$ Million) Forecast by Solution, 2018 to 2033

Table 27: East Asia Market Value (US$ Million) Forecast by Enterprise Size, 2018 to 2033

Table 28: East Asia Market Value (US$ Million) Forecast by Industry, 2018 to 2033

Table 29: Middle East and Africa Market Value (US$ Million) Forecast by Country, 2018 to 2033

Table 30: Middle East and Africa Market Value (US$ Million) Forecast by Solution, 2018 to 2033

Table 31: Middle East and Africa Market Value (US$ Million) Forecast by Enterprise Size, 2018 to 2033

Table 32: Middle East and Africa Market Value (US$ Million) Forecast by Industry, 2018 to 2033
Sudip Saha
Sudip Saha

Principal Consultant

Talk to Analyst

Find your sweet spots for generating winning opportunities in this market.

List of Charts

Figure 1: Global Market Value (US$ Million) by Solution, 2023 to 2033

Figure 2: Global Market Value (US$ Million) by Enterprise Size, 2023 to 2033

Figure 3: Global Market Value (US$ Million) by Industry, 2023 to 2033

Figure 4: Global Market Value (US$ Million) by Region, 2023 to 2033

Figure 5: Global Market Value (US$ Million) Analysis by Region, 2018 to 2033

Figure 6: Global Market Value Share (%) and BPS Analysis by Region, 2023 to 2033

Figure 7: Global Market Y-o-Y Growth (%) Projections by Region, 2023 to 2033

Figure 8: Global Market Value (US$ Million) Analysis by Solution, 2018 to 2033

Figure 9: Global Market Value Share (%) and BPS Analysis by Solution, 2023 to 2033

Figure 10: Global Market Y-o-Y Growth (%) Projections by Solution, 2023 to 2033

Figure 11: Global Market Value (US$ Million) Analysis by Enterprise Size, 2018 to 2033

Figure 12: Global Market Value Share (%) and BPS Analysis by Enterprise Size, 2023 to 2033

Figure 13: Global Market Y-o-Y Growth (%) Projections by Enterprise Size, 2023 to 2033

Figure 14: Global Market Value (US$ Million) Analysis by Industry, 2018 to 2033

Figure 15: Global Market Value Share (%) and BPS Analysis by Industry, 2023 to 2033

Figure 16: Global Market Y-o-Y Growth (%) Projections by Industry, 2023 to 2033

Figure 17: Global Market Attractiveness by Solution, 2023 to 2033

Figure 18: Global Market Attractiveness by Enterprise Size, 2023 to 2033

Figure 19: Global Market Attractiveness by Industry, 2023 to 2033

Figure 20: Global Market Attractiveness by Region, 2023 to 2033

Figure 21: North America Market Value (US$ Million) by Solution, 2023 to 2033

Figure 22: North America Market Value (US$ Million) by Enterprise Size, 2023 to 2033

Figure 23: North America Market Value (US$ Million) by Industry, 2023 to 2033

Figure 24: North America Market Value (US$ Million) by Country, 2023 to 2033

Figure 25: North America Market Value (US$ Million) Analysis by Country, 2018 to 2033

Figure 26: North America Market Value Share (%) and BPS Analysis by Country, 2023 to 2033

Figure 27: North America Market Y-o-Y Growth (%) Projections by Country, 2023 to 2033

Figure 28: North America Market Value (US$ Million) Analysis by Solution, 2018 to 2033

Figure 29: North America Market Value Share (%) and BPS Analysis by Solution, 2023 to 2033

Figure 30: North America Market Y-o-Y Growth (%) Projections by Solution, 2023 to 2033

Figure 31: North America Market Value (US$ Million) Analysis by Enterprise Size, 2018 to 2033

Figure 32: North America Market Value Share (%) and BPS Analysis by Enterprise Size, 2023 to 2033

Figure 33: North America Market Y-o-Y Growth (%) Projections by Enterprise Size, 2023 to 2033

Figure 34: North America Market Value (US$ Million) Analysis by Industry, 2018 to 2033

Figure 35: North America Market Value Share (%) and BPS Analysis by Industry, 2023 to 2033

Figure 36: North America Market Y-o-Y Growth (%) Projections by Industry, 2023 to 2033

Figure 37: North America Market Attractiveness by Solution, 2023 to 2033

Figure 38: North America Market Attractiveness by Enterprise Size, 2023 to 2033

Figure 39: North America Market Attractiveness by Industry, 2023 to 2033

Figure 40: North America Market Attractiveness by Country, 2023 to 2033

Figure 41: Latin America Market Value (US$ Million) by Solution, 2023 to 2033

Figure 42: Latin America Market Value (US$ Million) by Enterprise Size, 2023 to 2033

Figure 43: Latin America Market Value (US$ Million) by Industry, 2023 to 2033

Figure 44: Latin America Market Value (US$ Million) by Country, 2023 to 2033

Figure 45: Latin America Market Value (US$ Million) Analysis by Country, 2018 to 2033

Figure 46: Latin America Market Value Share (%) and BPS Analysis by Country, 2023 to 2033

Figure 47: Latin America Market Y-o-Y Growth (%) Projections by Country, 2023 to 2033

Figure 48: Latin America Market Value (US$ Million) Analysis by Solution, 2018 to 2033

Figure 49: Latin America Market Value Share (%) and BPS Analysis by Solution, 2023 to 2033

Figure 50: Latin America Market Y-o-Y Growth (%) Projections by Solution, 2023 to 2033

Figure 51: Latin America Market Value (US$ Million) Analysis by Enterprise Size, 2018 to 2033

Figure 52: Latin America Market Value Share (%) and BPS Analysis by Enterprise Size, 2023 to 2033

Figure 53: Latin America Market Y-o-Y Growth (%) Projections by Enterprise Size, 2023 to 2033

Figure 54: Latin America Market Value (US$ Million) Analysis by Industry, 2018 to 2033

Figure 55: Latin America Market Value Share (%) and BPS Analysis by Industry, 2023 to 2033

Figure 56: Latin America Market Y-o-Y Growth (%) Projections by Industry, 2023 to 2033

Figure 57: Latin America Market Attractiveness by Solution, 2023 to 2033

Figure 58: Latin America Market Attractiveness by Enterprise Size, 2023 to 2033

Figure 59: Latin America Market Attractiveness by Industry, 2023 to 2033

Figure 60: Latin America Market Attractiveness by Country, 2023 to 2033

Figure 61: Western Europe Market Value (US$ Million) by Solution, 2023 to 2033

Figure 62: Western Europe Market Value (US$ Million) by Enterprise Size, 2023 to 2033

Figure 63: Western Europe Market Value (US$ Million) by Industry, 2023 to 2033

Figure 64: Western Europe Market Value (US$ Million) by Country, 2023 to 2033

Figure 65: Western Europe Market Value (US$ Million) Analysis by Country, 2018 to 2033

Figure 66: Western Europe Market Value Share (%) and BPS Analysis by Country, 2023 to 2033

Figure 67: Western Europe Market Y-o-Y Growth (%) Projections by Country, 2023 to 2033

Figure 68: Western Europe Market Value (US$ Million) Analysis by Solution, 2018 to 2033

Figure 69: Western Europe Market Value Share (%) and BPS Analysis by Solution, 2023 to 2033

Figure 70: Western Europe Market Y-o-Y Growth (%) Projections by Solution, 2023 to 2033

Figure 71: Western Europe Market Value (US$ Million) Analysis by Enterprise Size, 2018 to 2033

Figure 72: Western Europe Market Value Share (%) and BPS Analysis by Enterprise Size, 2023 to 2033

Figure 73: Western Europe Market Y-o-Y Growth (%) Projections by Enterprise Size, 2023 to 2033

Figure 74: Western Europe Market Value (US$ Million) Analysis by Industry, 2018 to 2033

Figure 75: Western Europe Market Value Share (%) and BPS Analysis by Industry, 2023 to 2033

Figure 76: Western Europe Market Y-o-Y Growth (%) Projections by Industry, 2023 to 2033

Figure 77: Western Europe Market Attractiveness by Solution, 2023 to 2033

Figure 78: Western Europe Market Attractiveness by Enterprise Size, 2023 to 2033

Figure 79: Western Europe Market Attractiveness by Industry, 2023 to 2033

Figure 80: Western Europe Market Attractiveness by Country, 2023 to 2033

Figure 81: Eastern Europe Market Value (US$ Million) by Solution, 2023 to 2033

Figure 82: Eastern Europe Market Value (US$ Million) by Enterprise Size, 2023 to 2033

Figure 83: Eastern Europe Market Value (US$ Million) by Industry, 2023 to 2033

Figure 84: Eastern Europe Market Value (US$ Million) by Country, 2023 to 2033

Figure 85: Eastern Europe Market Value (US$ Million) Analysis by Country, 2018 to 2033

Figure 86: Eastern Europe Market Value Share (%) and BPS Analysis by Country, 2023 to 2033

Figure 87: Eastern Europe Market Y-o-Y Growth (%) Projections by Country, 2023 to 2033

Figure 88: Eastern Europe Market Value (US$ Million) Analysis by Solution, 2018 to 2033

Figure 89: Eastern Europe Market Value Share (%) and BPS Analysis by Solution, 2023 to 2033

Figure 90: Eastern Europe Market Y-o-Y Growth (%) Projections by Solution, 2023 to 2033

Figure 91: Eastern Europe Market Value (US$ Million) Analysis by Enterprise Size, 2018 to 2033

Figure 92: Eastern Europe Market Value Share (%) and BPS Analysis by Enterprise Size, 2023 to 2033

Figure 93: Eastern Europe Market Y-o-Y Growth (%) Projections by Enterprise Size, 2023 to 2033

Figure 94: Eastern Europe Market Value (US$ Million) Analysis by Industry, 2018 to 2033

Figure 95: Eastern Europe Market Value Share (%) and BPS Analysis by Industry, 2023 to 2033

Figure 96: Eastern Europe Market Y-o-Y Growth (%) Projections by Industry, 2023 to 2033

Figure 97: Eastern Europe Market Attractiveness by Solution, 2023 to 2033

Figure 98: Eastern Europe Market Attractiveness by Enterprise Size, 2023 to 2033

Figure 99: Eastern Europe Market Attractiveness by Industry, 2023 to 2033

Figure 100: Eastern Europe Market Attractiveness by Country, 2023 to 2033

Figure 101: South Asia and Pacific Market Value (US$ Million) by Solution, 2023 to 2033

Figure 102: South Asia and Pacific Market Value (US$ Million) by Enterprise Size, 2023 to 2033

Figure 103: South Asia and Pacific Market Value (US$ Million) by Industry, 2023 to 2033

Figure 104: South Asia and Pacific Market Value (US$ Million) by Country, 2023 to 2033

Figure 105: South Asia and Pacific Market Value (US$ Million) Analysis by Country, 2018 to 2033

Figure 106: South Asia and Pacific Market Value Share (%) and BPS Analysis by Country, 2023 to 2033

Figure 107: South Asia and Pacific Market Y-o-Y Growth (%) Projections by Country, 2023 to 2033

Figure 108: South Asia and Pacific Market Value (US$ Million) Analysis by Solution, 2018 to 2033

Figure 109: South Asia and Pacific Market Value Share (%) and BPS Analysis by Solution, 2023 to 2033

Figure 110: South Asia and Pacific Market Y-o-Y Growth (%) Projections by Solution, 2023 to 2033

Figure 111: South Asia and Pacific Market Value (US$ Million) Analysis by Enterprise Size, 2018 to 2033

Figure 112: South Asia and Pacific Market Value Share (%) and BPS Analysis by Enterprise Size, 2023 to 2033

Figure 113: South Asia and Pacific Market Y-o-Y Growth (%) Projections by Enterprise Size, 2023 to 2033

Figure 114: South Asia and Pacific Market Value (US$ Million) Analysis by Industry, 2018 to 2033

Figure 115: South Asia and Pacific Market Value Share (%) and BPS Analysis by Industry, 2023 to 2033

Figure 116: South Asia and Pacific Market Y-o-Y Growth (%) Projections by Industry, 2023 to 2033

Figure 117: South Asia and Pacific Market Attractiveness by Solution, 2023 to 2033

Figure 118: South Asia and Pacific Market Attractiveness by Enterprise Size, 2023 to 2033

Figure 119: South Asia and Pacific Market Attractiveness by Industry, 2023 to 2033

Figure 120: South Asia and Pacific Market Attractiveness by Country, 2023 to 2033

Figure 121: East Asia Market Value (US$ Million) by Solution, 2023 to 2033

Figure 122: East Asia Market Value (US$ Million) by Enterprise Size, 2023 to 2033

Figure 123: East Asia Market Value (US$ Million) by Industry, 2023 to 2033

Figure 124: East Asia Market Value (US$ Million) by Country, 2023 to 2033

Figure 125: East Asia Market Value (US$ Million) Analysis by Country, 2018 to 2033

Figure 126: East Asia Market Value Share (%) and BPS Analysis by Country, 2023 to 2033

Figure 127: East Asia Market Y-o-Y Growth (%) Projections by Country, 2023 to 2033

Figure 128: East Asia Market Value (US$ Million) Analysis by Solution, 2018 to 2033

Figure 129: East Asia Market Value Share (%) and BPS Analysis by Solution, 2023 to 2033

Figure 130: East Asia Market Y-o-Y Growth (%) Projections by Solution, 2023 to 2033

Figure 131: East Asia Market Value (US$ Million) Analysis by Enterprise Size, 2018 to 2033

Figure 132: East Asia Market Value Share (%) and BPS Analysis by Enterprise Size, 2023 to 2033

Figure 133: East Asia Market Y-o-Y Growth (%) Projections by Enterprise Size, 2023 to 2033

Figure 134: East Asia Market Value (US$ Million) Analysis by Industry, 2018 to 2033

Figure 135: East Asia Market Value Share (%) and BPS Analysis by Industry, 2023 to 2033

Figure 136: East Asia Market Y-o-Y Growth (%) Projections by Industry, 2023 to 2033

Figure 137: East Asia Market Attractiveness by Solution, 2023 to 2033

Figure 138: East Asia Market Attractiveness by Enterprise Size, 2023 to 2033

Figure 139: East Asia Market Attractiveness by Industry, 2023 to 2033

Figure 140: East Asia Market Attractiveness by Country, 2023 to 2033

Figure 141: Middle East and Africa Market Value (US$ Million) by Solution, 2023 to 2033

Figure 142: Middle East and Africa Market Value (US$ Million) by Enterprise Size, 2023 to 2033

Figure 143: Middle East and Africa Market Value (US$ Million) by Industry, 2023 to 2033

Figure 144: Middle East and Africa Market Value (US$ Million) by Country, 2023 to 2033

Figure 145: Middle East and Africa Market Value (US$ Million) Analysis by Country, 2018 to 2033

Figure 146: Middle East and Africa Market Value Share (%) and BPS Analysis by Country, 2023 to 2033

Figure 147: Middle East and Africa Market Y-o-Y Growth (%) Projections by Country, 2023 to 2033

Figure 148: Middle East and Africa Market Value (US$ Million) Analysis by Solution, 2018 to 2033

Figure 149: Middle East and Africa Market Value Share (%) and BPS Analysis by Solution, 2023 to 2033

Figure 150: Middle East and Africa Market Y-o-Y Growth (%) Projections by Solution, 2023 to 2033

Figure 151: Middle East and Africa Market Value (US$ Million) Analysis by Enterprise Size, 2018 to 2033

Figure 152: Middle East and Africa Market Value Share (%) and BPS Analysis by Enterprise Size, 2023 to 2033

Figure 153: Middle East and Africa Market Y-o-Y Growth (%) Projections by Enterprise Size, 2023 to 2033

Figure 154: Middle East and Africa Market Value (US$ Million) Analysis by Industry, 2018 to 2033

Figure 155: Middle East and Africa Market Value Share (%) and BPS Analysis by Industry, 2023 to 2033

Figure 156: Middle East and Africa Market Y-o-Y Growth (%) Projections by Industry, 2023 to 2033

Figure 157: Middle East and Africa Market Attractiveness by Solution, 2023 to 2033

Figure 158: Middle East and Africa Market Attractiveness by Enterprise Size, 2023 to 2033

Figure 159: Middle East and Africa Market Attractiveness by Industry, 2023 to 2033

Figure 160: Middle East and Africa Market Attractiveness by Country, 2023 to 2033

Recommendations

Technology

IoT Processor Market

Published : August 2023

Technology

5G IoT Market

Published : June 2023

Technology

IoT Connectivity Management Platform Market

Published : February 2023

Technology

IoT Device Management Platform Market

Published : June 2022

Explore Technology Insights

View Reports

IoT Application Enablement Market